| Param | Original file | Final file |
|---|---|---|
| Filename | modeM0/AS1A03_092T01_9000001240_08946cztM0_level2.evt | modeM0/AS1A03_092T01_9000001240_08946cztM0_level2_quad_clean.evt |
| Size (bytes) | 451,468,800 | 99,564,480 |
| Size | 430.6 MB | 95.0 MB |
| Events in quadrant A | 3,473,400 | 645,945 |
| Events in quadrant B | 3,252,286 | 654,089 |
| Events in quadrant C | 3,065,470 | 639,261 |
| Events in quadrant D | 3,441,956 | 625,121 |
| Mode M9 | |||
|---|---|---|---|
| Quadrant | BADHDUFLAG | Total packets | Discarded packets |
| A | 0 | 20 | 0 |
| B | 0 | 20 | 0 |
| C | 0 | 20 | 0 |
| D | 0 | 21 | 0 |
| Mode SS | |||
|---|---|---|---|
| Quadrant | BADHDUFLAG | Total packets | Discarded packets |
| A | 0 | 130 | 0 |
| B | 0 | 130 | 0 |
| C | 0 | 130 | 0 |
| D | 0 | 130 | 0 |
| Mode M0 | |||
|---|---|---|---|
| Quadrant | BADHDUFLAG | Total packets | Discarded packets |
| A | 0 | 14332 | 3 |
| B | 0 | 13670 | 2 |
| C | 0 | 13410 | 2 |
| D | 0 | 14100 | 2 |
| Quadrant | Total seconds | Saturated seconds | Saturation percentage |
|---|---|---|---|
| A | 6470 | 156 | 2.411128% |
| B | 6470 | 145 | 2.241113% |
| C | 6470 | 100 | 1.545595% |
| D | 6470 | 126 | 1.947450% |
Noise dominated data is calculated using 1-second bins in cleaned event files. If a bin has >2000 counts, and if more than 50% of those come from <1% of pixels, then it is considered to be noise-dominated and hence unusable.
| Quadrant | # 1 sec bins | Bins with >0 counts | Bins with >2000 counts | High rate bins dominated by noise | Noise dominated (total time) | Noise dominated (detector-on time) | Marked lightcurve |
|---|---|---|---|---|---|---|---|
| A | 7595 | 6470 | 22 | 22 | 0.29% | 0.34% | 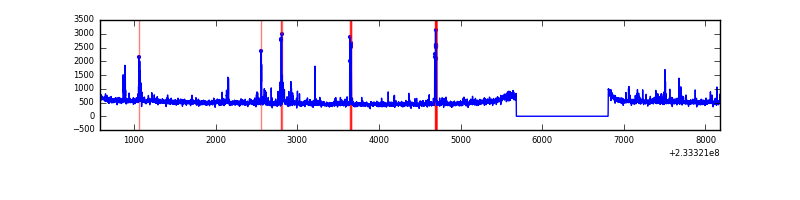 |
| B | 7595 | 6470 | 2 | 2 | 0.03% | 0.03% | 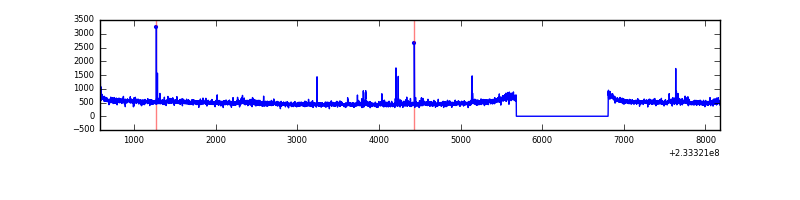 |
| C | 7595 | 6470 | 0 | 0 | 0.00% | 0.00% | 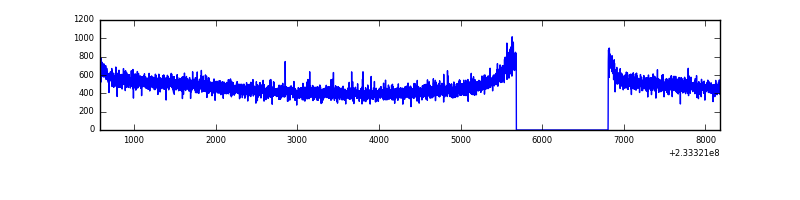 |
| D | 7595 | 6470 | 8 | 8 | 0.11% | 0.12% | 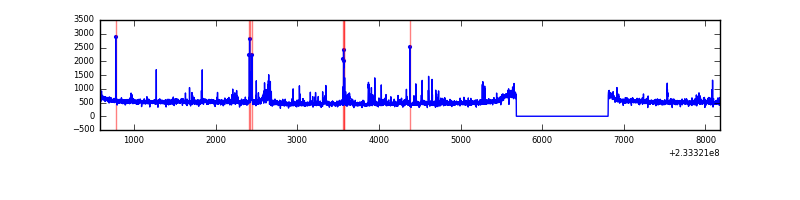 |
Top three noisy pixels from each quadrant. If the there are fewer than three noisy pixels in the level2.evt file, extra rows are filled as -1
| Pixel properties | Quadrant properties | ||||||
|---|---|---|---|---|---|---|---|
| Quadrant | DetID | PixID | Counts | Sigma | Mean | Median | Sigma |
| A | 8 | 5 | 181772 | 1099.21 | 816 | 800 | 164.6 |
| A | 5 | 16 | 60520 | 362.73 | 816 | 800 | 164.6 |
| A | 15 | 174 | 46434 | 277.18 | 816 | 800 | 164.6 |
| B | 0 | 219 | 27381 | 173.22 | 813 | 795 | 153.5 |
| B | 0 | 214 | 17513 | 108.92 | 813 | 795 | 153.5 |
| B | 12 | 111 | 15708 | 97.16 | 813 | 795 | 153.5 |
| C | 13 | 61 | 6032 | 29.18 | 785 | 787 | 179.8 |
| C | 1 | 3 | 3200 | 13.42 | 785 | 787 | 179.8 |
| C | 3 | 202 | 1963 | 6.54 | 785 | 787 | 179.8 |
| D | 8 | 195 | 184903 | 893.8 | 792 | 770 | 206.0 |
| D | 1 | 52 | 67322 | 323.05 | 792 | 770 | 206.0 |
| D | 13 | 29 | 46690 | 222.9 | 792 | 770 | 206.0 |
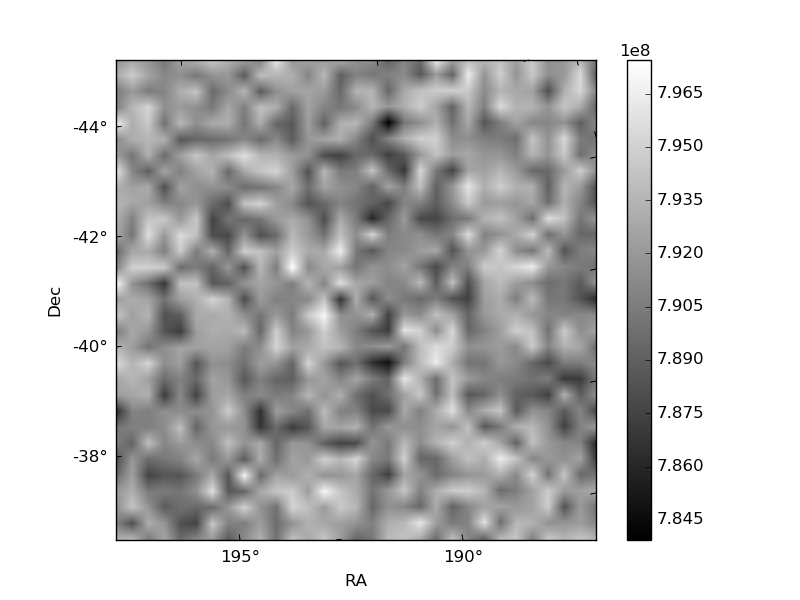
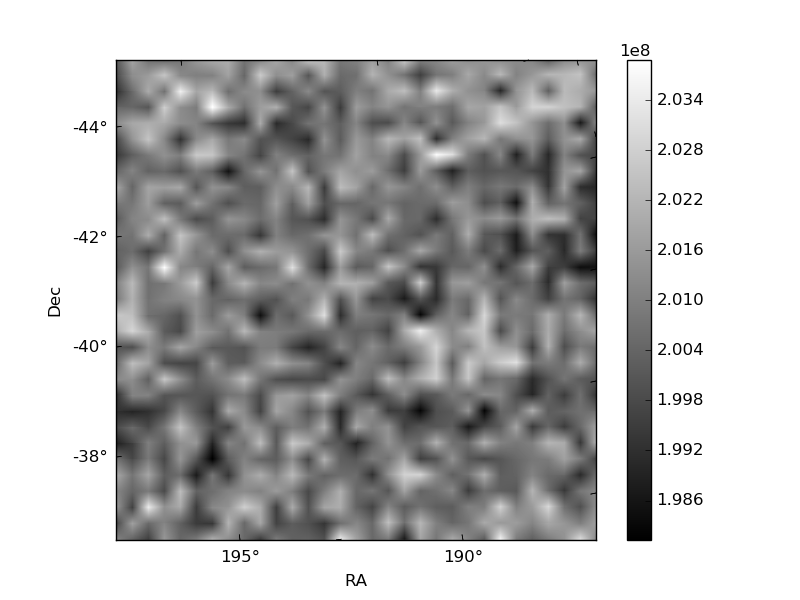
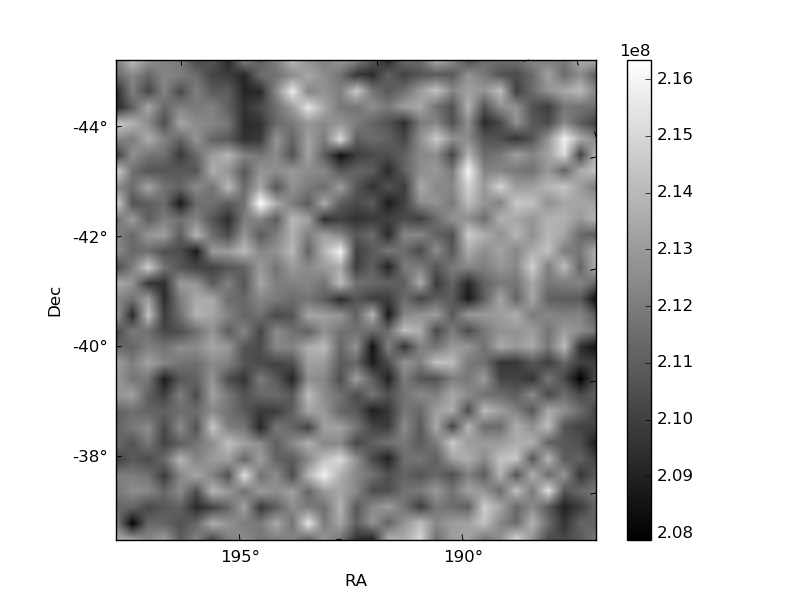
Histogram calculated using DETX and DETY for each event in the final _common_clean file
| Quadrant A | 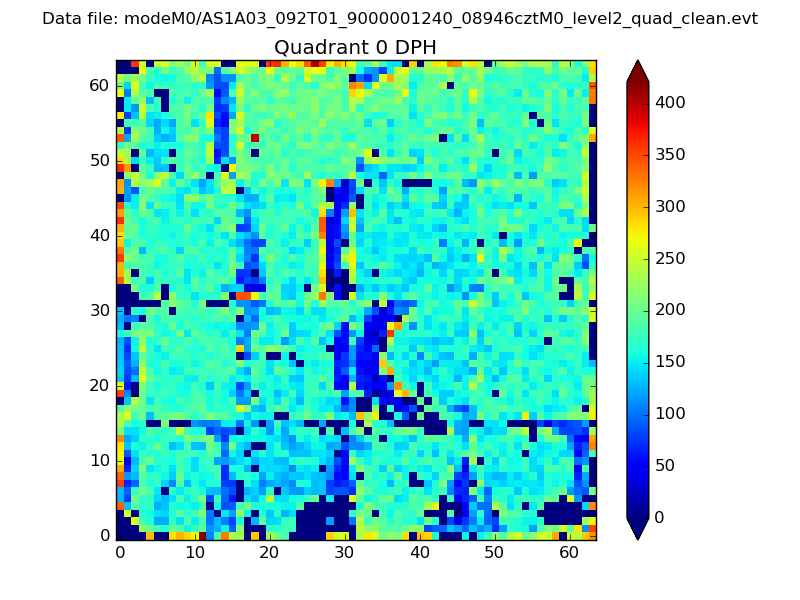 |
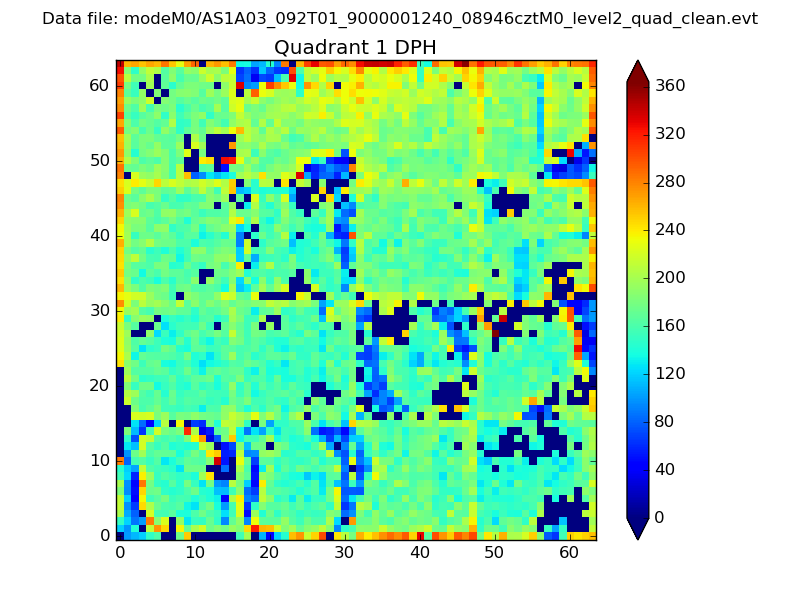 |
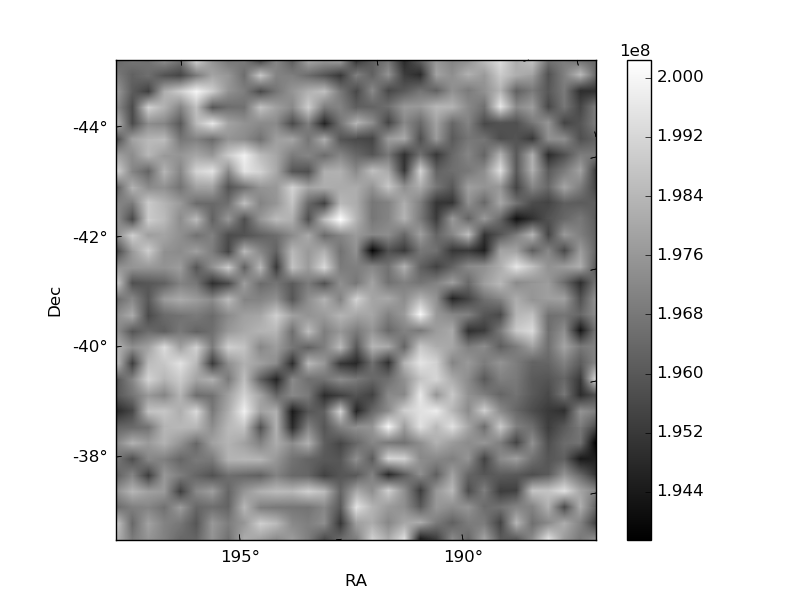
Quadrant B |
|---|---|---|---|
| Quadrant D | 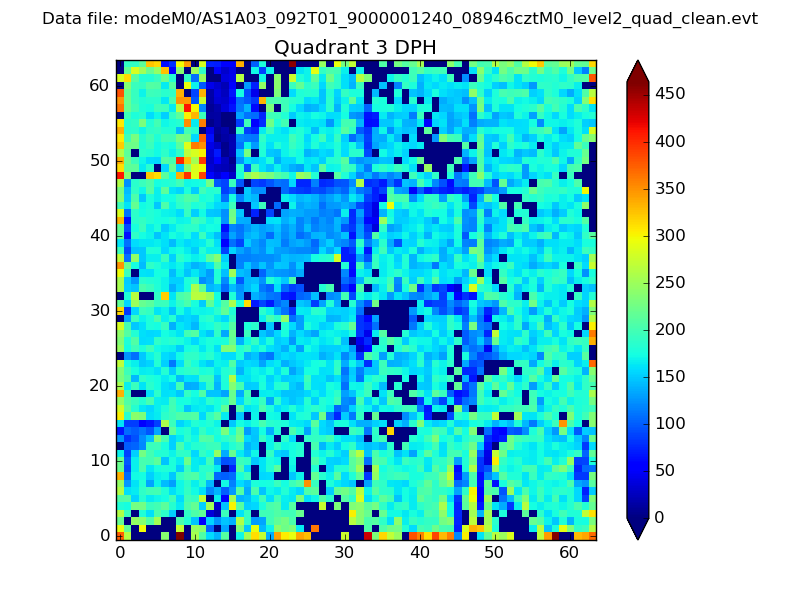 |
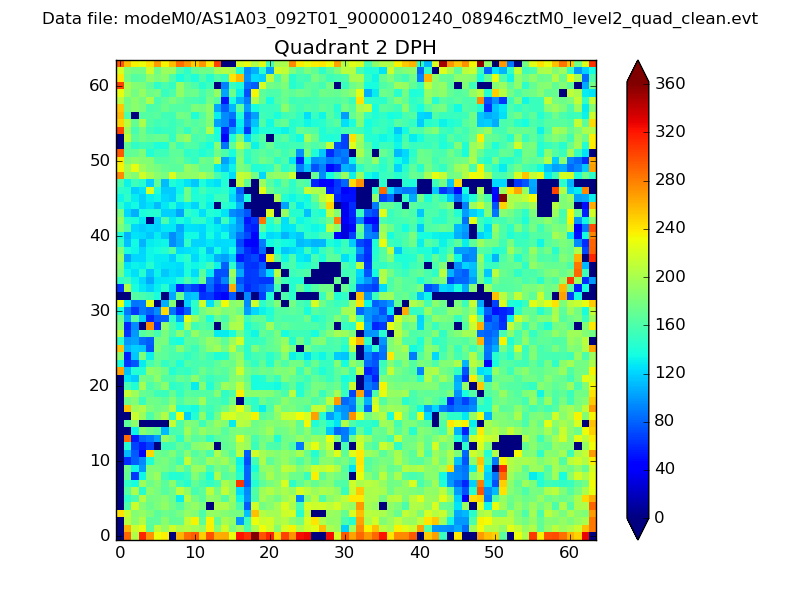 |
Quadrant C |
| Plot type | Count rate plots | Images |
|---|---|---|
| Comparison with Poisson distribution Blue bars denote a histogram of data divided into 1 sec bins. Red curve is a Poisson curve with rate = median count rate of data. |
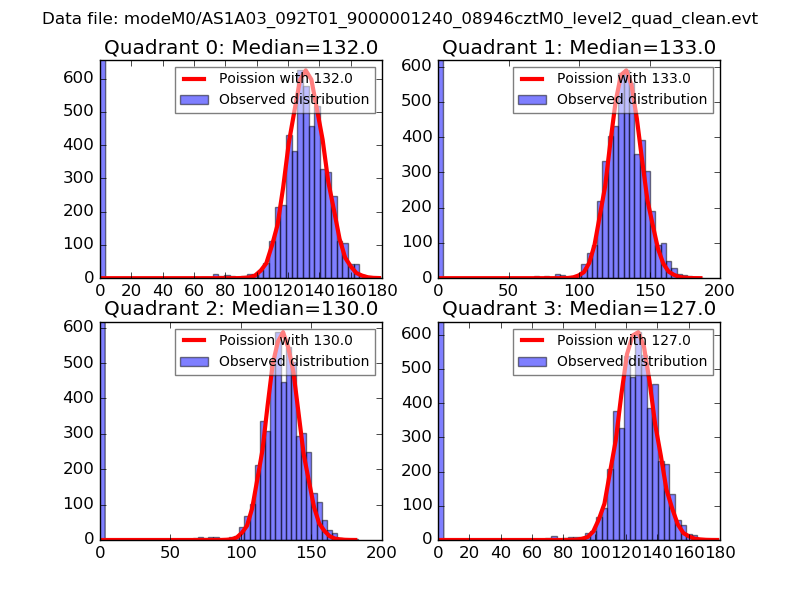 |
 |
| Quadrant-wise count rates Data is divided into 100 sec bins |
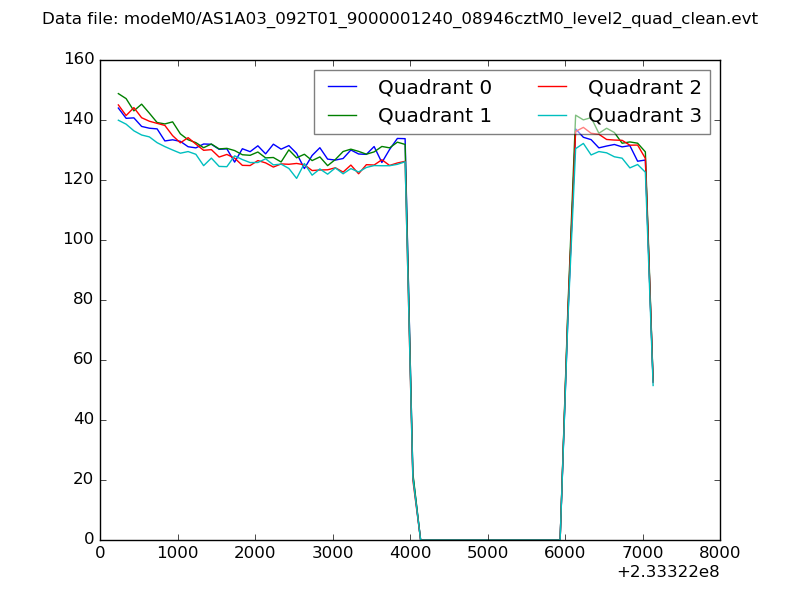 |
|
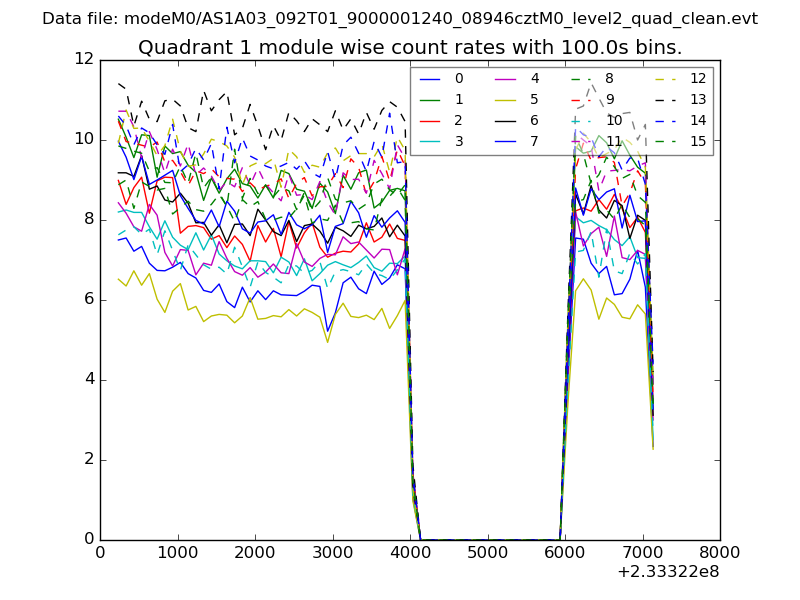
| Module-wise count rates for Quadrant A Data is divided into 100 sec bins |
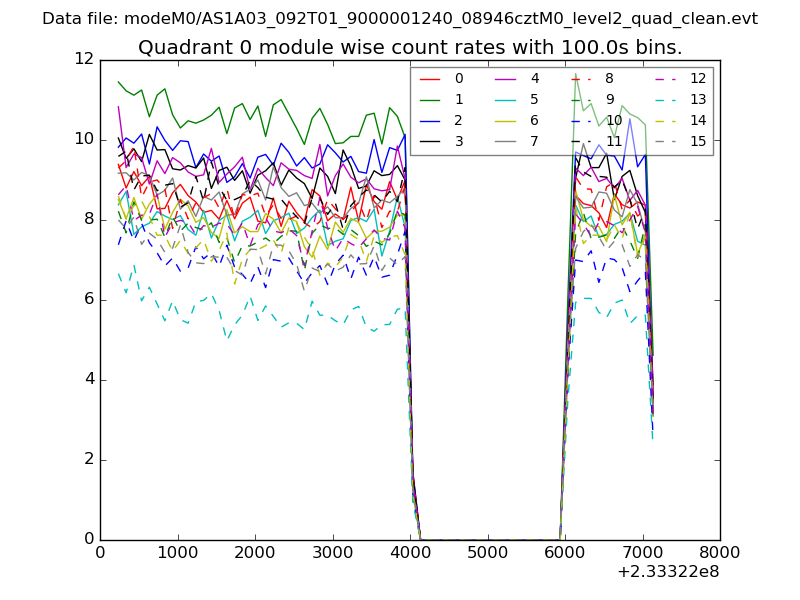 |
 |
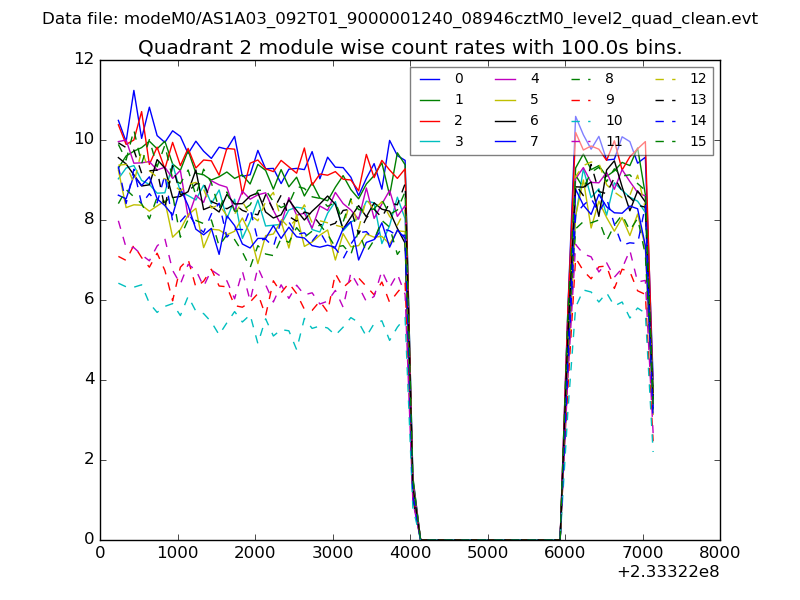
| Module-wise count rates for Quadrant B Data is divided into 100 sec bins |
 |
 |
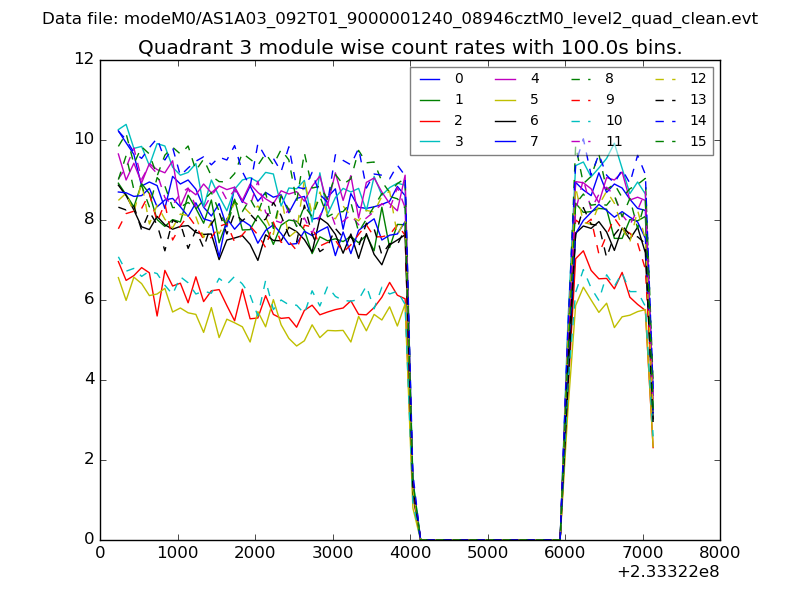
| Module-wise count rates for Quadrant C Data is divided into 100 sec bins |
 |
 |
| Module-wise count rates for Quadrant D Data is divided into 100 sec bins |
 |
 |
| Parameter | Plot |
|---|---|
| CZT HV Monitor | 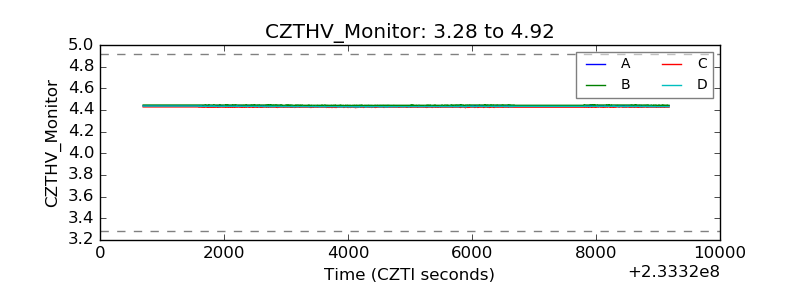 |
| D_VDD |  |
| Temperature 1 | 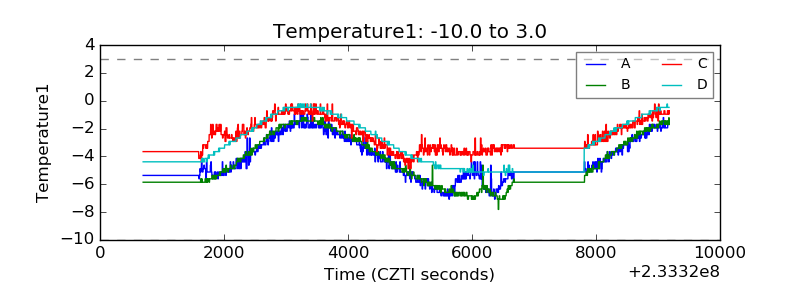 |
| Veto HV Monitor | 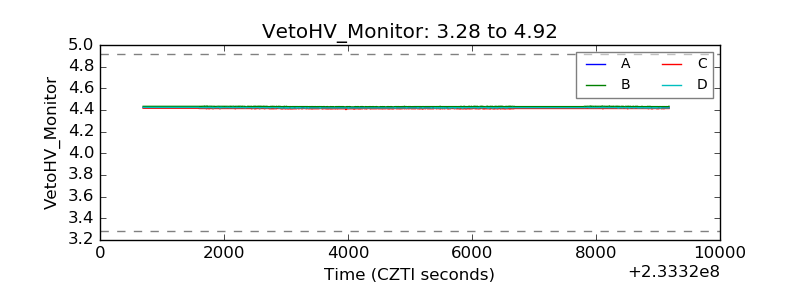 |
| Veto LLD | 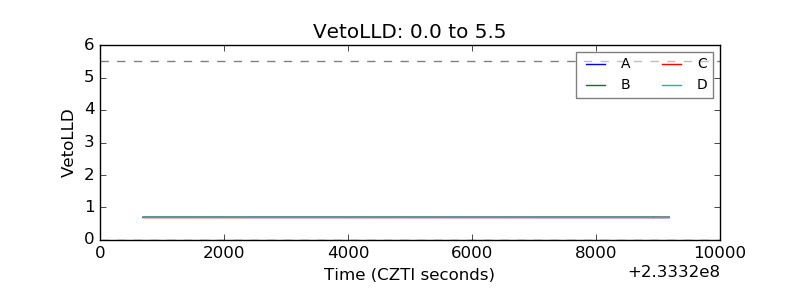 |
| Alpha Counter | 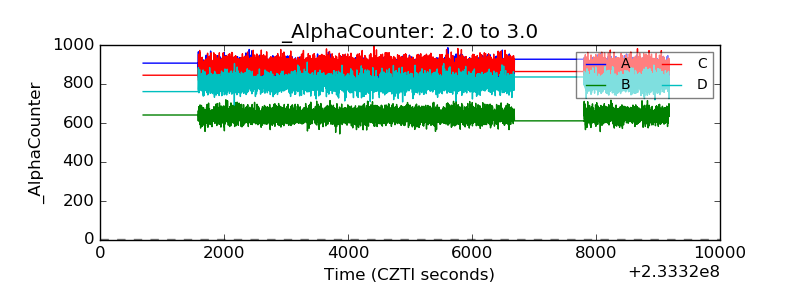 |
| _CPM_Rate | 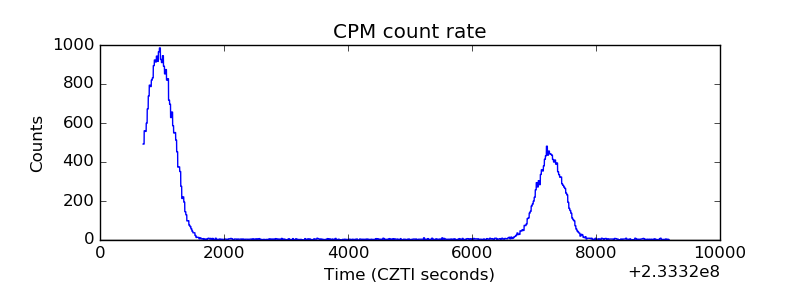 |
| CZT Counter | 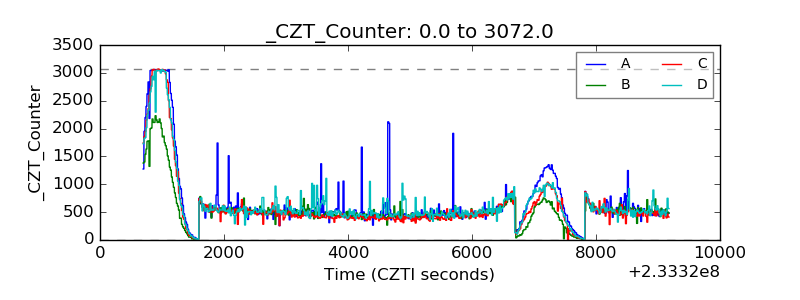 |
| +2.5 Volts monitor | 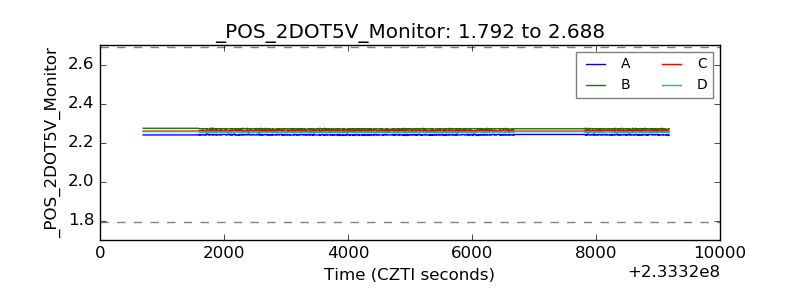 |
| +5 Volts monitor |  |
| _ROLL_ROT | 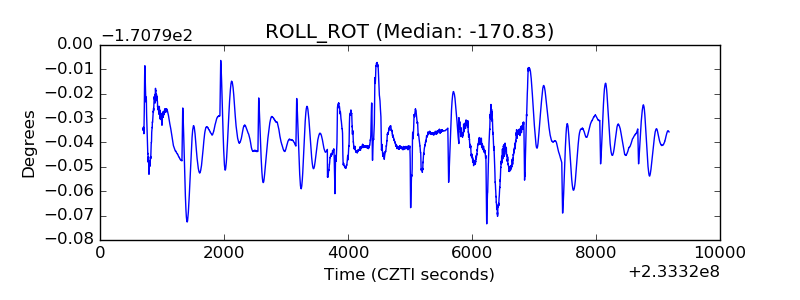 |
| _Roll_DEC | 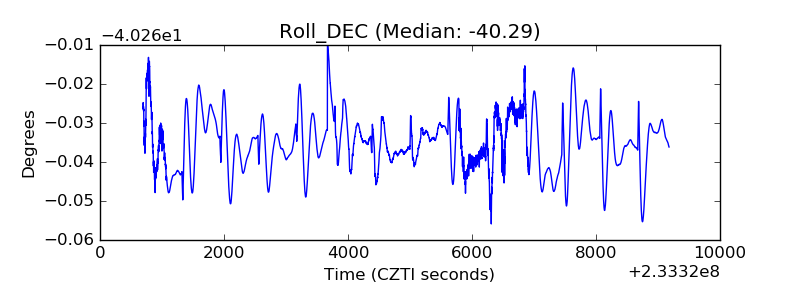 |
| _Roll_RA | 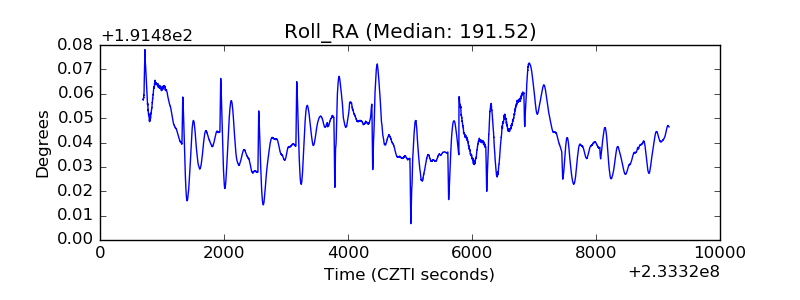 |
| Veto Counter | 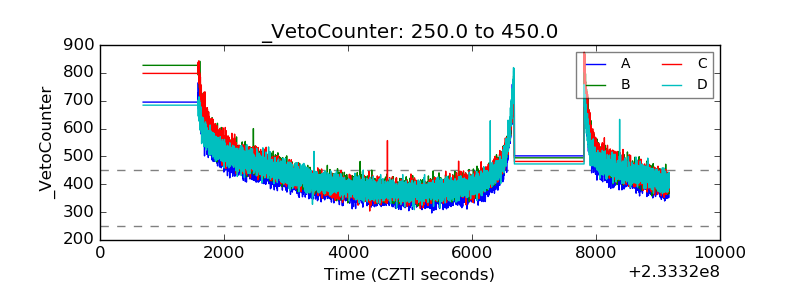 |