| Param | Original file | Final file |
|---|---|---|
| Filename | modeM0/AS1A03_092T01_9000001240_08947cztM0_level2.evt | modeM0/AS1A03_092T01_9000001240_08947cztM0_level2_quad_clean.evt |
| Size (bytes) | 431,049,600 | 97,885,440 |
| Size | 411.1 MB | 93.4 MB |
| Events in quadrant A | 3,193,792 | 636,656 |
| Events in quadrant B | 3,091,558 | 642,579 |
| Events in quadrant C | 2,865,076 | 628,937 |
| Events in quadrant D | 3,471,720 | 613,030 |
| Mode M9 | |||
|---|---|---|---|
| Quadrant | BADHDUFLAG | Total packets | Discarded packets |
| A | 0 | 8 | 0 |
| B | 0 | 8 | 0 |
| C | 0 | 8 | 0 |
| D | 0 | 8 | 0 |
| Mode SS | |||
|---|---|---|---|
| Quadrant | BADHDUFLAG | Total packets | Discarded packets |
| A | 0 | 130 | 0 |
| B | 0 | 130 | 0 |
| C | 0 | 130 | 0 |
| D | 0 | 130 | 0 |
| Mode M0 | |||
|---|---|---|---|
| Quadrant | BADHDUFLAG | Total packets | Discarded packets |
| A | 0 | 13546 | 2 |
| B | 0 | 13228 | 1 |
| C | 0 | 12997 | 1 |
| D | 0 | 14465 | 1 |
| Quadrant | Total seconds | Saturated seconds | Saturation percentage |
|---|---|---|---|
| A | 6349 | 155 | 2.441329% |
| B | 6349 | 138 | 2.173571% |
| C | 6349 | 106 | 1.669554% |
| D | 6349 | 185 | 2.913845% |
Noise dominated data is calculated using 1-second bins in cleaned event files. If a bin has >2000 counts, and if more than 50% of those come from <1% of pixels, then it is considered to be noise-dominated and hence unusable.
| Quadrant | # 1 sec bins | Bins with >0 counts | Bins with >2000 counts | High rate bins dominated by noise | Noise dominated (total time) | Noise dominated (detector-on time) | Marked lightcurve |
|---|---|---|---|---|---|---|---|
| A | 7219 | 6349 | 8 | 8 | 0.11% | 0.13% | 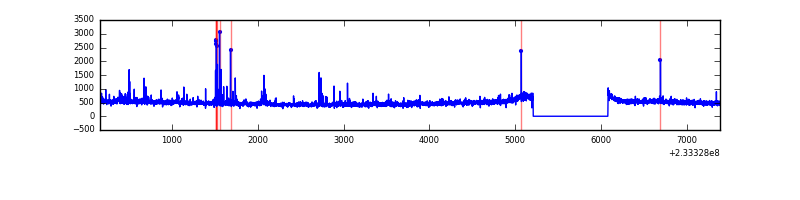 |
| B | 7219 | 6349 | 2 | 2 | 0.03% | 0.03% | 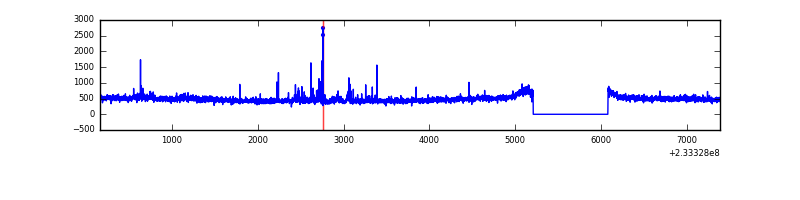 |
| C | 7219 | 6349 | 0 | 0 | 0.00% | 0.00% | 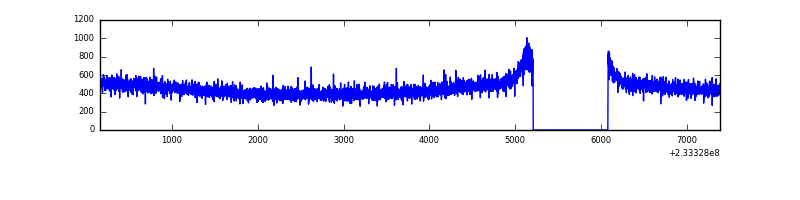 |
| D | 7219 | 6349 | 51 | 51 | 0.71% | 0.80% | 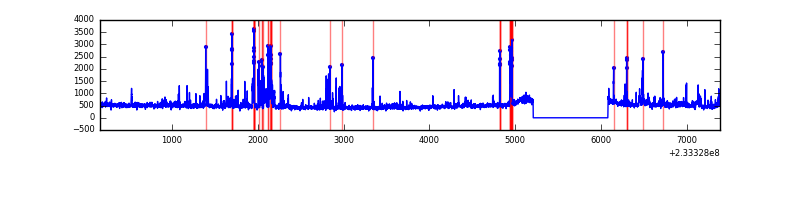 |
Top three noisy pixels from each quadrant. If the there are fewer than three noisy pixels in the level2.evt file, extra rows are filled as -1
| Pixel properties | Quadrant properties | ||||||
|---|---|---|---|---|---|---|---|
| Quadrant | DetID | PixID | Counts | Sigma | Mean | Median | Sigma |
| A | 8 | 5 | 174041 | 1106.57 | 766 | 749 | 156.6 |
| A | 5 | 16 | 51312 | 322.87 | 766 | 749 | 156.6 |
| A | 15 | 174 | 9848 | 58.1 | 766 | 749 | 156.6 |
| B | 0 | 219 | 50763 | 342.55 | 764 | 747 | 146.0 |
| B | 0 | 214 | 21691 | 143.44 | 764 | 747 | 146.0 |
| B | 12 | 111 | 15088 | 98.22 | 764 | 747 | 146.0 |
| C | 13 | 61 | 5586 | 28.77 | 733 | 734 | 168.6 |
| C | 1 | 3 | 3403 | 15.83 | 733 | 734 | 168.6 |
| C | 14 | 234 | 2204 | 8.72 | 733 | 734 | 168.6 |
| D | 12 | 233 | 242648 | 1232.87 | 736 | 719 | 196.2 |
| D | 1 | 52 | 149271 | 757.02 | 736 | 719 | 196.2 |
| D | 8 | 195 | 148031 | 750.7 | 736 | 719 | 196.2 |
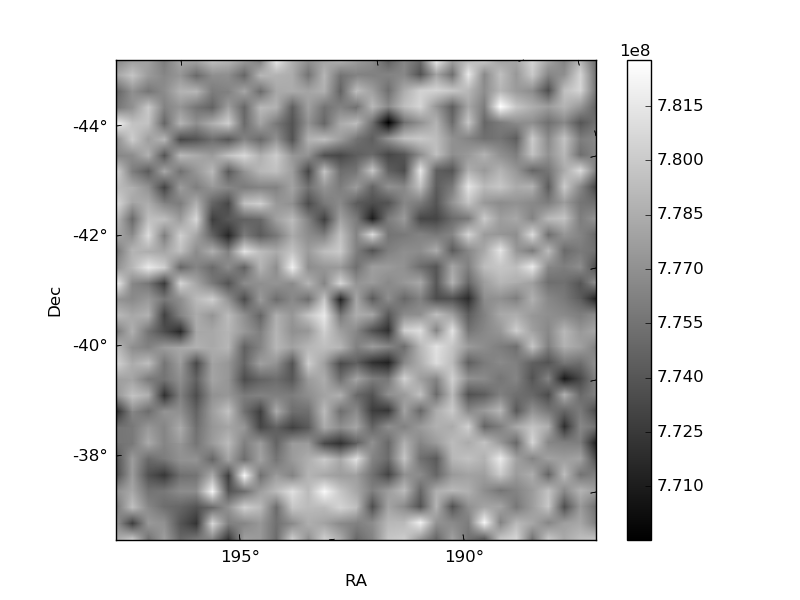
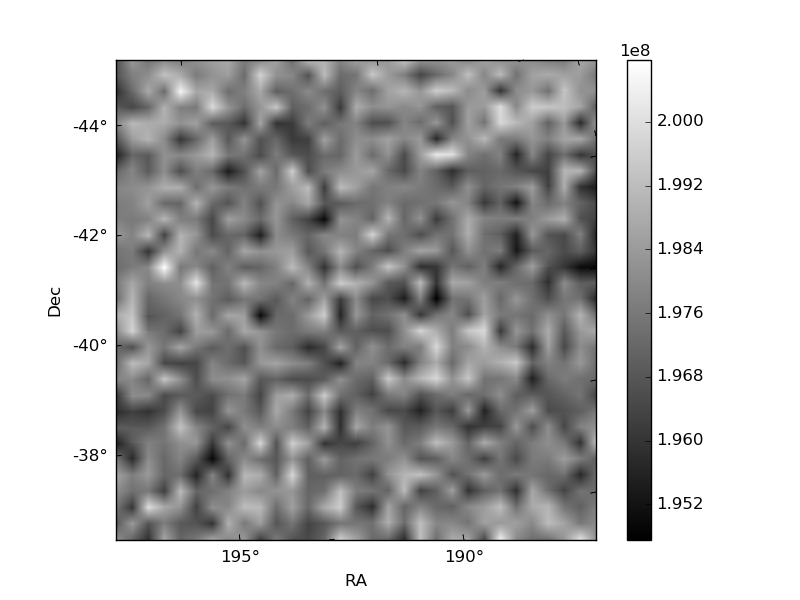
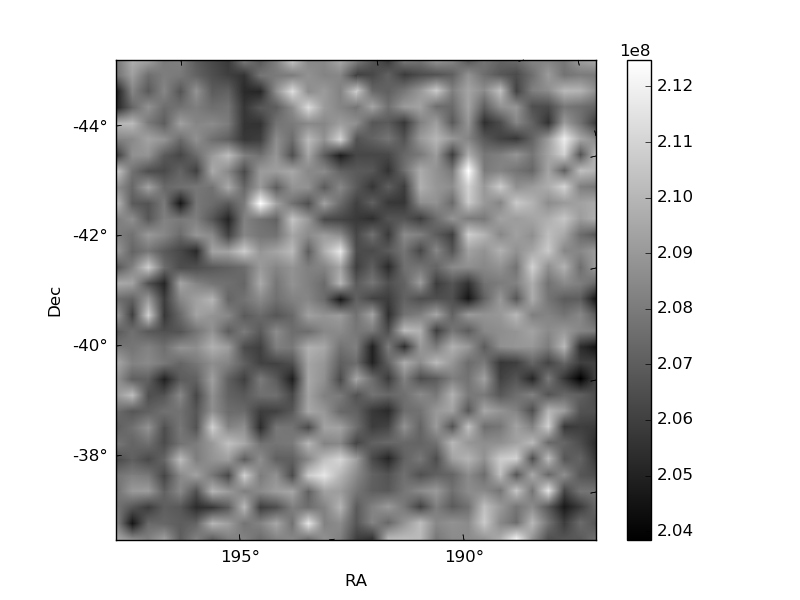
Histogram calculated using DETX and DETY for each event in the final _common_clean file
| Quadrant A | 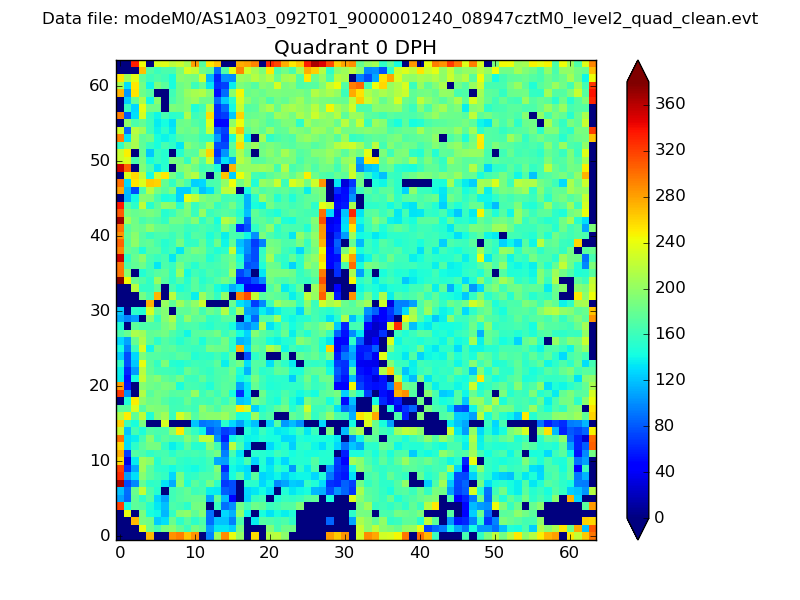 |
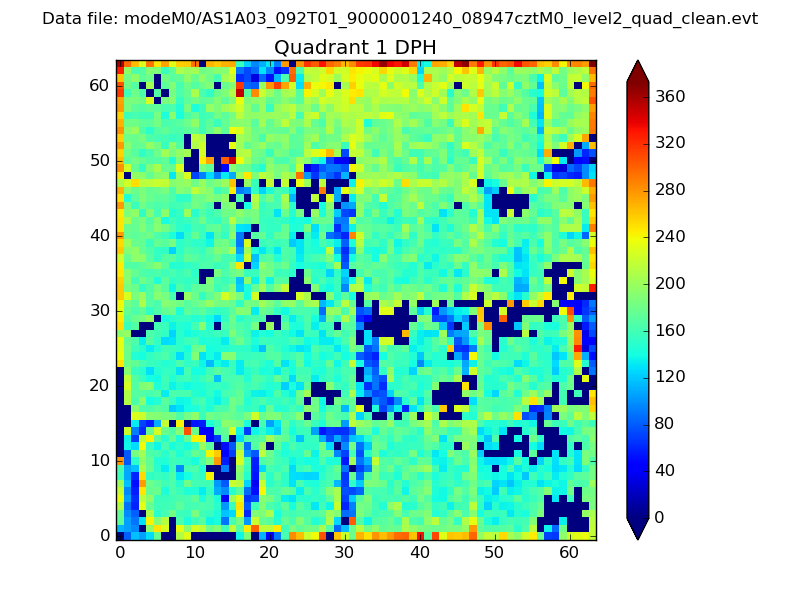 |
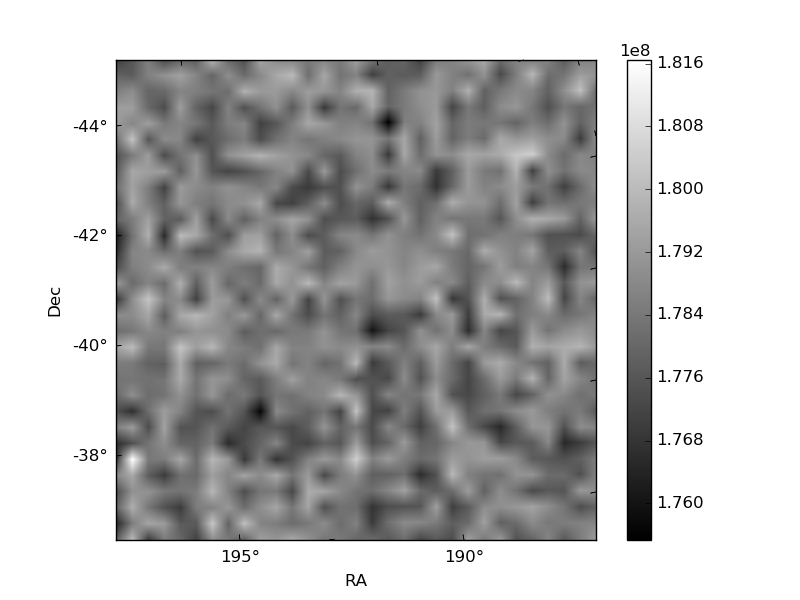
Quadrant B |
|---|---|---|---|
| Quadrant D | 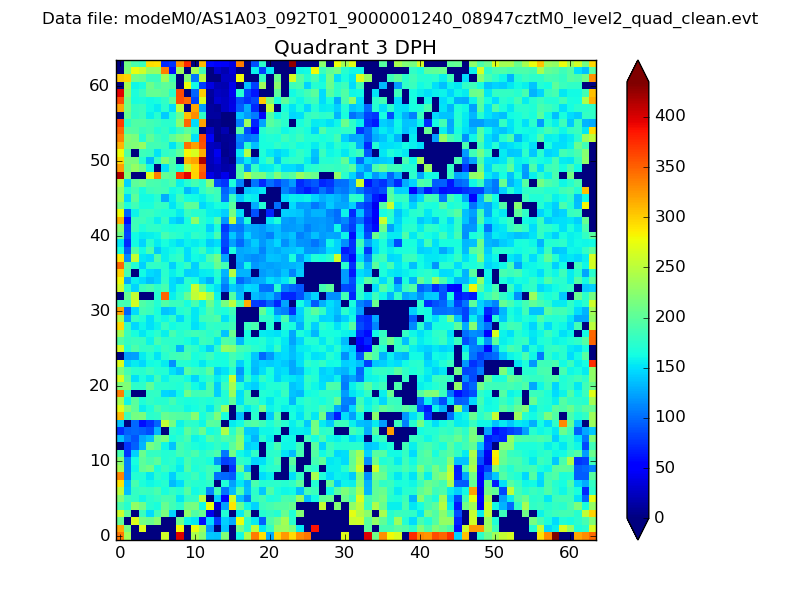 |
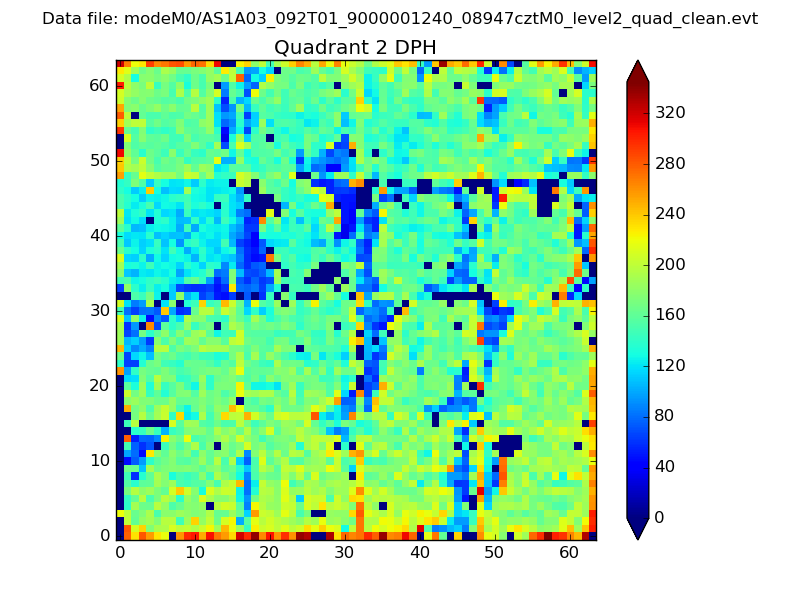 |
Quadrant C |
| Plot type | Count rate plots | Images |
|---|---|---|
| Comparison with Poisson distribution Blue bars denote a histogram of data divided into 1 sec bins. Red curve is a Poisson curve with rate = median count rate of data. |
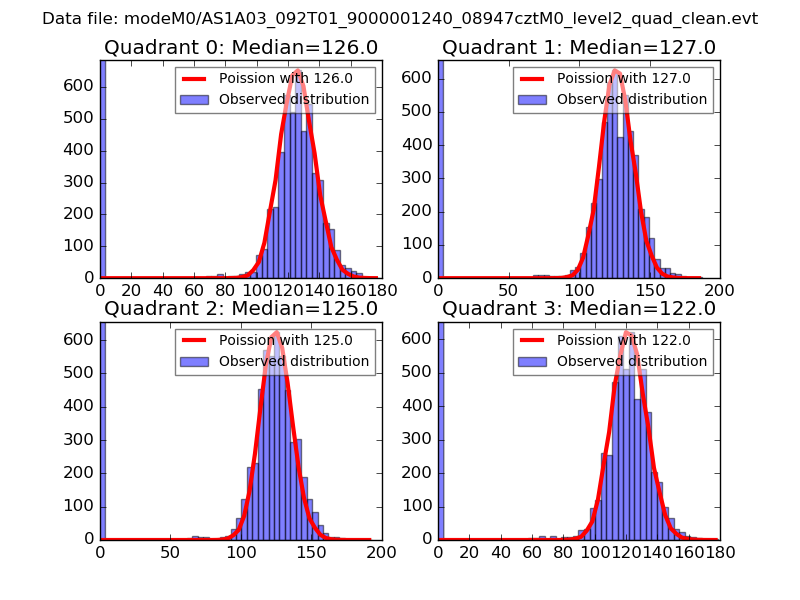 |
 |
| Quadrant-wise count rates Data is divided into 100 sec bins |
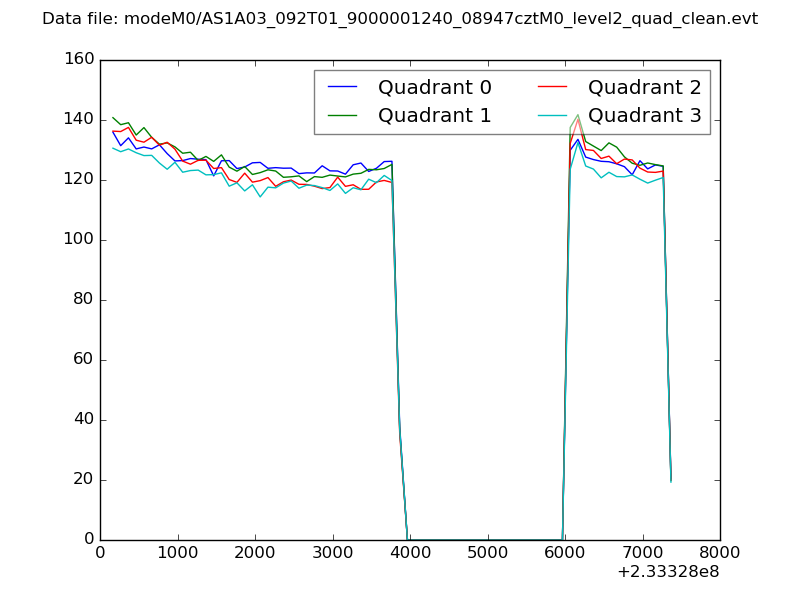 |
|
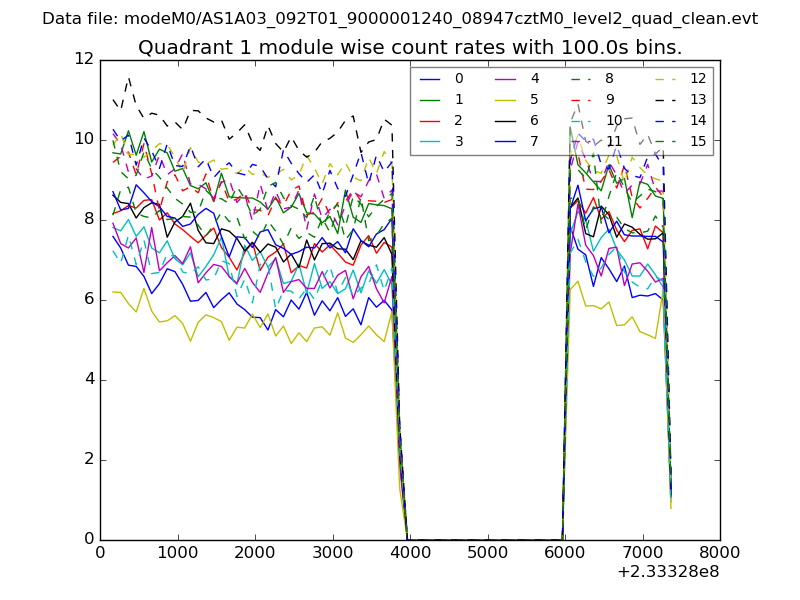
| Module-wise count rates for Quadrant A Data is divided into 100 sec bins |
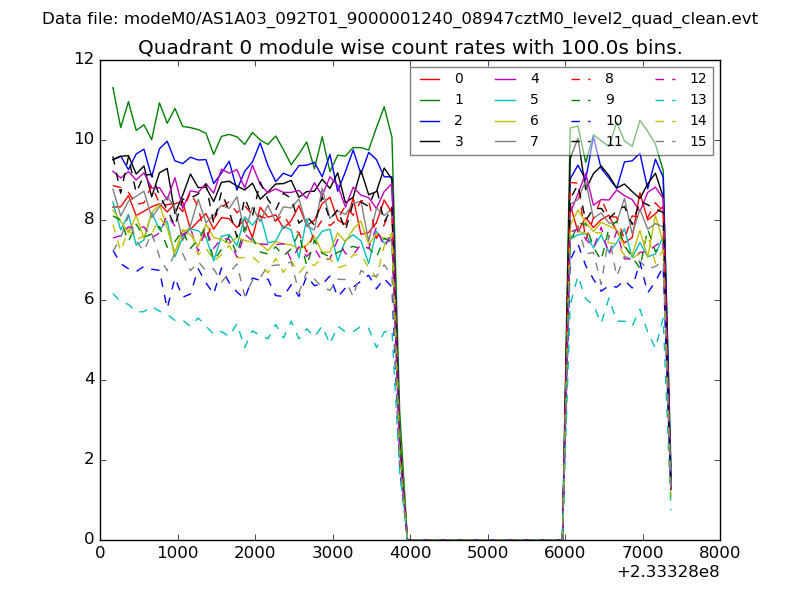 |
 |
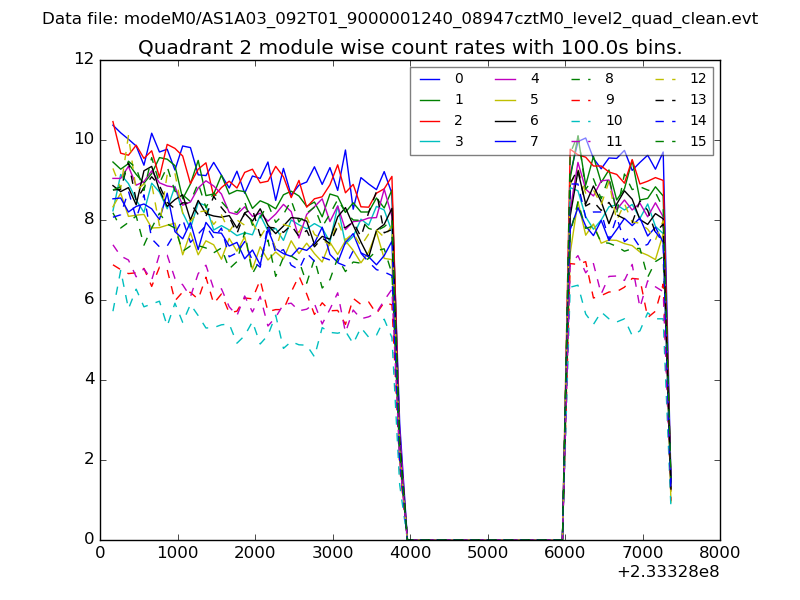
| Module-wise count rates for Quadrant B Data is divided into 100 sec bins |
 |
 |
| Module-wise count rates for Quadrant C Data is divided into 100 sec bins |
 |
 |
| Module-wise count rates for Quadrant D Data is divided into 100 sec bins |
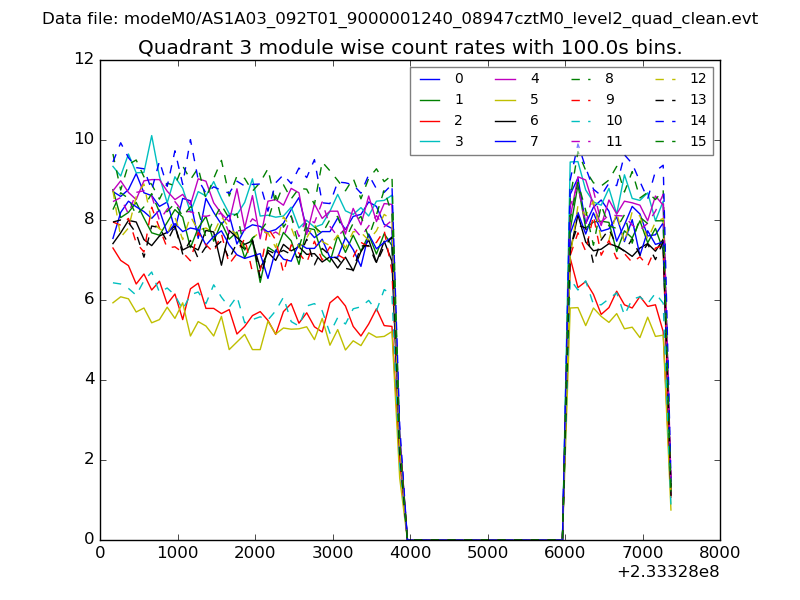 |
 |
| Parameter | Plot |
|---|---|
| CZT HV Monitor |  |
| D_VDD | 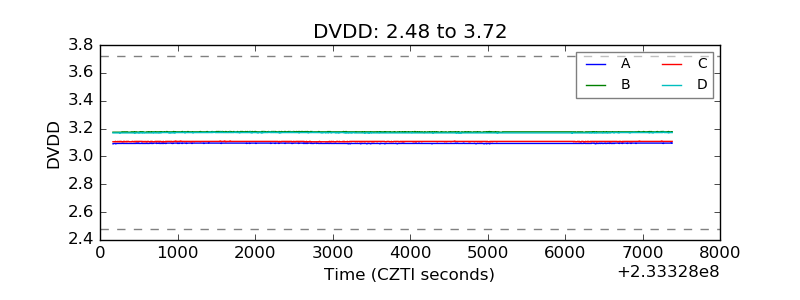 |
| Temperature 1 | 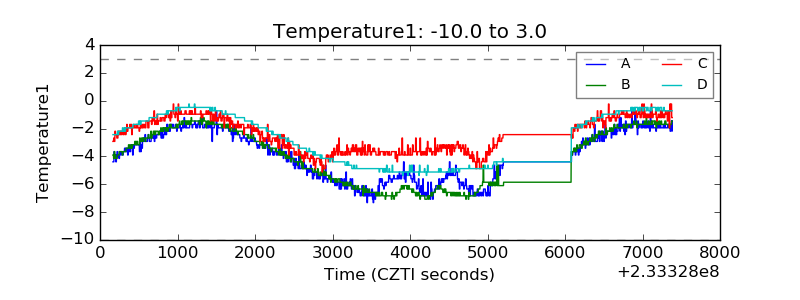 |
| Veto HV Monitor |  |
| Veto LLD | 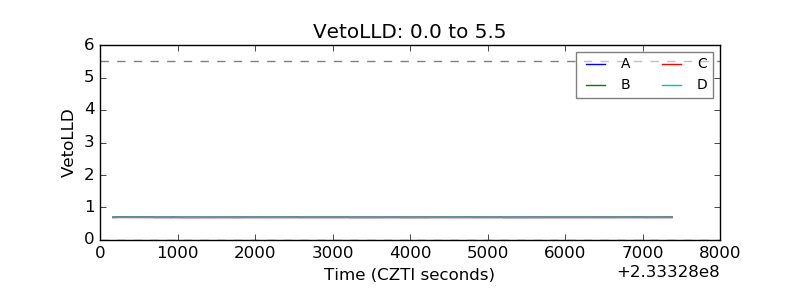 |
| Alpha Counter | 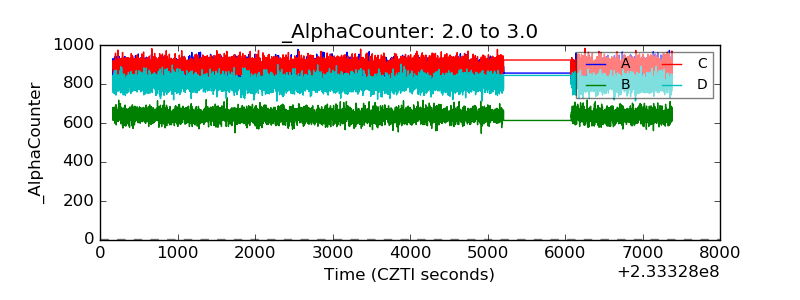 |
| _CPM_Rate | 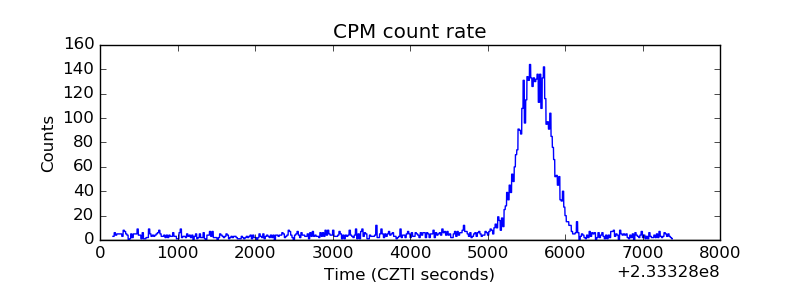 |
| CZT Counter | 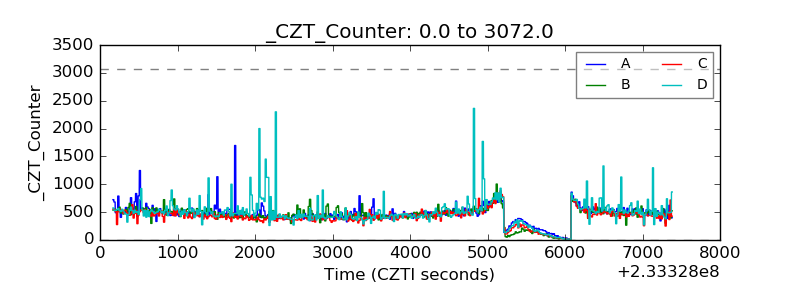 |
| +2.5 Volts monitor |  |
| +5 Volts monitor |  |
| _ROLL_ROT | 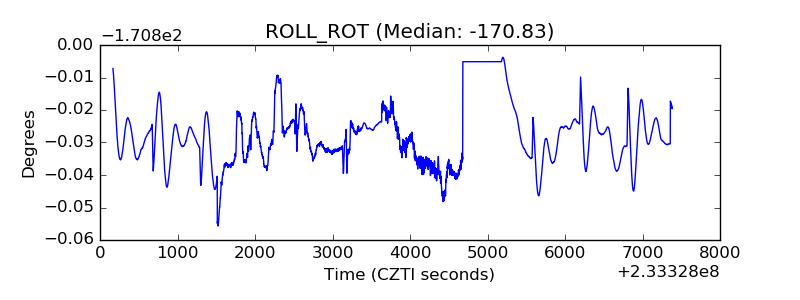 |
| _Roll_DEC | 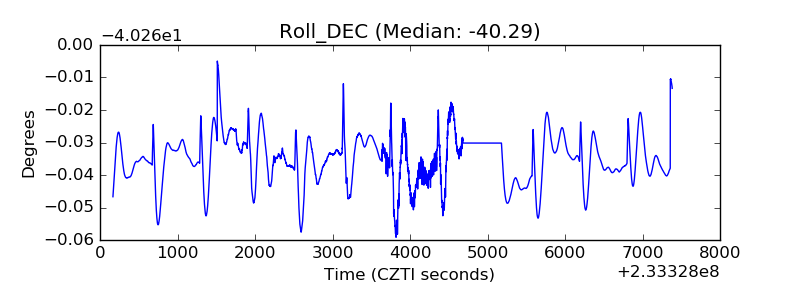 |
| _Roll_RA | 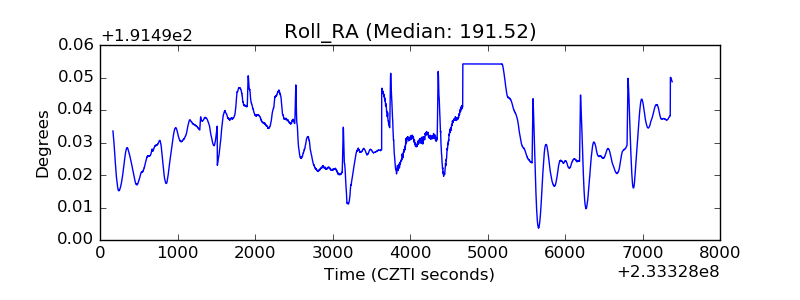 |
| Veto Counter | 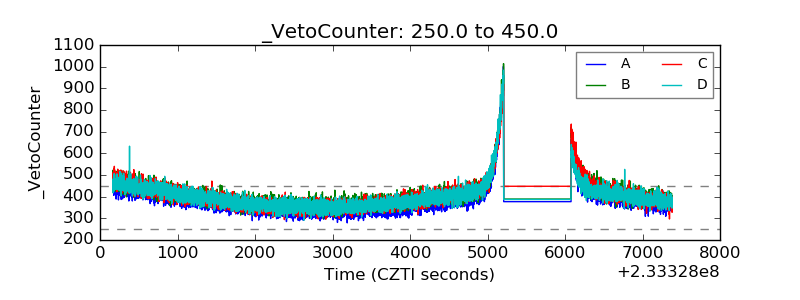 |