| Param | Original file | Final file |
|---|---|---|
| Filename | modeM0/AS1A03_051T01_9000001242_08950cztM0_level2.evt | modeM0/AS1A03_051T01_9000001242_08950cztM0_level2_quad_clean.evt |
| Size (bytes) | 384,249,600 | 69,468,480 |
| Size | 366.4 MB | 66.3 MB |
| Events in quadrant A | 3,064,097 | 430,802 |
| Events in quadrant B | 2,711,361 | 434,850 |
| Events in quadrant C | 2,542,072 | 422,121 |
| Events in quadrant D | 2,928,510 | 414,022 |
| Mode M9 | |||
|---|---|---|---|
| Quadrant | BADHDUFLAG | Total packets | Discarded packets |
| A | 0 | 3 | 0 |
| B | 0 | 3 | 0 |
| C | 0 | 3 | 0 |
| D | 0 | 3 | 0 |
| Mode M0 | |||
|---|---|---|---|
| Quadrant | BADHDUFLAG | Total packets | Discarded packets |
| A | 0 | 13071 | 9 |
| B | 0 | 11942 | 3 |
| C | 0 | 11751 | 5 |
| D | 0 | 12525 | 7 |
| Mode SS | |||
|---|---|---|---|
| Quadrant | BADHDUFLAG | Total packets | Discarded packets |
| A | 0 | 118 | 0 |
| B | 0 | 118 | 0 |
| C | 0 | 118 | 0 |
| D | 0 | 118 | 0 |
| Quadrant | Total seconds | Saturated seconds | Saturation percentage |
|---|---|---|---|
| A | 5740 | 71 | 1.236934% |
| B | 5742 | 53 | 0.923023% |
| C | 5741 | 13 | 0.226441% |
| D | 5740 | 44 | 0.766551% |
Noise dominated data is calculated using 1-second bins in cleaned event files. If a bin has >2000 counts, and if more than 50% of those come from <1% of pixels, then it is considered to be noise-dominated and hence unusable.
| Quadrant | # 1 sec bins | Bins with >0 counts | Bins with >2000 counts | High rate bins dominated by noise | Noise dominated (total time) | Noise dominated (detector-on time) | Marked lightcurve |
|---|---|---|---|---|---|---|---|
| A | 6048 | 5744 | 1 | 1 | 0.02% | 0.02% | 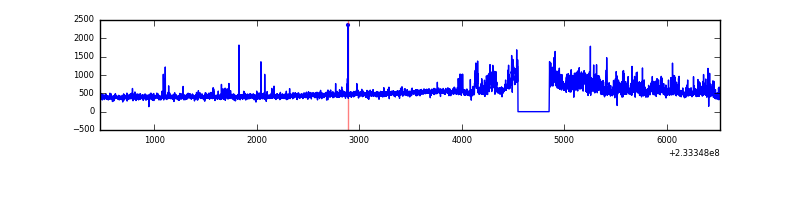 |
| B | 6048 | 5744 | 1 | 1 | 0.02% | 0.02% | 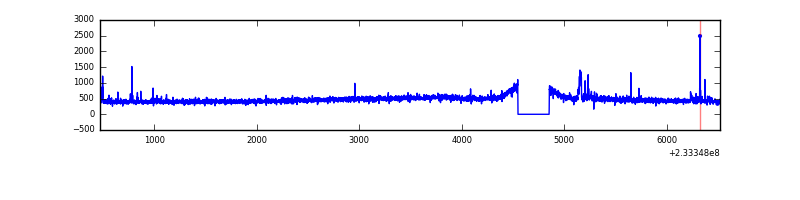 |
| C | 6048 | 5744 | 0 | 0 | 0.00% | 0.00% | 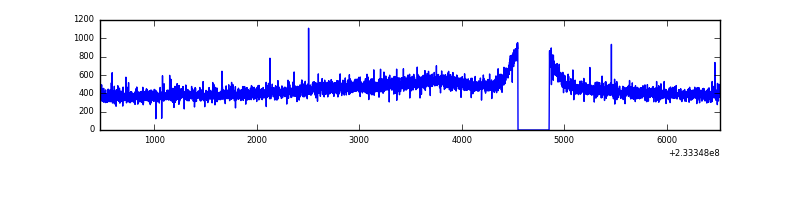 |
| D | 6048 | 5744 | 35 | 35 | 0.58% | 0.61% | 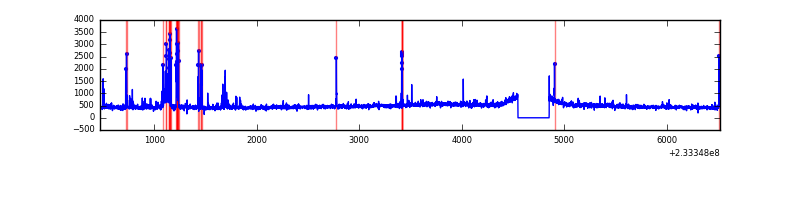 |
Top three noisy pixels from each quadrant. If the there are fewer than three noisy pixels in the level2.evt file, extra rows are filled as -1
| Pixel properties | Quadrant properties | ||||||
|---|---|---|---|---|---|---|---|
| Quadrant | DetID | PixID | Counts | Sigma | Mean | Median | Sigma |
| A | 8 | 5 | 452229 | 3275.79 | 672 | 658 | 137.9 |
| A | 13 | 251 | 14491 | 100.35 | 672 | 658 | 137.9 |
| A | 5 | 16 | 12958 | 89.23 | 672 | 658 | 137.9 |
| B | 0 | 168 | 38125 | 283.07 | 679 | 661 | 132.3 |
| B | 12 | 111 | 13998 | 100.77 | 679 | 661 | 132.3 |
| B | 0 | 197 | 13251 | 95.12 | 679 | 661 | 132.3 |
| C | 13 | 61 | 4913 | 27.9 | 651 | 653 | 152.7 |
| C | 3 | 202 | 1649 | 6.52 | 651 | 653 | 152.7 |
| C | -1 | -1 | -1 | -1.0 | 651 | 653 | 152.7 |
| D | 8 | 195 | 171541 | 984.46 | 647 | 631 | 173.6 |
| D | 1 | 52 | 131226 | 752.24 | 647 | 631 | 173.6 |
| D | 13 | 104 | 43655 | 247.82 | 647 | 631 | 173.6 |
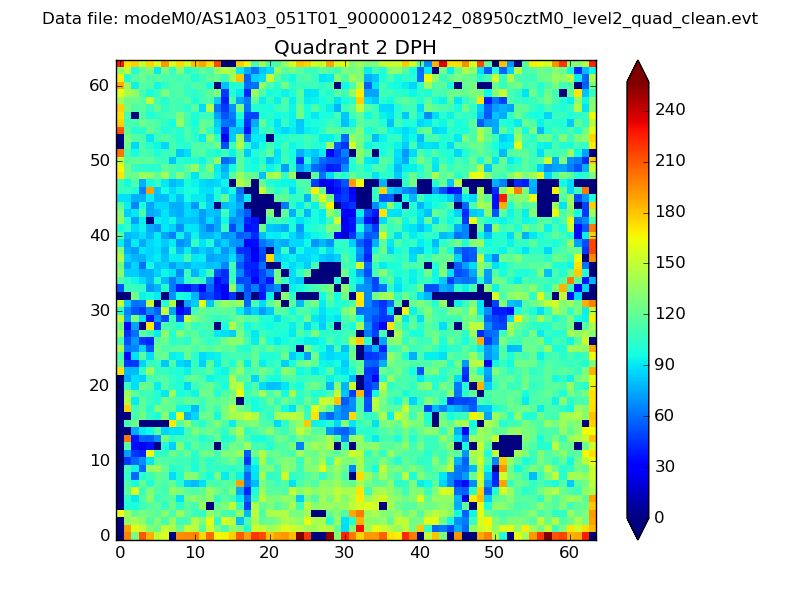
Histogram calculated using DETX and DETY for each event in the final _common_clean file
| Quadrant A | 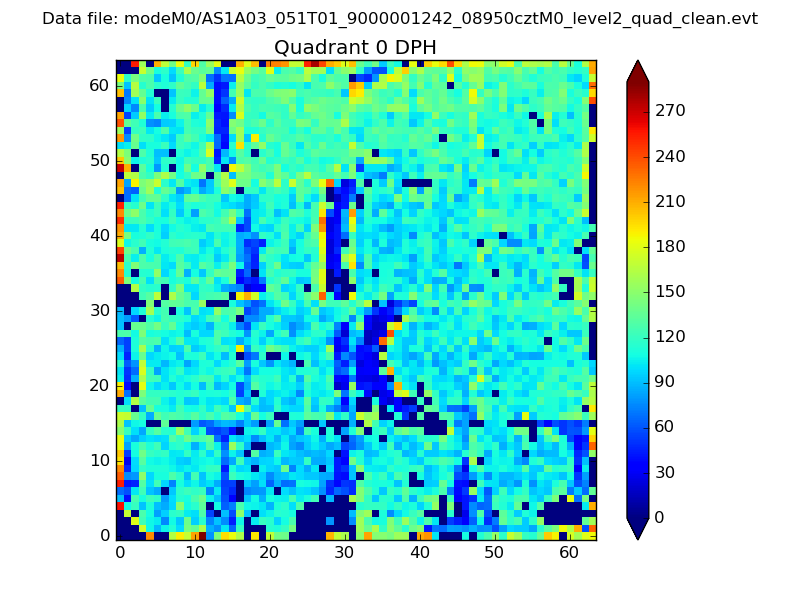 |
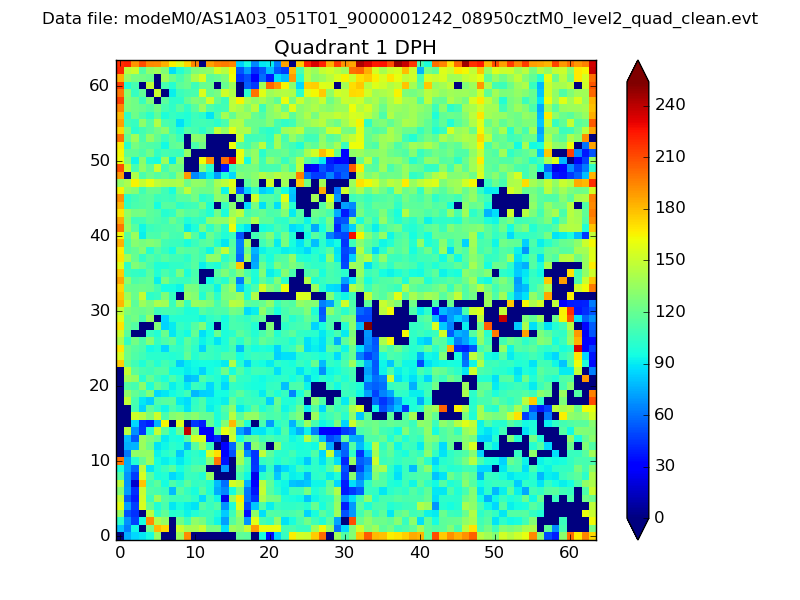 |
Quadrant B |
|---|---|---|---|
| Quadrant D | 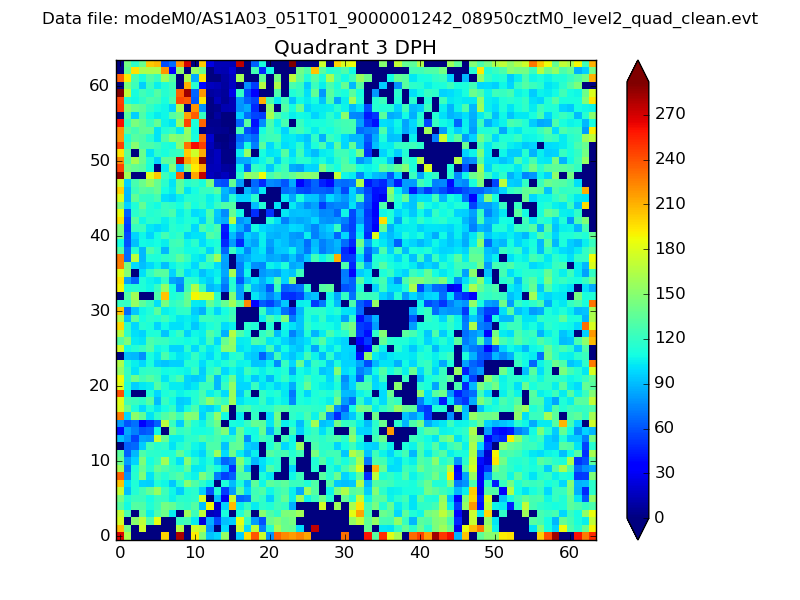 |
 |
Quadrant C |
| Plot type | Count rate plots | Images |
|---|---|---|
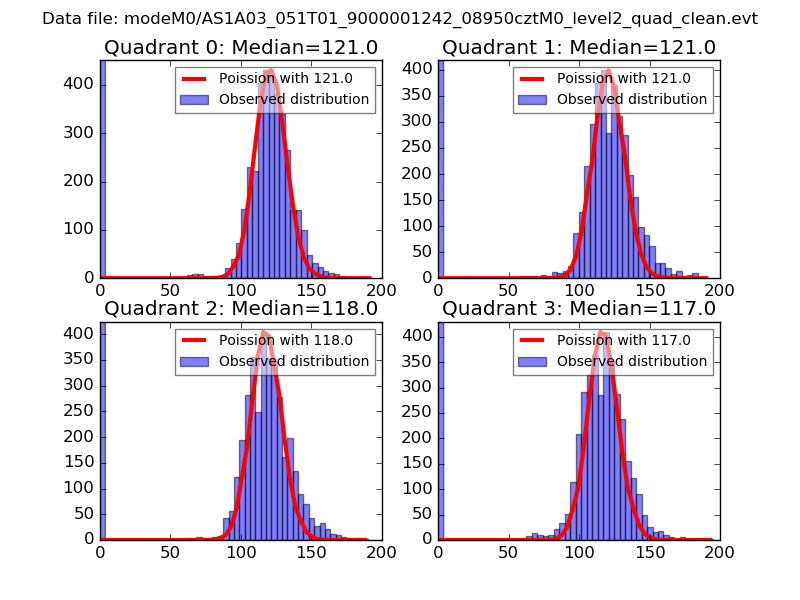
| Comparison with Poisson distribution Blue bars denote a histogram of data divided into 1 sec bins. Red curve is a Poisson curve with rate = median count rate of data. |
 |
 |
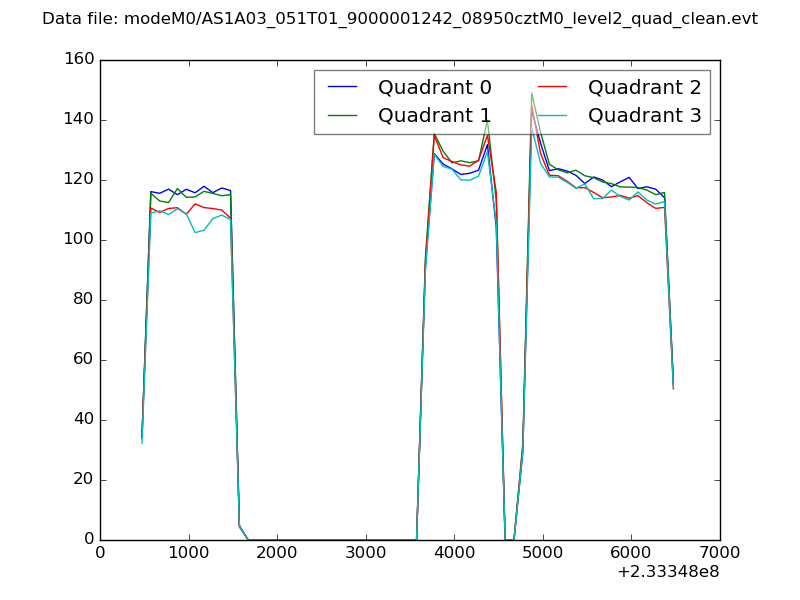
| Quadrant-wise count rates Data is divided into 100 sec bins |
 |
|
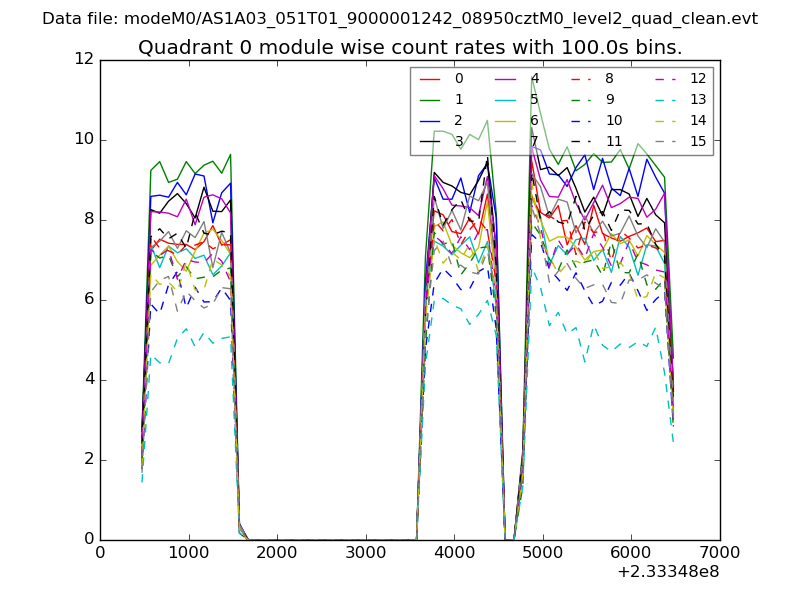
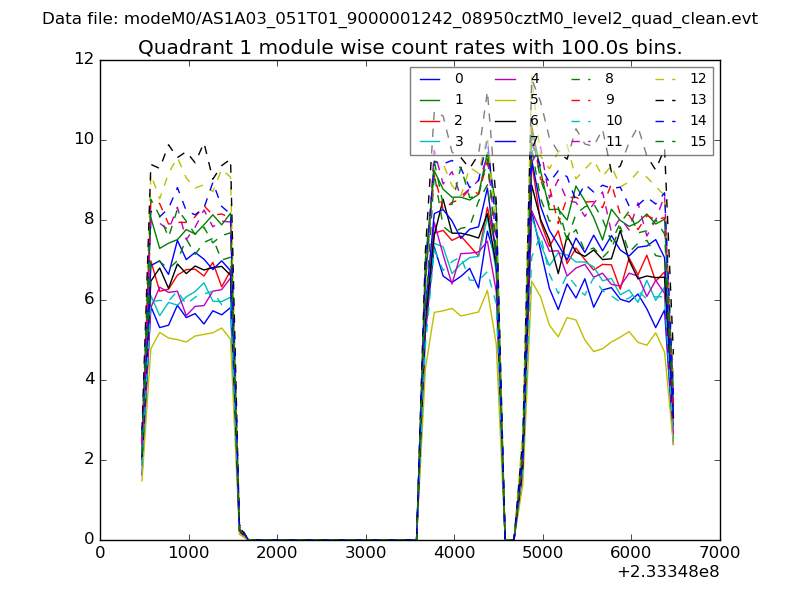
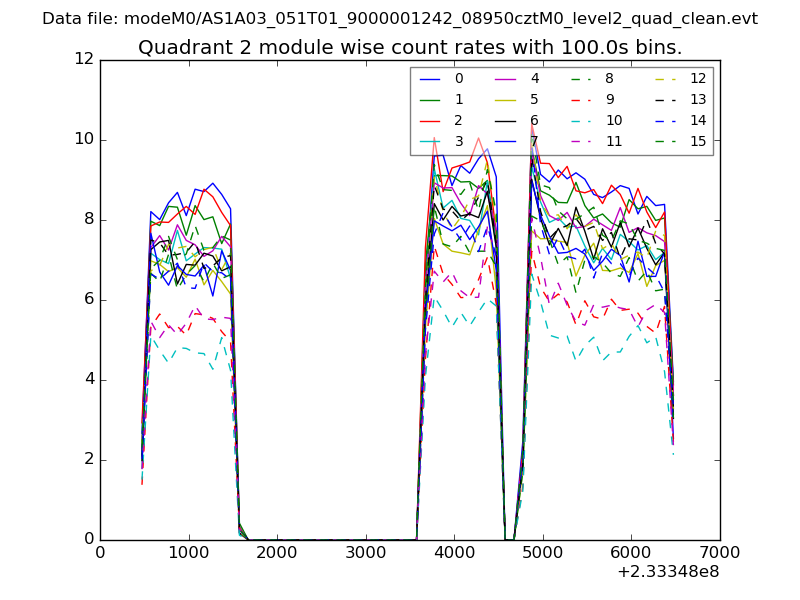
| Module-wise count rates for Quadrant A Data is divided into 100 sec bins |
 |
 |
| Module-wise count rates for Quadrant B Data is divided into 100 sec bins |
 |
 |
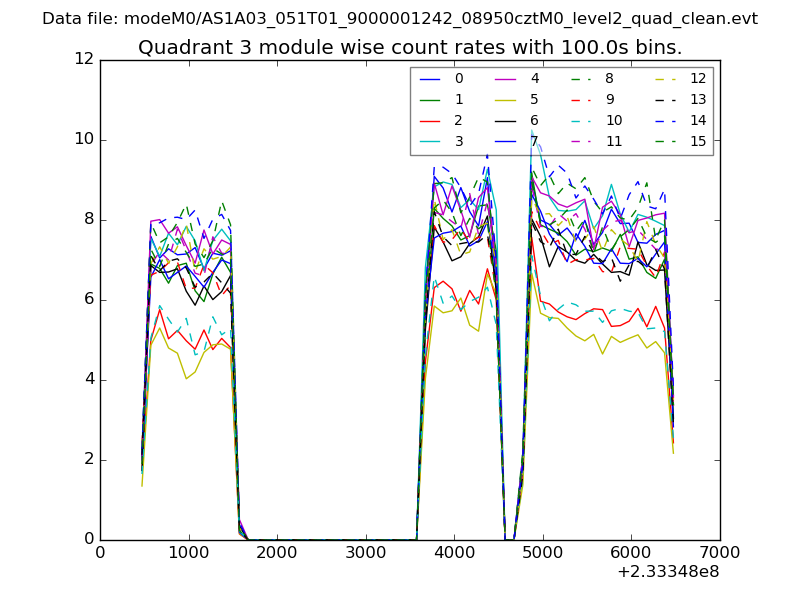
| Module-wise count rates for Quadrant C Data is divided into 100 sec bins |
 |
 |
| Module-wise count rates for Quadrant D Data is divided into 100 sec bins |
 |
 |
| Parameter | Plot |
|---|---|
| CZT HV Monitor | 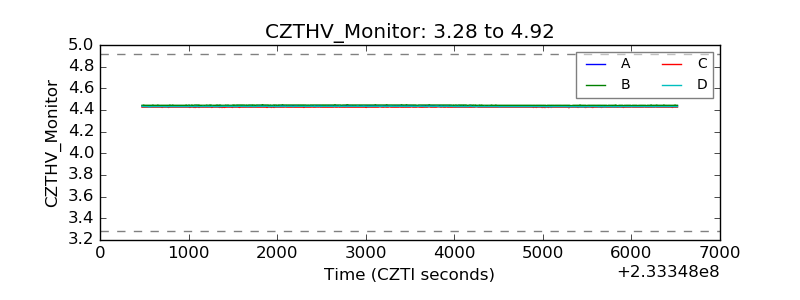 |
| D_VDD | 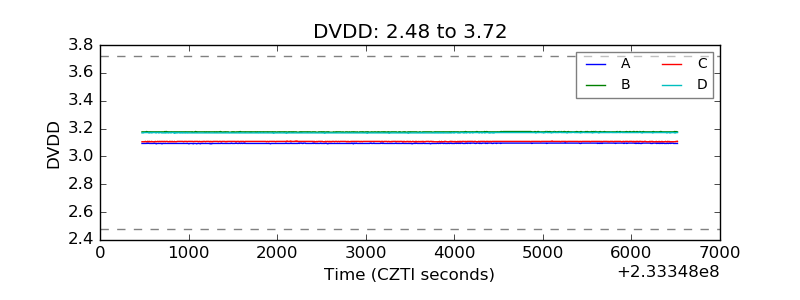 |
| Temperature 1 | 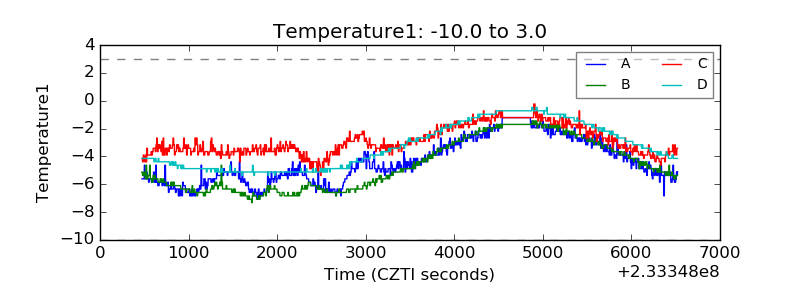 |
| Veto HV Monitor | 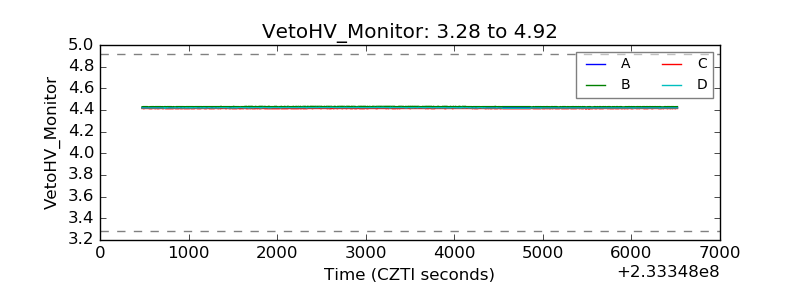 |
| Veto LLD | 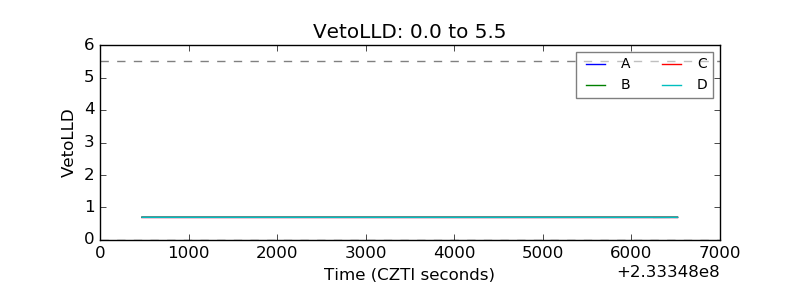 |
| Alpha Counter | 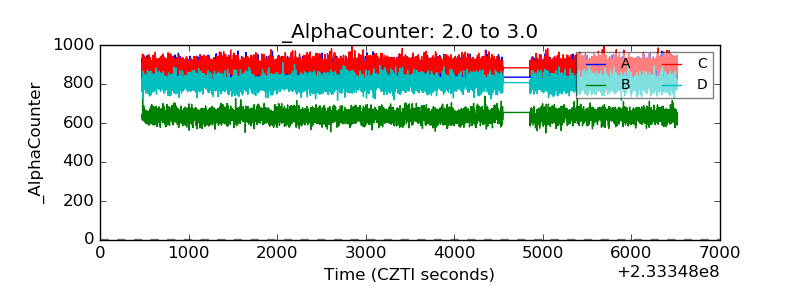 |
| _CPM_Rate | 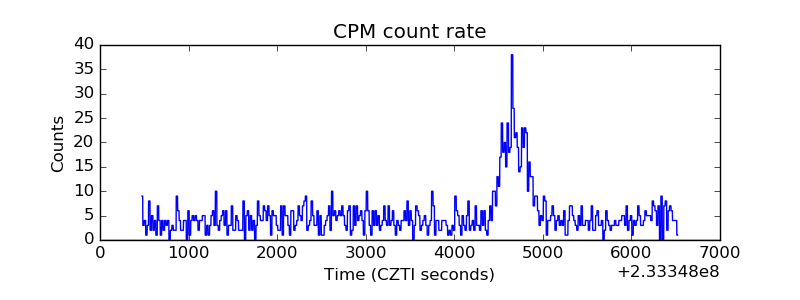 |
| CZT Counter | 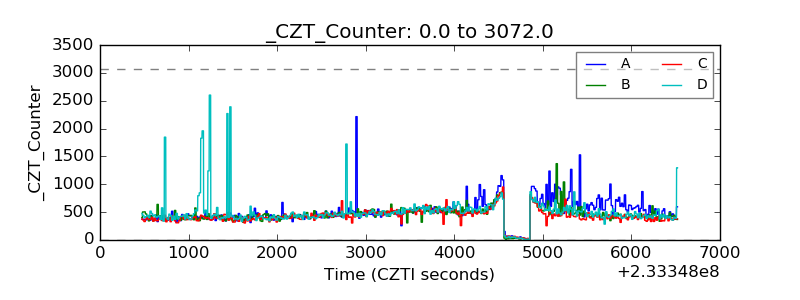 |
| +2.5 Volts monitor | 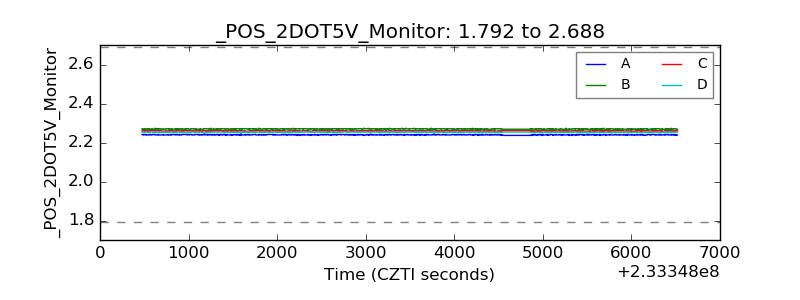 |
| +5 Volts monitor |  |
| _ROLL_ROT | 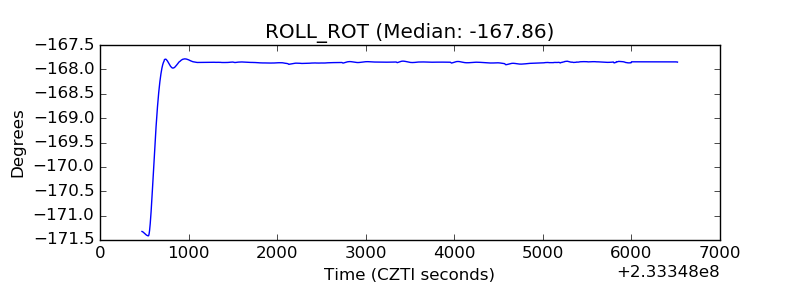 |
| _Roll_DEC | 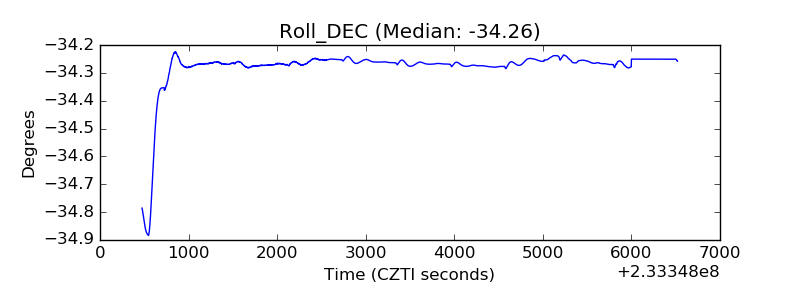 |
| _Roll_RA | 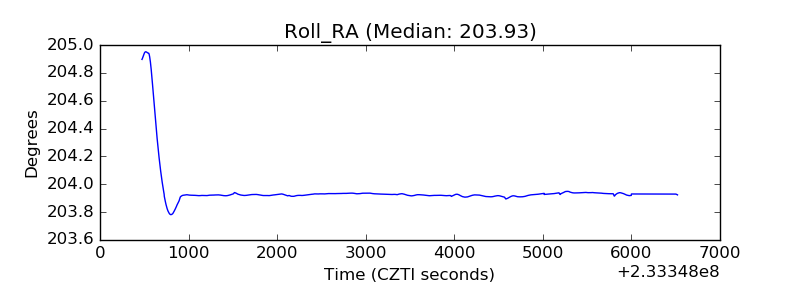 |
| Veto Counter | 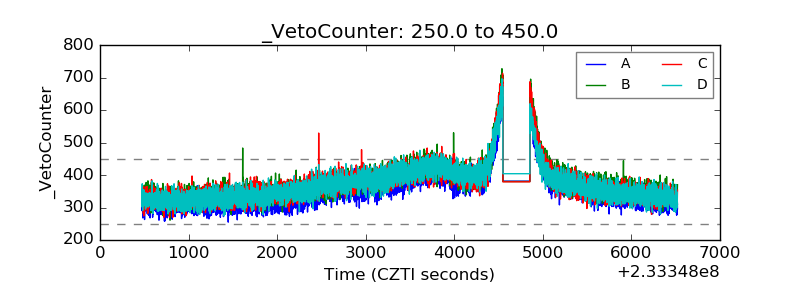 |