| Param | Original file | Final file |
|---|---|---|
| Filename | modeM0/AS1A03_051T01_9000001242_08953cztM0_level2.evt | modeM0/AS1A03_051T01_9000001242_08953cztM0_level2_quad_clean.evt |
| Size (bytes) | 776,560,320 | 134,861,760 |
| Size | 740.6 MB | 128.6 MB |
| Events in quadrant A | 6,100,935 | 840,006 |
| Events in quadrant B | 5,177,225 | 847,122 |
| Events in quadrant C | 4,860,655 | 827,417 |
| Events in quadrant D | 6,627,074 | 801,313 |
| Mode M9 | |||
|---|---|---|---|
| Quadrant | BADHDUFLAG | Total packets | Discarded packets |
| A | 0 | 8 | 0 |
| B | 0 | 8 | 0 |
| C | 0 | 8 | 0 |
| D | 0 | 8 | 0 |
| Mode M0 | |||
|---|---|---|---|
| Quadrant | BADHDUFLAG | Total packets | Discarded packets |
| A | 0 | 25737 | 298 |
| B | 0 | 23188 | 267 |
| C | 0 | 22813 | 216 |
| D | 0 | 27412 | 382 |
| Mode SS | |||
|---|---|---|---|
| Quadrant | BADHDUFLAG | Total packets | Discarded packets |
| A | 0 | 228 | 2 |
| B | 0 | 228 | 2 |
| C | 0 | 228 | 6 |
| D | 0 | 228 | 2 |
| Quadrant | Total seconds | Saturated seconds | Saturation percentage |
|---|---|---|---|
| A | 11103 | 98 | 0.882644% |
| B | 11097 | 74 | 0.666847% |
| C | 11123 | 15 | 0.134856% |
| D | 11096 | 375 | 3.379596% |
Noise dominated data is calculated using 1-second bins in cleaned event files. If a bin has >2000 counts, and if more than 50% of those come from <1% of pixels, then it is considered to be noise-dominated and hence unusable.
| Quadrant | # 1 sec bins | Bins with >0 counts | Bins with >2000 counts | High rate bins dominated by noise | Noise dominated (total time) | Noise dominated (detector-on time) | Marked lightcurve |
|---|---|---|---|---|---|---|---|
| A | 12017 | 11218 | 4 | 4 | 0.03% | 0.04% | 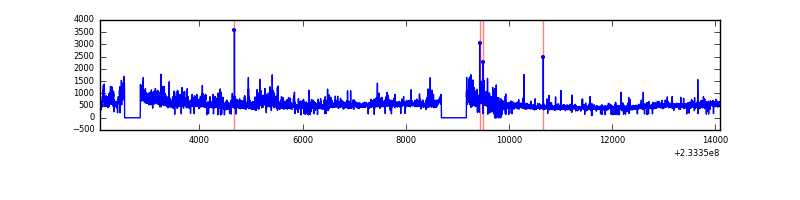 |
| B | 12017 | 11224 | 1 | 1 | 0.01% | 0.01% | 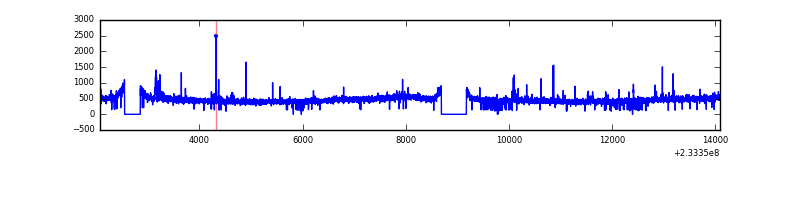 |
| C | 12017 | 11225 | 0 | 0 | 0.00% | 0.00% | 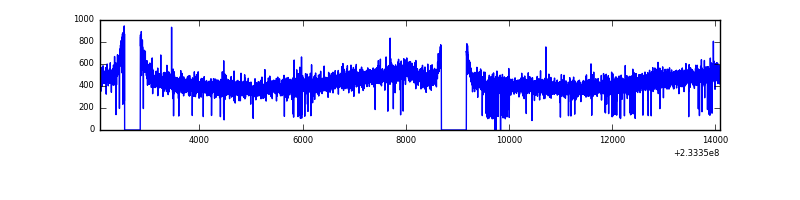 |
| D | 12017 | 11215 | 326 | 326 | 2.71% | 2.91% | 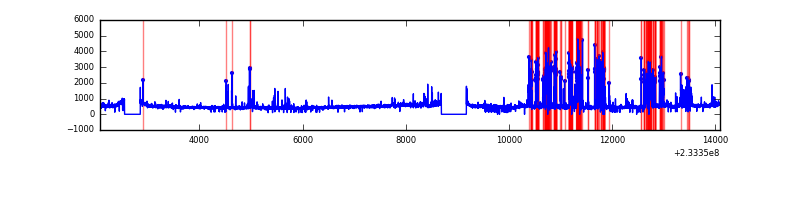 |
Top three noisy pixels from each quadrant. If the there are fewer than three noisy pixels in the level2.evt file, extra rows are filled as -1
| Pixel properties | Quadrant properties | ||||||
|---|---|---|---|---|---|---|---|
| Quadrant | DetID | PixID | Counts | Sigma | Mean | Median | Sigma |
| A | 8 | 5 | 1108410 | 4174.46 | 1288 | 1257 | 265.2 |
| A | 13 | 251 | 18677 | 65.68 | 1288 | 1257 | 265.2 |
| A | 0 | 226 | 12040 | 40.65 | 1288 | 1257 | 265.2 |
| B | 0 | 168 | 39464 | 153.3 | 1295 | 1262 | 249.2 |
| B | 6 | 51 | 37297 | 144.61 | 1295 | 1262 | 249.2 |
| B | 12 | 111 | 27129 | 103.8 | 1295 | 1262 | 249.2 |
| C | 13 | 61 | 9215 | 27.51 | 1246 | 1248 | 289.6 |
| C | 3 | 202 | 3136 | 6.52 | 1246 | 1248 | 289.6 |
| C | 1 | 3 | 2894 | 5.68 | 1246 | 1248 | 289.6 |
| D | 1 | 52 | 832388 | 2641.25 | 1225 | 1192 | 314.7 |
| D | 8 | 195 | 371945 | 1178.13 | 1225 | 1192 | 314.7 |
| D | 13 | 104 | 323608 | 1024.53 | 1225 | 1192 | 314.7 |
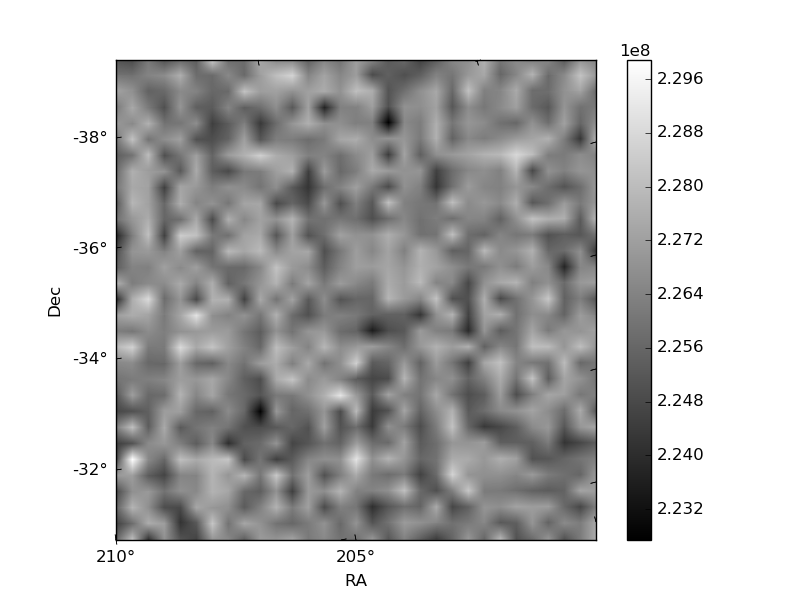
Histogram calculated using DETX and DETY for each event in the final _common_clean file
| Quadrant A |  |
 |
Quadrant B |
|---|---|---|---|
| Quadrant D |  |
 |
Quadrant C |
| Plot type | Count rate plots | Images |
|---|---|---|
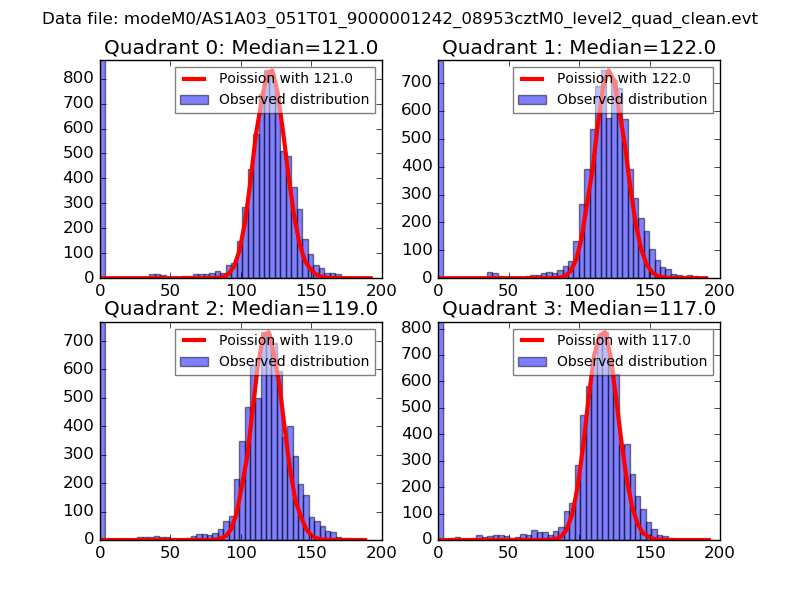
| Comparison with Poisson distribution Blue bars denote a histogram of data divided into 1 sec bins. Red curve is a Poisson curve with rate = median count rate of data. |
 |
 |
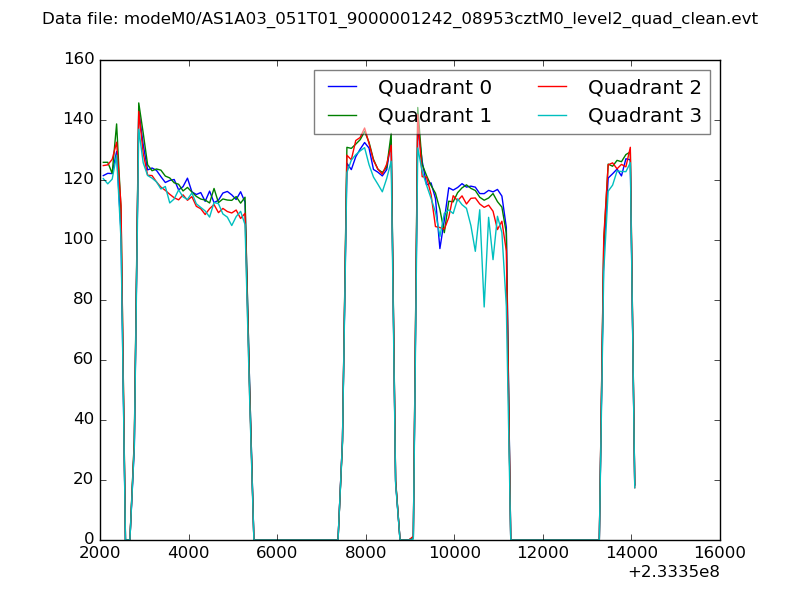
| Quadrant-wise count rates Data is divided into 100 sec bins |
 |
|
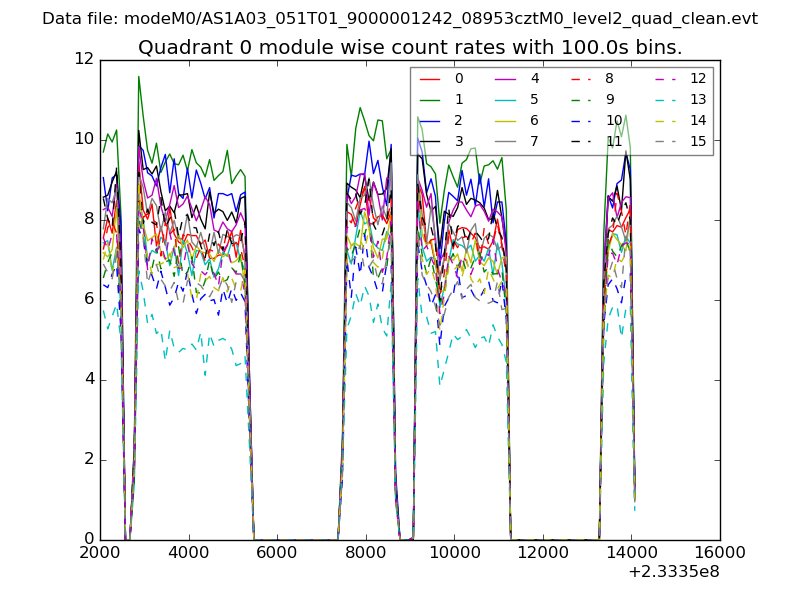
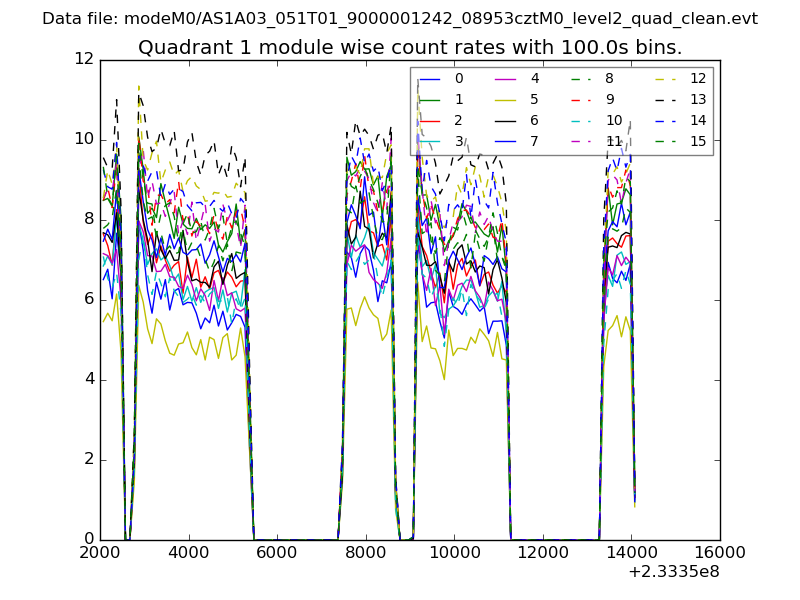
| Module-wise count rates for Quadrant A Data is divided into 100 sec bins |
 |
 |
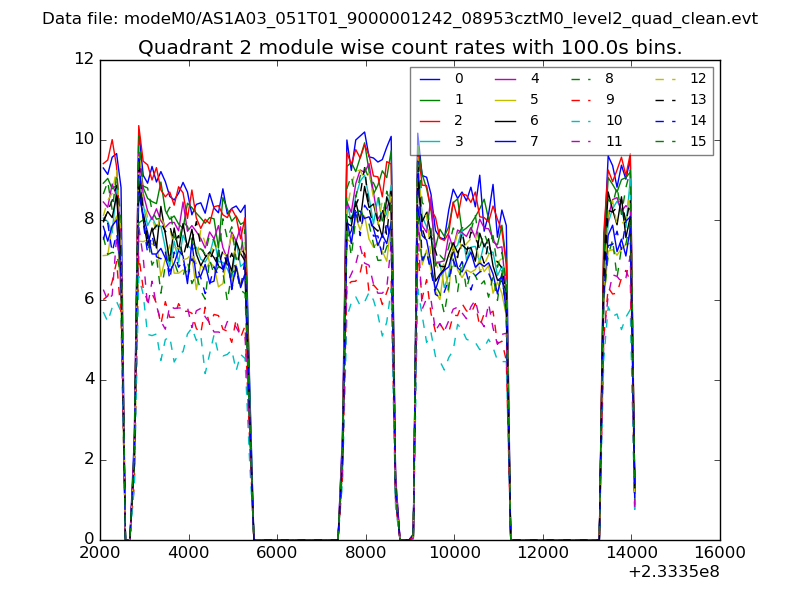
| Module-wise count rates for Quadrant B Data is divided into 100 sec bins |
 |
 |
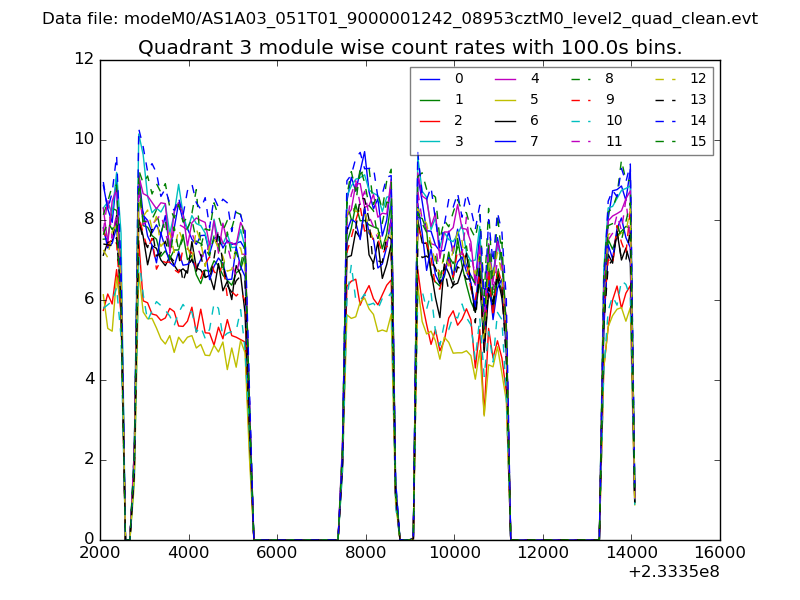
| Module-wise count rates for Quadrant C Data is divided into 100 sec bins |
 |
 |
| Module-wise count rates for Quadrant D Data is divided into 100 sec bins |
 |
 |
| Parameter | Plot |
|---|---|
| CZT HV Monitor | 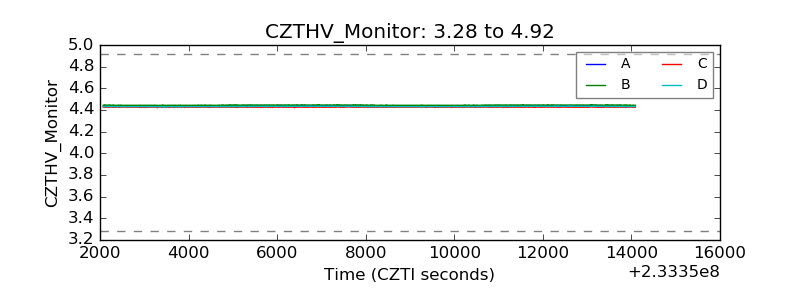 |
| D_VDD | 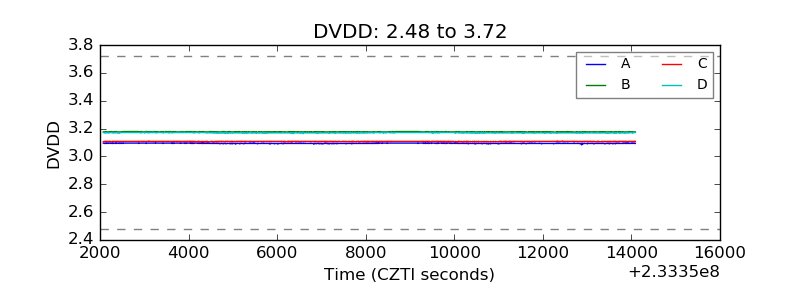 |
| Temperature 1 | 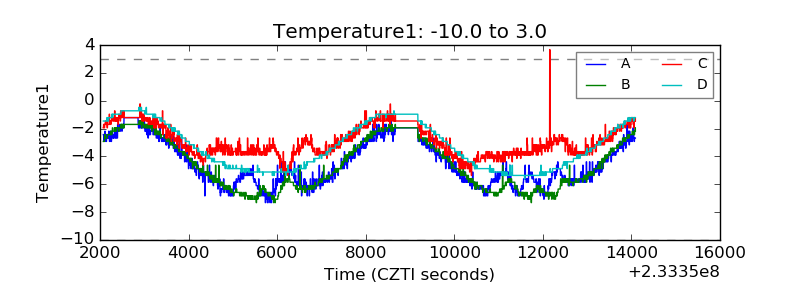 |
| Veto HV Monitor | 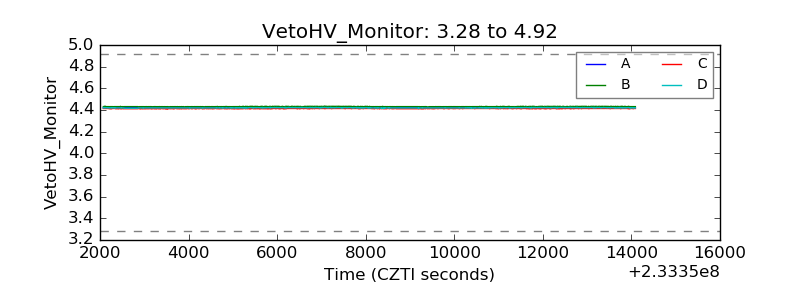 |
| Veto LLD | 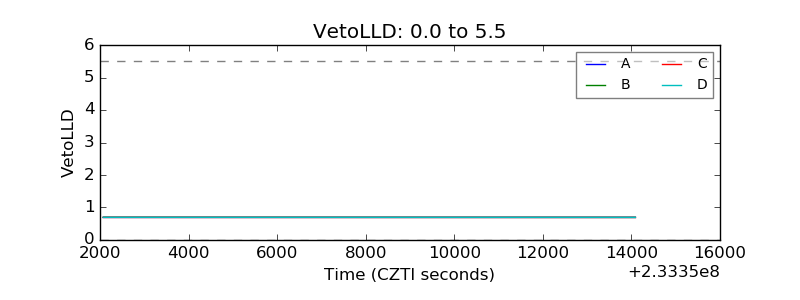 |
| Alpha Counter | 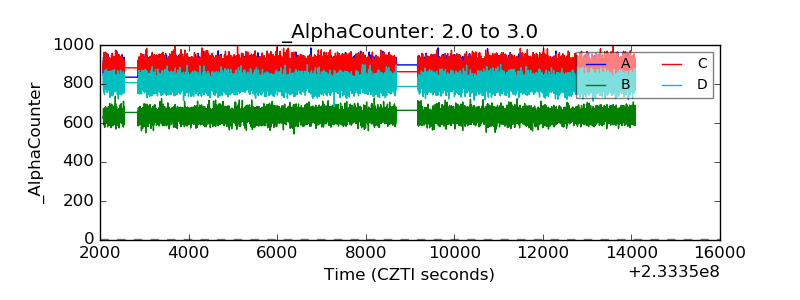 |
| _CPM_Rate | 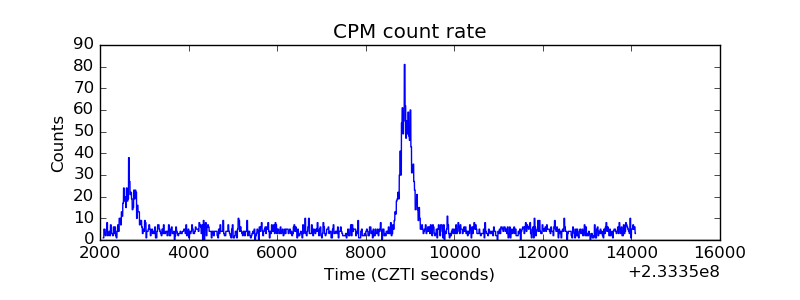 |
| CZT Counter |  |
| +2.5 Volts monitor |  |
| +5 Volts monitor |  |
| _ROLL_ROT | 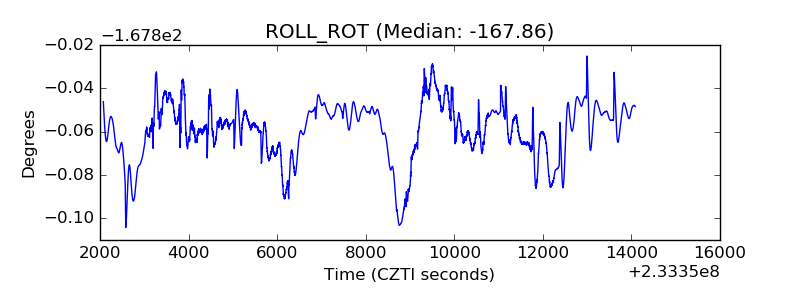 |
| _Roll_DEC | 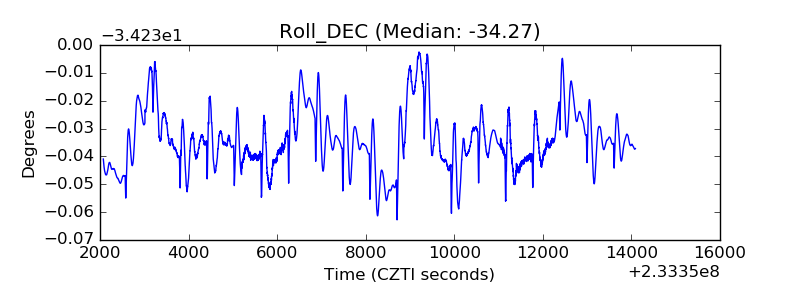 |
| _Roll_RA |  |
| Veto Counter | 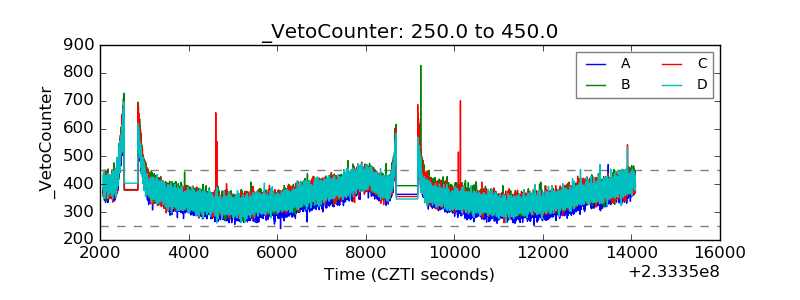 |