| Param | Original file | Final file |
|---|---|---|
| Filename | modeM0/AS1A03_051T01_9000001242_08954cztM0_level2.evt | modeM0/AS1A03_051T01_9000001242_08954cztM0_level2_quad_clean.evt |
| Size (bytes) | 944,305,920 | 172,883,520 |
| Size | 900.6 MB | 164.9 MB |
| Events in quadrant A | 7,006,466 | 1,086,255 |
| Events in quadrant B | 6,346,792 | 1,100,595 |
| Events in quadrant C | 6,019,221 | 1,073,452 |
| Events in quadrant D | 8,302,470 | 1,033,305 |
| Mode M9 | |||
|---|---|---|---|
| Quadrant | BADHDUFLAG | Total packets | Discarded packets |
| A | 0 | 23 | 0 |
| B | 0 | 23 | 0 |
| C | 0 | 23 | 0 |
| D | 0 | 23 | 0 |
| Mode M0 | |||
|---|---|---|---|
| Quadrant | BADHDUFLAG | Total packets | Discarded packets |
| A | 0 | 29510 | 19 |
| B | 0 | 27851 | 13 |
| C | 0 | 27532 | 18 |
| D | 0 | 33670 | 21 |
| Mode SS | |||
|---|---|---|---|
| Quadrant | BADHDUFLAG | Total packets | Discarded packets |
| A | 0 | 282 | 0 |
| B | 0 | 282 | 0 |
| C | 0 | 282 | 2 |
| D | 0 | 282 | 0 |
| Quadrant | Total seconds | Saturated seconds | Saturation percentage |
|---|---|---|---|
| A | 13637 | 121 | 0.887292% |
| B | 13639 | 50 | 0.366596% |
| C | 13637 | 27 | 0.197991% |
| D | 13637 | 353 | 2.588546% |
Noise dominated data is calculated using 1-second bins in cleaned event files. If a bin has >2000 counts, and if more than 50% of those come from <1% of pixels, then it is considered to be noise-dominated and hence unusable.
| Quadrant | # 1 sec bins | Bins with >0 counts | Bins with >2000 counts | High rate bins dominated by noise | Noise dominated (total time) | Noise dominated (detector-on time) | Marked lightcurve |
|---|---|---|---|---|---|---|---|
| A | 16050 | 13646 | 40 | 40 | 0.25% | 0.29% |  |
| B | 16050 | 13647 | 2 | 2 | 0.01% | 0.01% | 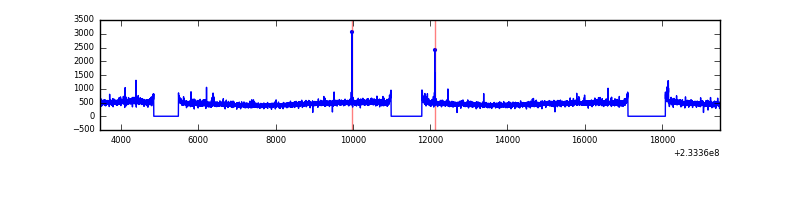 |
| C | 16050 | 13647 | 0 | 0 | 0.00% | 0.00% | 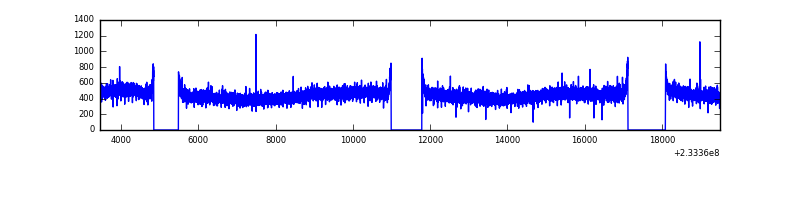 |
| D | 16050 | 13647 | 285 | 285 | 1.78% | 2.09% |  |
Top three noisy pixels from each quadrant. If the there are fewer than three noisy pixels in the level2.evt file, extra rows are filled as -1
| Pixel properties | Quadrant properties | ||||||
|---|---|---|---|---|---|---|---|
| Quadrant | DetID | PixID | Counts | Sigma | Mean | Median | Sigma |
| A | 8 | 5 | 646065 | 1981.48 | 1597 | 1566 | 325.3 |
| A | 5 | 16 | 179368 | 546.64 | 1597 | 1566 | 325.3 |
| A | 13 | 164 | 28233 | 81.99 | 1597 | 1566 | 325.3 |
| B | 0 | 214 | 46507 | 146.63 | 1605 | 1566 | 306.5 |
| B | 12 | 111 | 33513 | 104.24 | 1605 | 1566 | 306.5 |
| B | 11 | 111 | 26629 | 81.77 | 1605 | 1566 | 306.5 |
| C | 13 | 61 | 11601 | 28.17 | 1542 | 1547 | 356.8 |
| C | 5 | 238 | 4293 | 7.69 | 1542 | 1547 | 356.8 |
| C | 3 | 202 | 3948 | 6.73 | 1542 | 1547 | 356.8 |
| D | 13 | 105 | 685286 | 1748.56 | 1532 | 1489 | 391.1 |
| D | 1 | 52 | 677370 | 1728.32 | 1532 | 1489 | 391.1 |
| D | 8 | 195 | 426976 | 1088.03 | 1532 | 1489 | 391.1 |
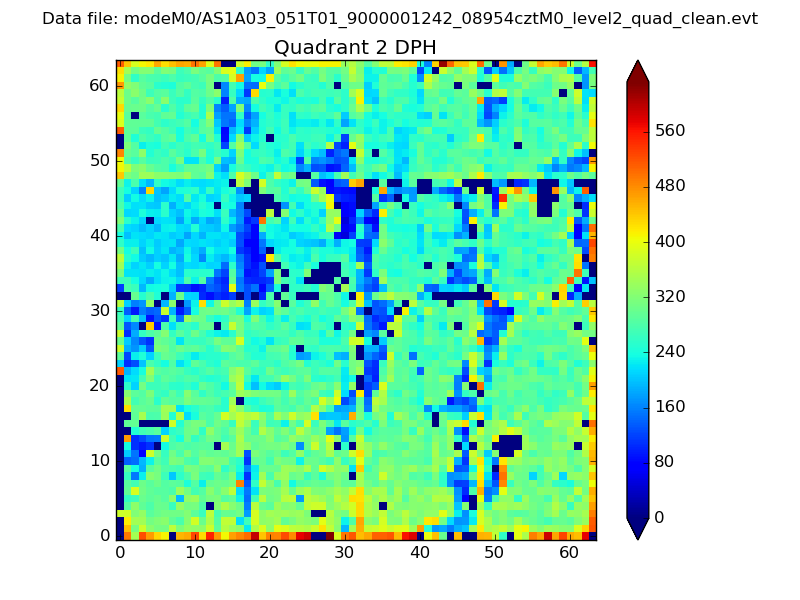
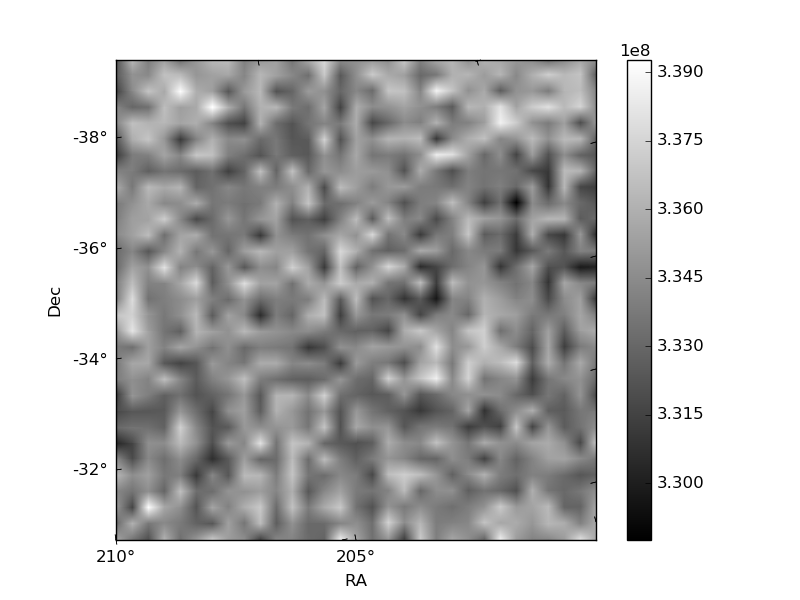
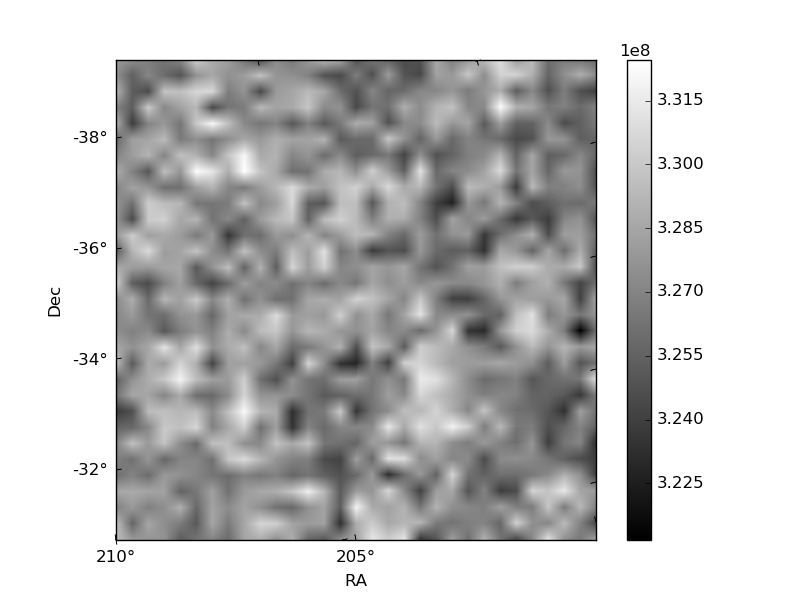
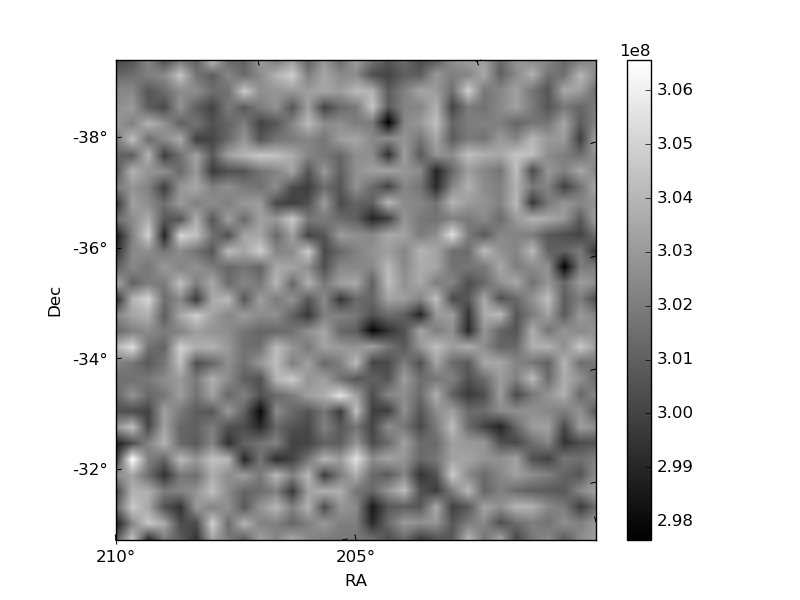
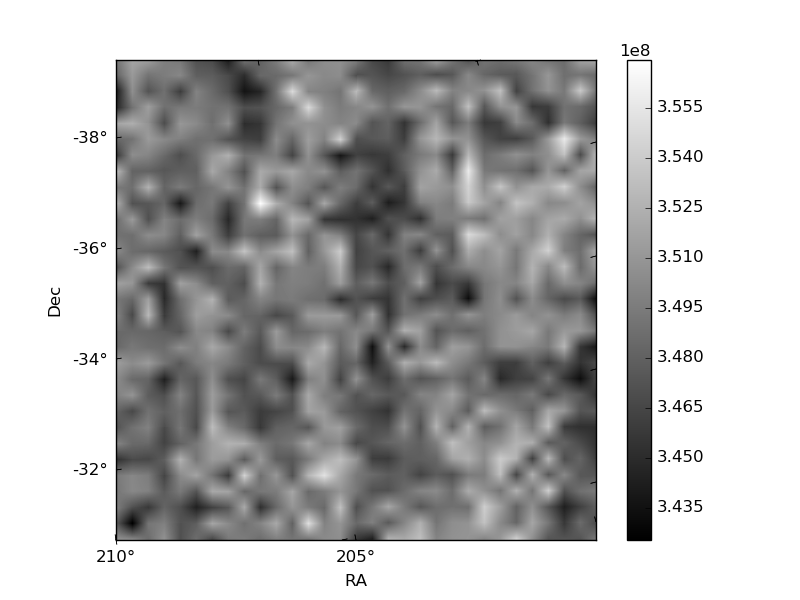
Histogram calculated using DETX and DETY for each event in the final _common_clean file
| Quadrant A | 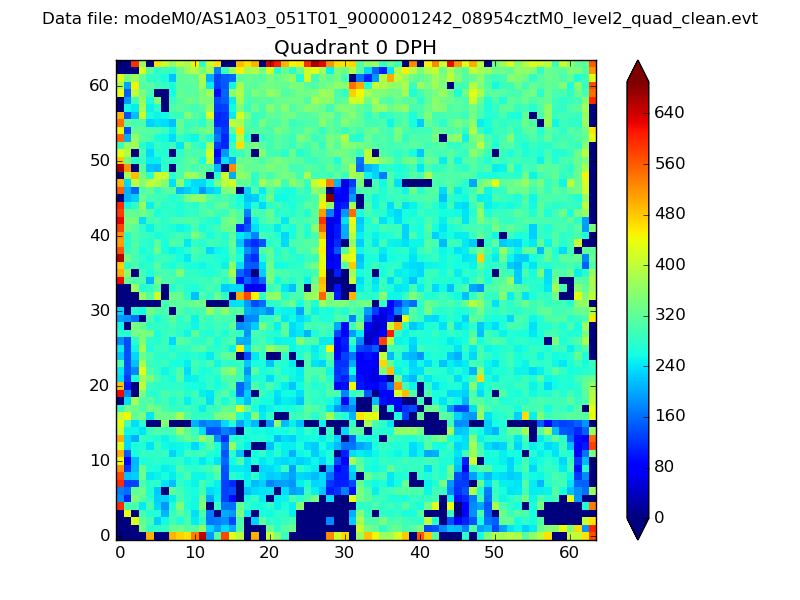 |
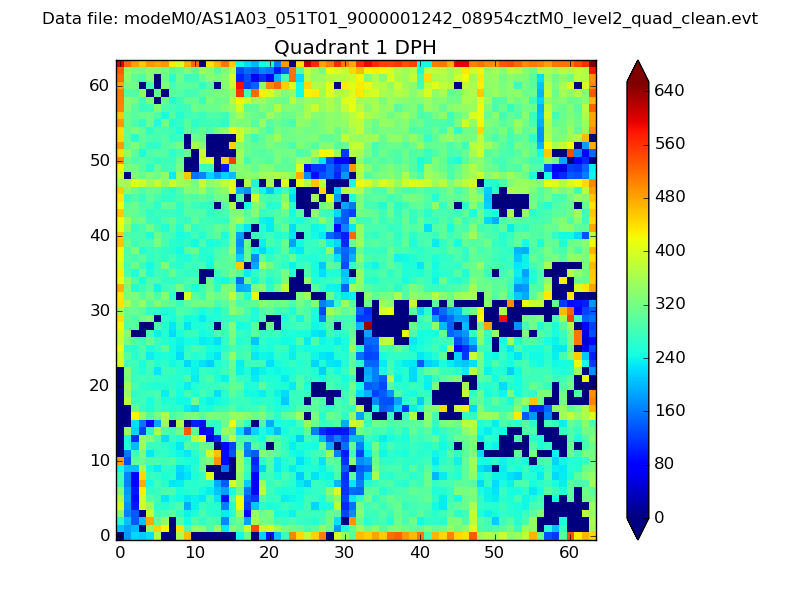 |
Quadrant B |
|---|---|---|---|
| Quadrant D | 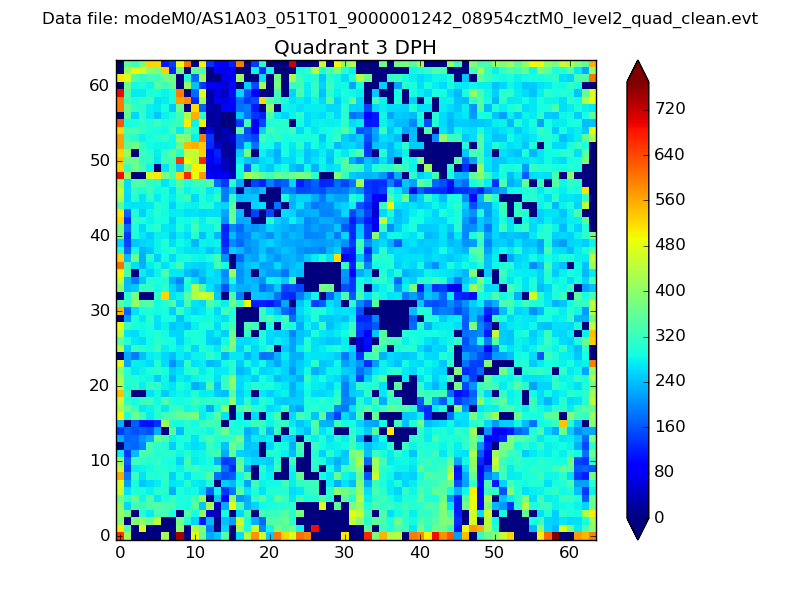 |
 |
Quadrant C |
| Plot type | Count rate plots | Images |
|---|---|---|
| Comparison with Poisson distribution Blue bars denote a histogram of data divided into 1 sec bins. Red curve is a Poisson curve with rate = median count rate of data. |
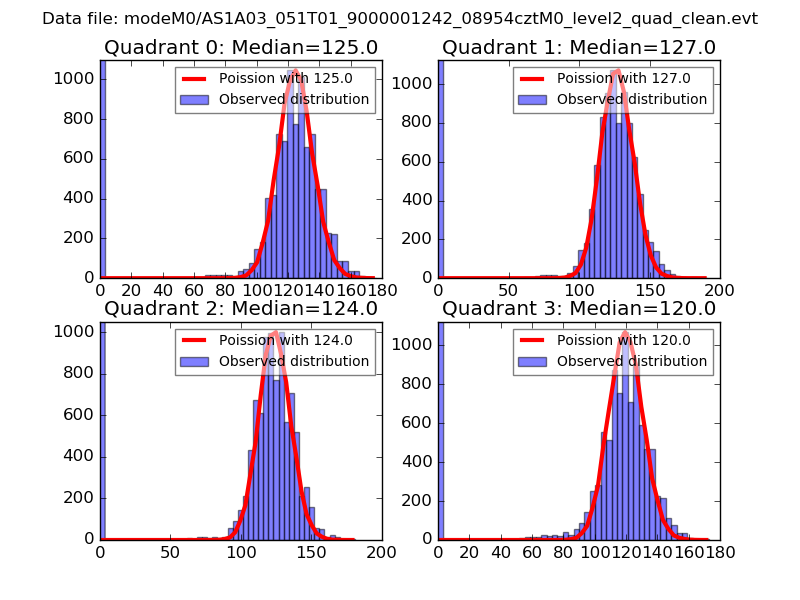 |
 |
| Quadrant-wise count rates Data is divided into 100 sec bins |
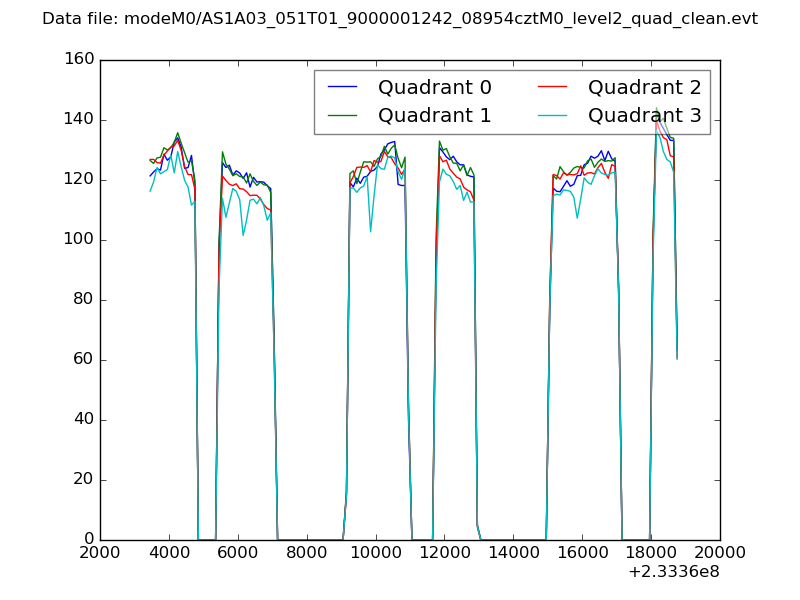 |
|
| Module-wise count rates for Quadrant A Data is divided into 100 sec bins |
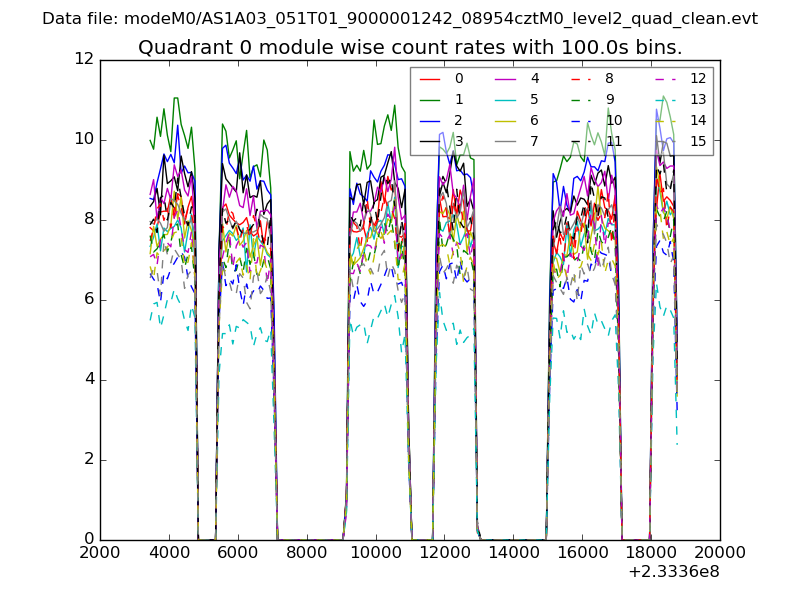 |
 |
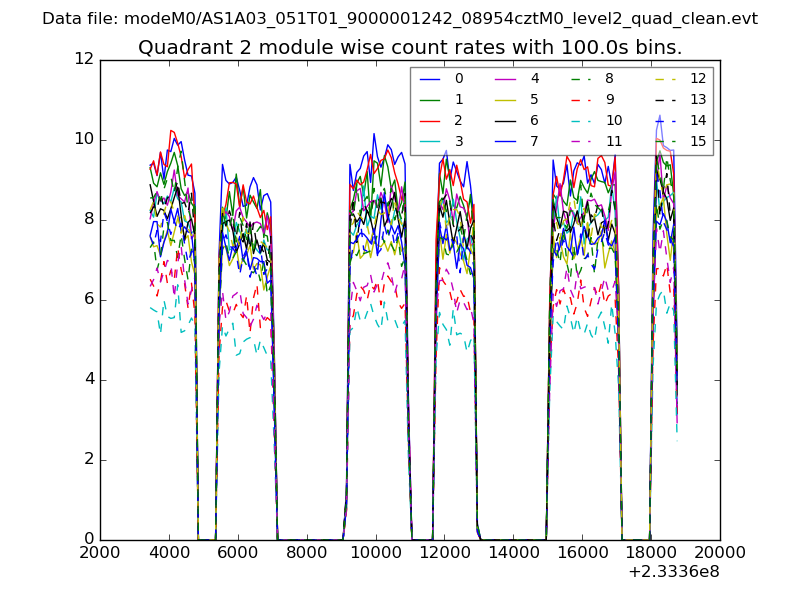
| Module-wise count rates for Quadrant B Data is divided into 100 sec bins |
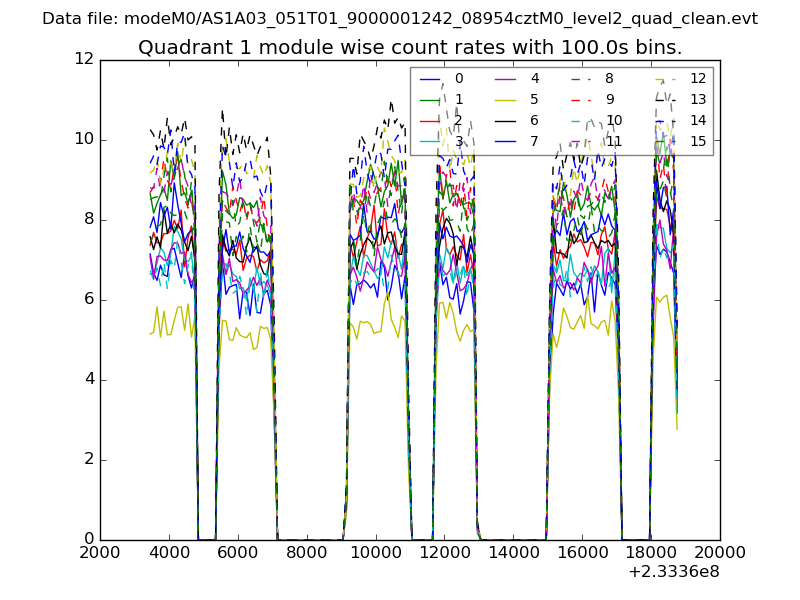 |
 |
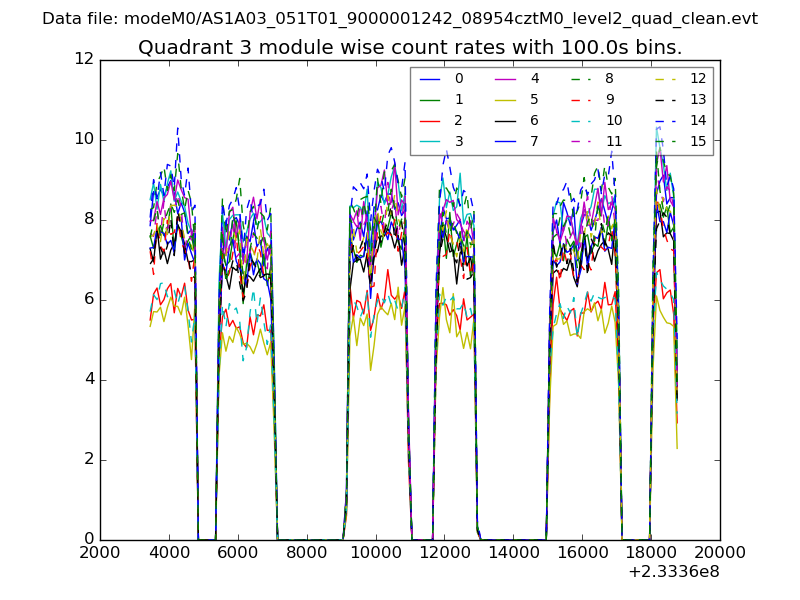
| Module-wise count rates for Quadrant C Data is divided into 100 sec bins |
 |
 |
| Module-wise count rates for Quadrant D Data is divided into 100 sec bins |
 |
 |
| Parameter | Plot |
|---|---|
| CZT HV Monitor | 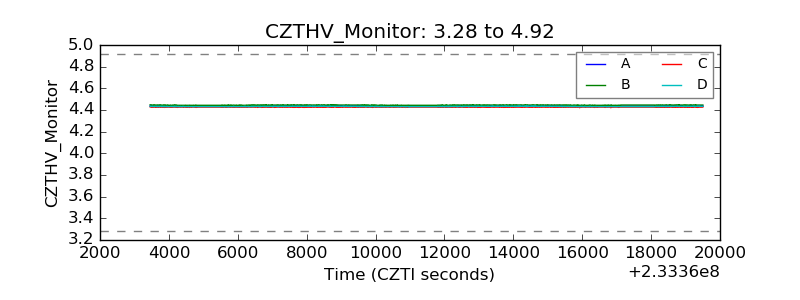 |
| D_VDD | 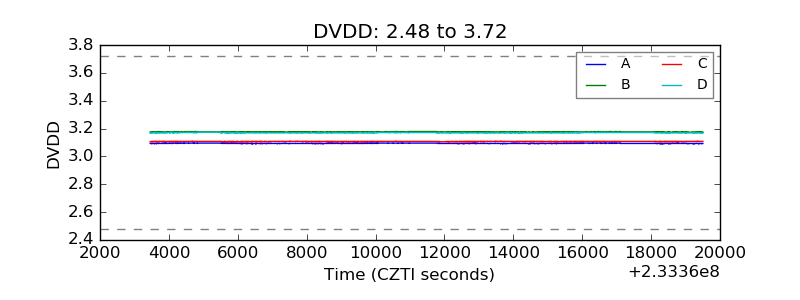 |
| Temperature 1 | 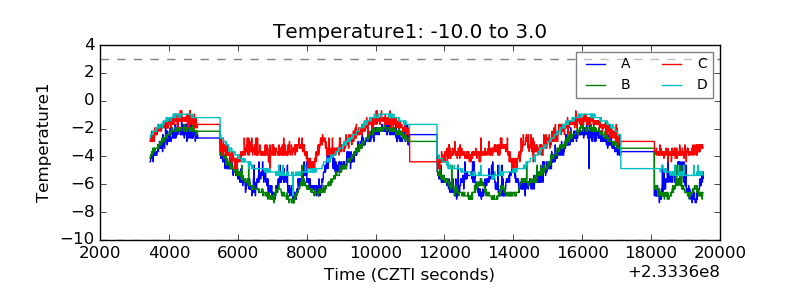 |
| Veto HV Monitor | 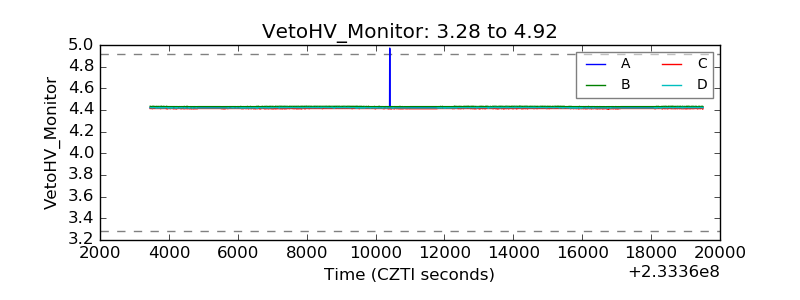 |
| Veto LLD |  |
| Alpha Counter | 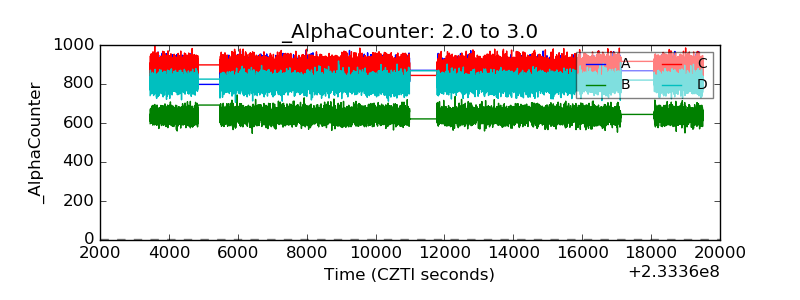 |
| _CPM_Rate | 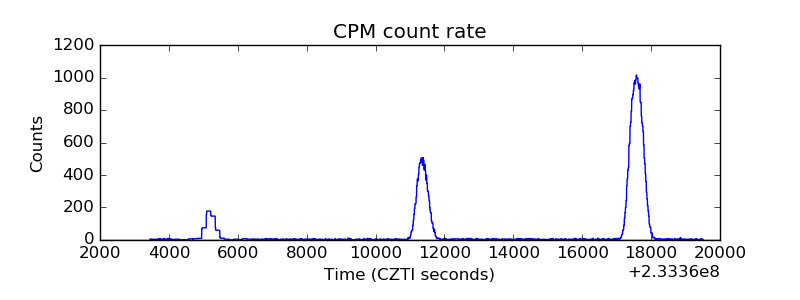 |
| CZT Counter | 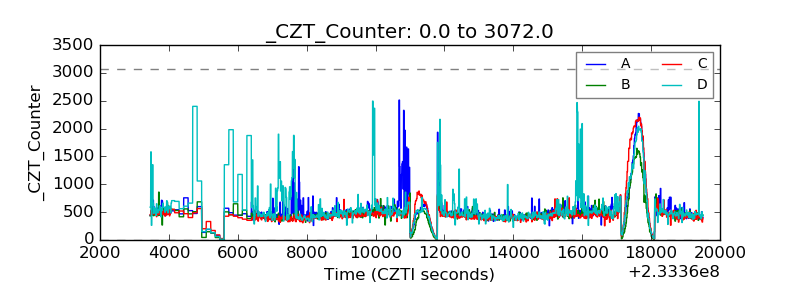 |
| +2.5 Volts monitor |  |
| +5 Volts monitor |  |
| _ROLL_ROT | 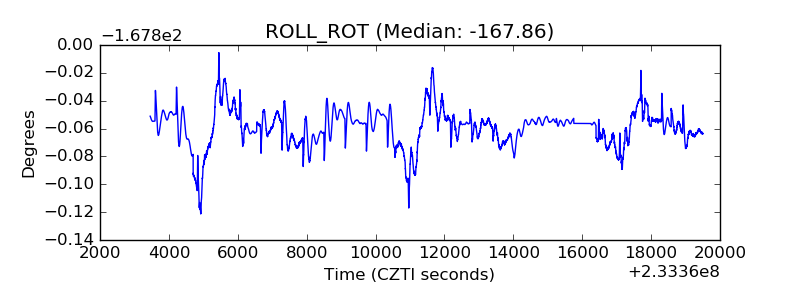 |
| _Roll_DEC | 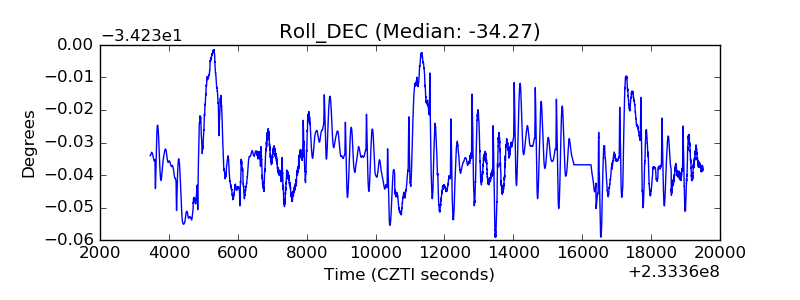 |
| _Roll_RA | 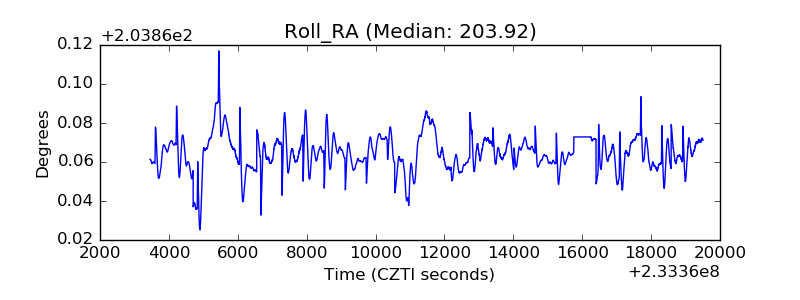 |
| Veto Counter | 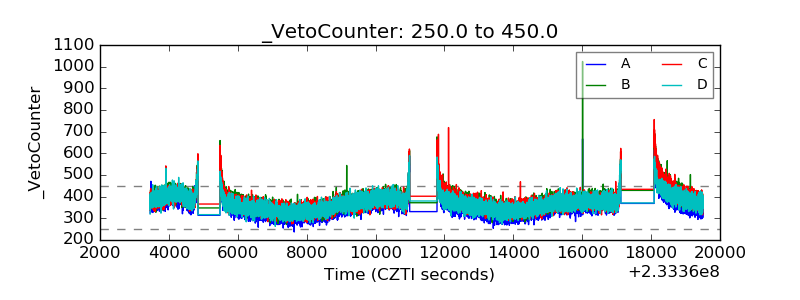 |