| Param | Original file | Final file |
|---|---|---|
| Filename | modeM0/AS1A03_051T01_9000001242_08956cztM0_level2.evt | modeM0/AS1A03_051T01_9000001242_08956cztM0_level2_quad_clean.evt |
| Size (bytes) | 482,405,760 | 75,458,880 |
| Size | 460.1 MB | 72.0 MB |
| Events in quadrant A | 3,824,487 | 449,805 |
| Events in quadrant B | 3,204,790 | 466,532 |
| Events in quadrant C | 3,496,906 | 454,986 |
| Events in quadrant D | 3,624,733 | 442,707 |
| Mode M9 | |||
|---|---|---|---|
| Quadrant | BADHDUFLAG | Total packets | Discarded packets |
| A | 0 | 20 | 0 |
| B | 0 | 20 | 0 |
| C | 0 | 20 | 0 |
| D | 0 | 20 | 0 |
| Mode M0 | |||
|---|---|---|---|
| Quadrant | BADHDUFLAG | Total packets | Discarded packets |
| A | 0 | 15681 | 3 |
| B | 0 | 13848 | 2 |
| C | 0 | 15008 | 2 |
| D | 0 | 15069 | 2 |
| Mode SS | |||
|---|---|---|---|
| Quadrant | BADHDUFLAG | Total packets | Discarded packets |
| A | 0 | 142 | 0 |
| B | 0 | 142 | 0 |
| C | 0 | 142 | 0 |
| D | 0 | 142 | 0 |
| Quadrant | Total seconds | Saturated seconds | Saturation percentage |
|---|---|---|---|
| A | 6743 | 190 | 2.817737% |
| B | 6743 | 36 | 0.533887% |
| C | 6743 | 195 | 2.891888% |
| D | 6743 | 74 | 1.097434% |
Noise dominated data is calculated using 1-second bins in cleaned event files. If a bin has >2000 counts, and if more than 50% of those come from <1% of pixels, then it is considered to be noise-dominated and hence unusable.
| Quadrant | # 1 sec bins | Bins with >0 counts | Bins with >2000 counts | High rate bins dominated by noise | Noise dominated (total time) | Noise dominated (detector-on time) | Marked lightcurve |
|---|---|---|---|---|---|---|---|
| A | 8818 | 6744 | 122 | 122 | 1.38% | 1.81% | 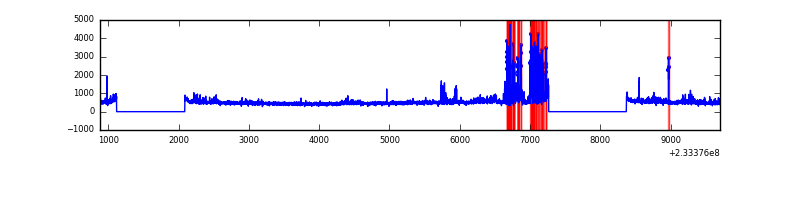 |
| B | 8818 | 6745 | 1 | 1 | 0.01% | 0.01% | 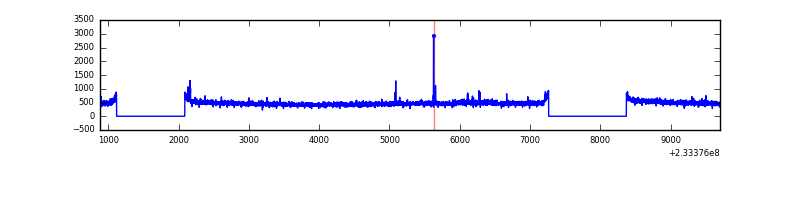 |
| C | 8817 | 6744 | 116 | 116 | 1.32% | 1.72% |  |
| D | 8818 | 6745 | 40 | 40 | 0.45% | 0.59% | 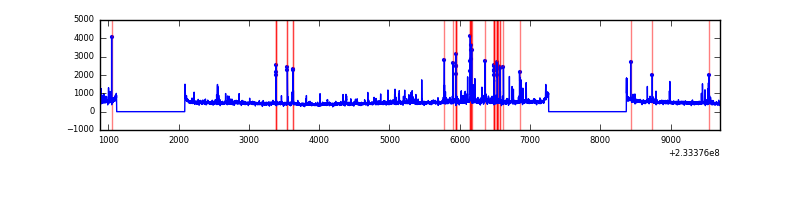 |
Top three noisy pixels from each quadrant. If the there are fewer than three noisy pixels in the level2.evt file, extra rows are filled as -1
| Pixel properties | Quadrant properties | ||||||
|---|---|---|---|---|---|---|---|
| Quadrant | DetID | PixID | Counts | Sigma | Mean | Median | Sigma |
| A | 5 | 16 | 427533 | 2640.7 | 796 | 779 | 161.6 |
| A | 8 | 5 | 312286 | 1927.57 | 796 | 779 | 161.6 |
| A | 13 | 164 | 11060 | 63.62 | 796 | 779 | 161.6 |
| B | 0 | 214 | 19325 | 120.25 | 813 | 794 | 154.1 |
| B | 12 | 111 | 16516 | 102.02 | 813 | 794 | 154.1 |
| B | 11 | 111 | 12981 | 79.08 | 813 | 794 | 154.1 |
| C | 4 | 254 | 470587 | 2623.66 | 774 | 778 | 179.1 |
| C | 13 | 61 | 5970 | 28.99 | 774 | 778 | 179.1 |
| C | 4 | 238 | 3466 | 15.01 | 774 | 778 | 179.1 |
| D | 8 | 195 | 261394 | 1324.69 | 775 | 756 | 196.8 |
| D | 6 | 225 | 117543 | 593.57 | 775 | 756 | 196.8 |
| D | 2 | 14 | 69059 | 347.15 | 775 | 756 | 196.8 |
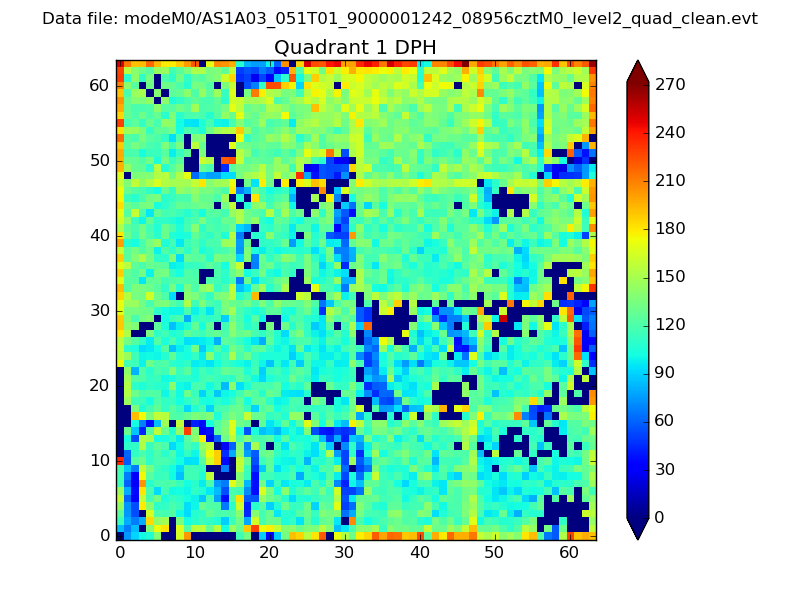
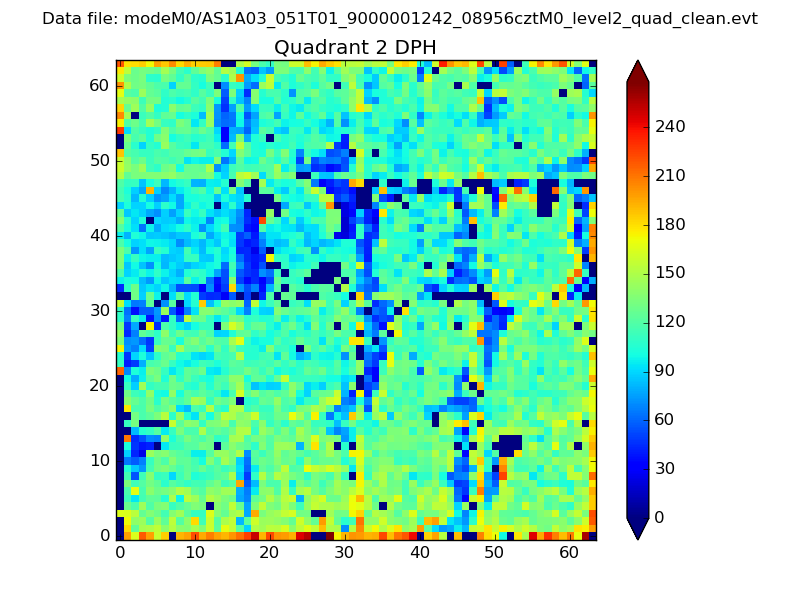
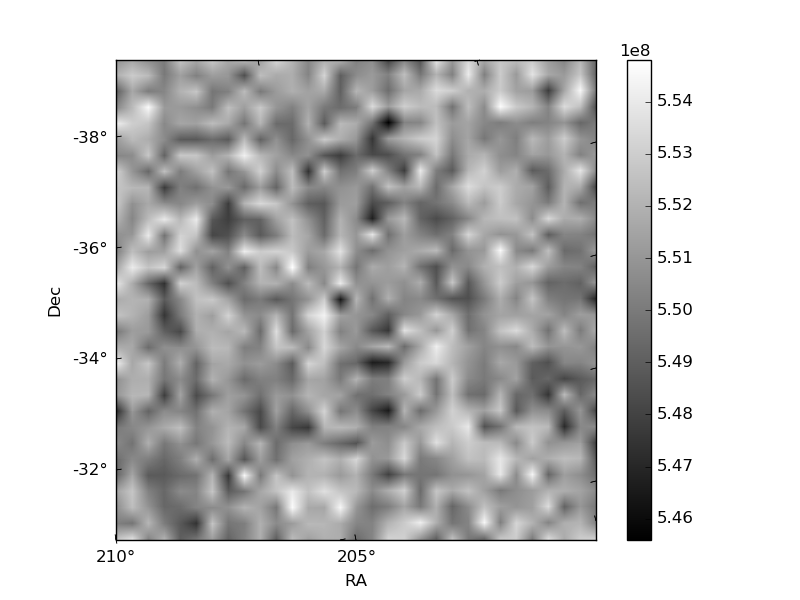
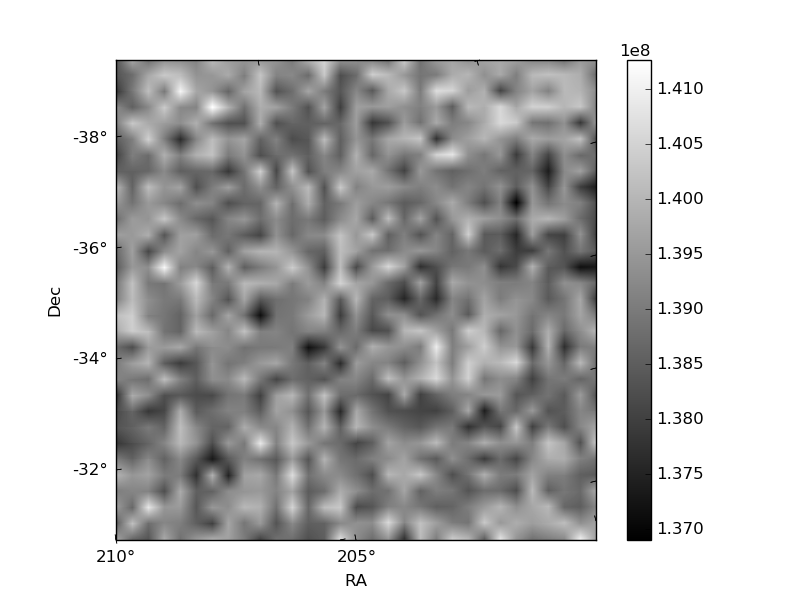
Histogram calculated using DETX and DETY for each event in the final _common_clean file
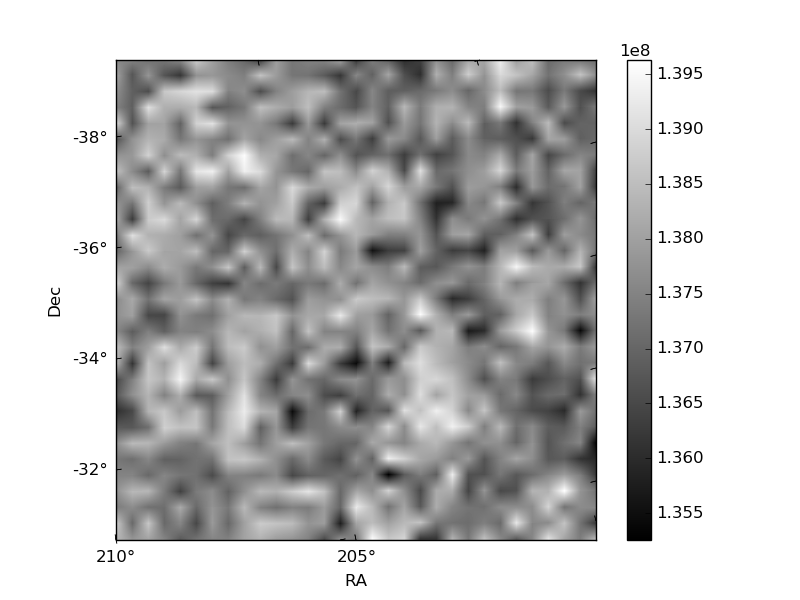
| Quadrant A | 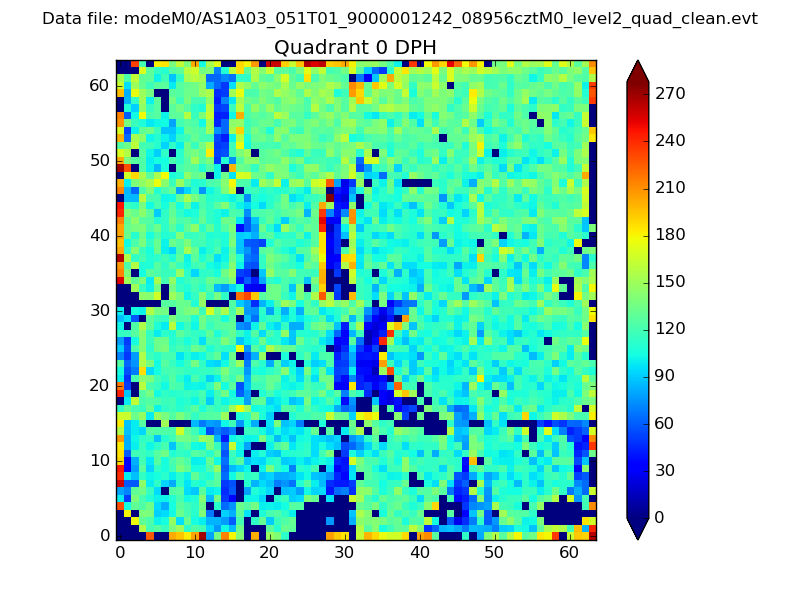 |
 |
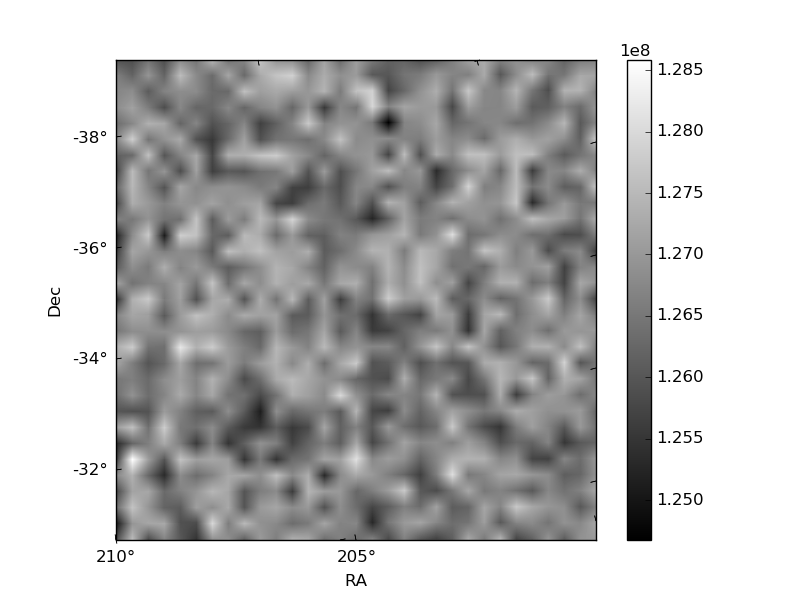
Quadrant B |
|---|---|---|---|
| Quadrant D | 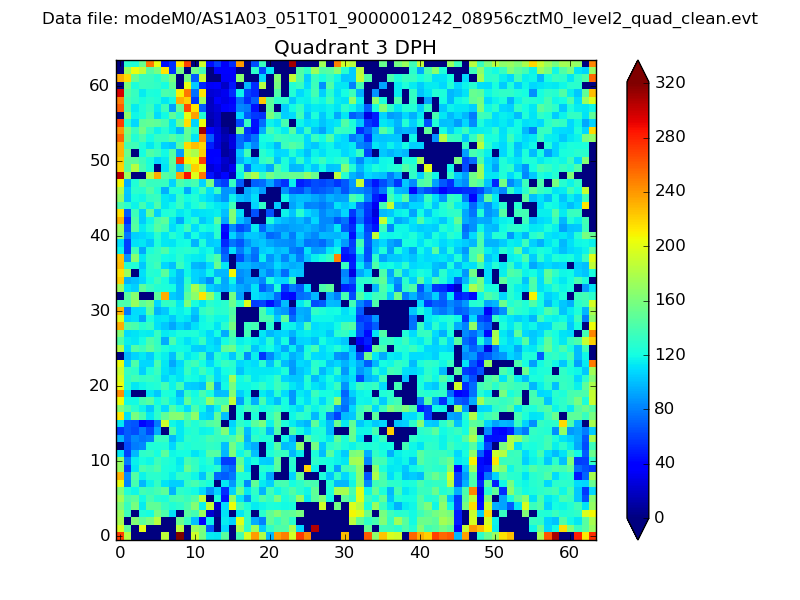 |
 |
Quadrant C |
| Plot type | Count rate plots | Images |
|---|---|---|
| Comparison with Poisson distribution Blue bars denote a histogram of data divided into 1 sec bins. Red curve is a Poisson curve with rate = median count rate of data. |
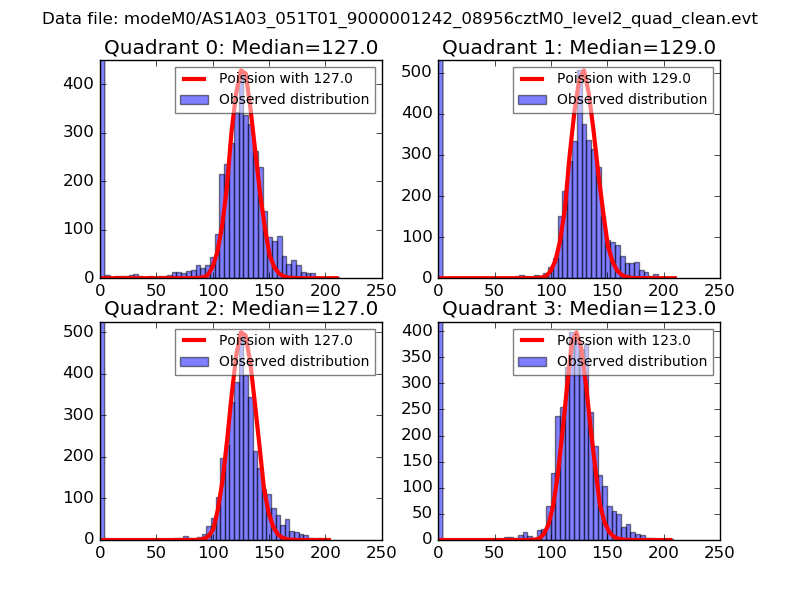 |
 |
| Quadrant-wise count rates Data is divided into 100 sec bins |
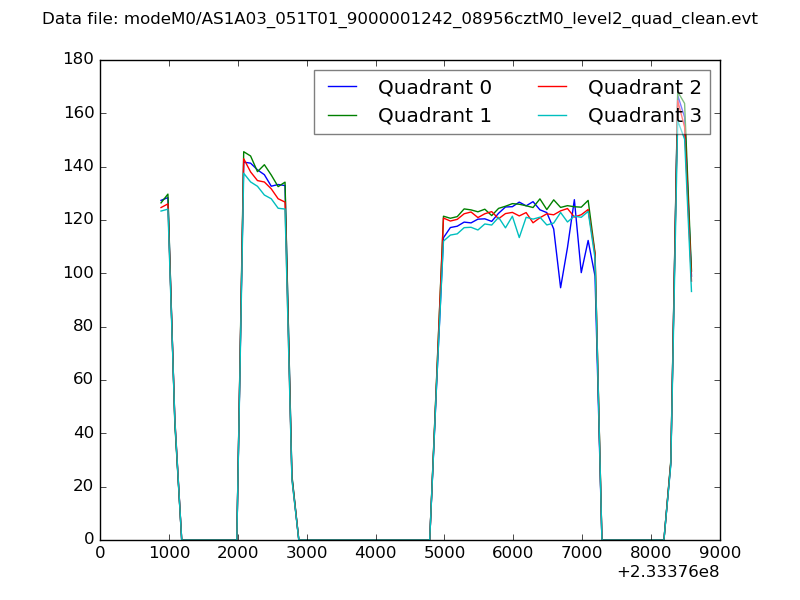 |
|
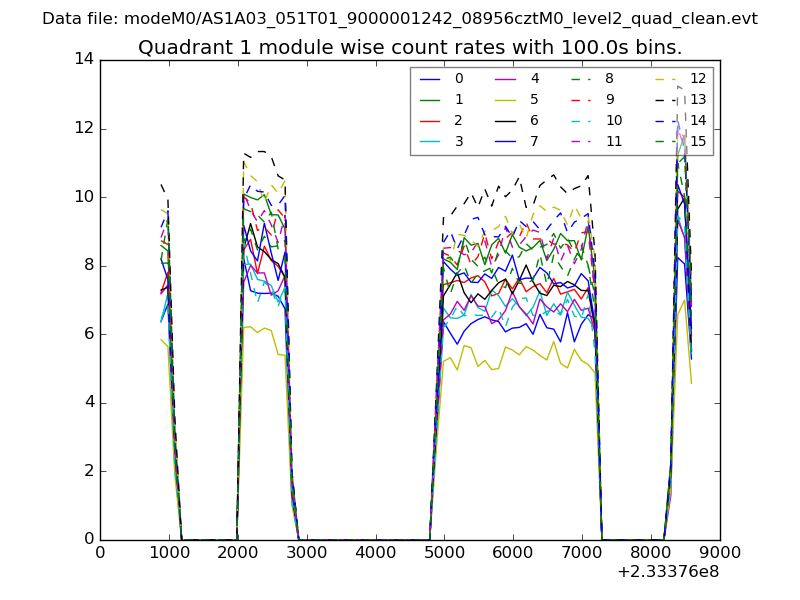
| Module-wise count rates for Quadrant A Data is divided into 100 sec bins |
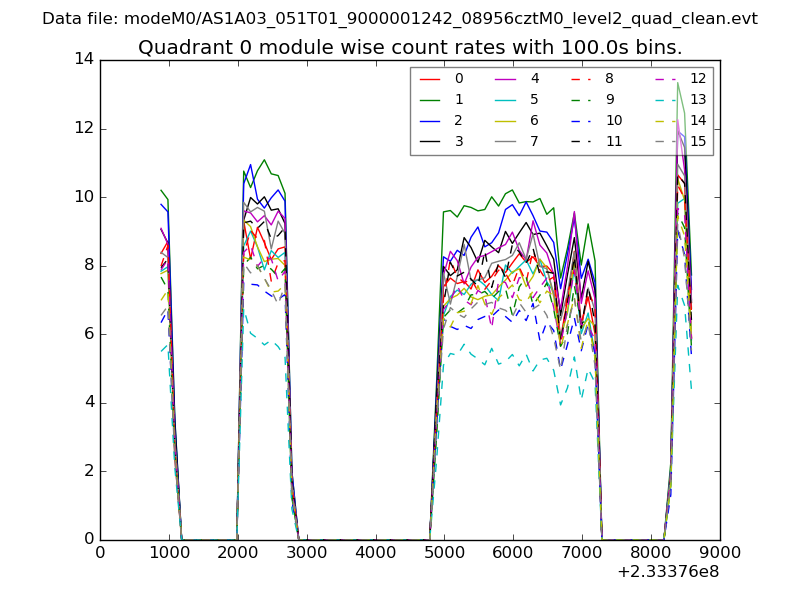 |
 |
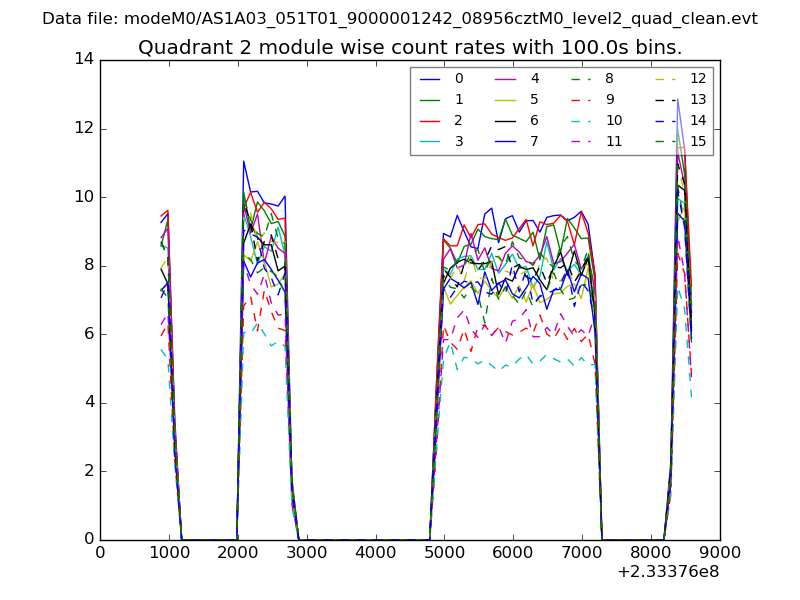
| Module-wise count rates for Quadrant B Data is divided into 100 sec bins |
 |
 |
| Module-wise count rates for Quadrant C Data is divided into 100 sec bins |
 |
 |
| Module-wise count rates for Quadrant D Data is divided into 100 sec bins |
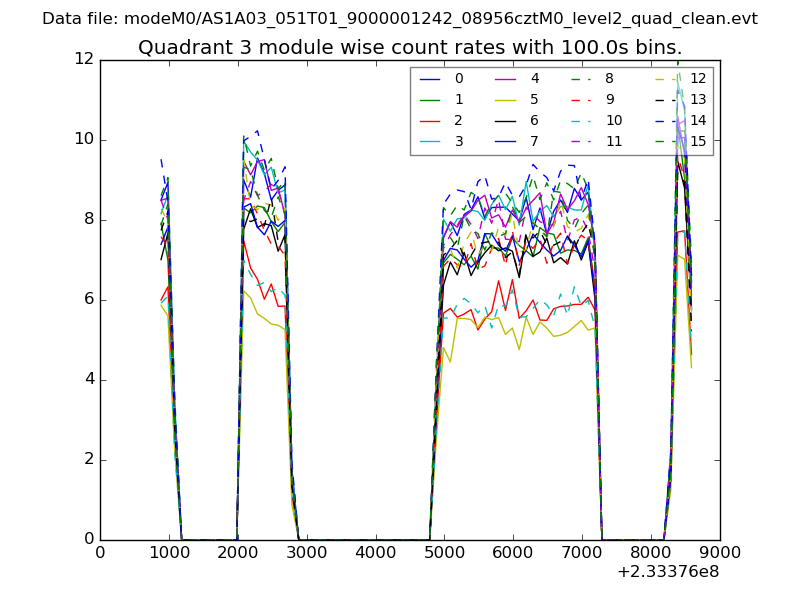 |
 |
| Parameter | Plot |
|---|---|
| CZT HV Monitor | 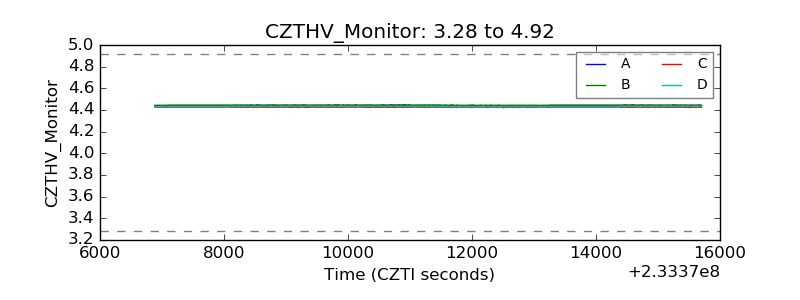 |
| D_VDD | 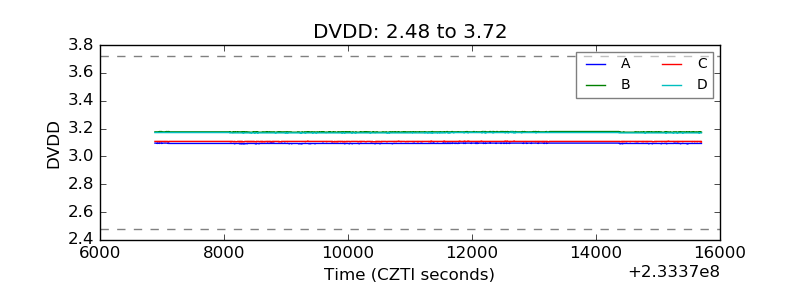 |
| Temperature 1 | 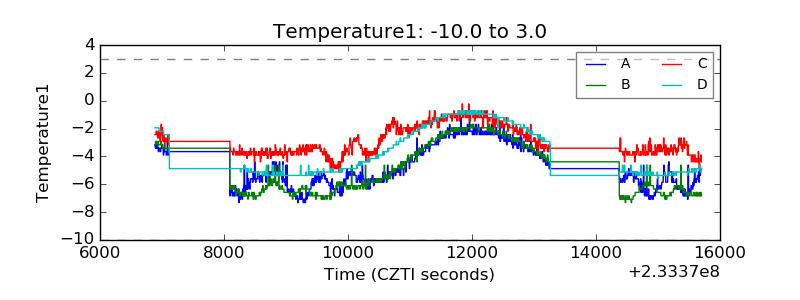 |
| Veto HV Monitor | 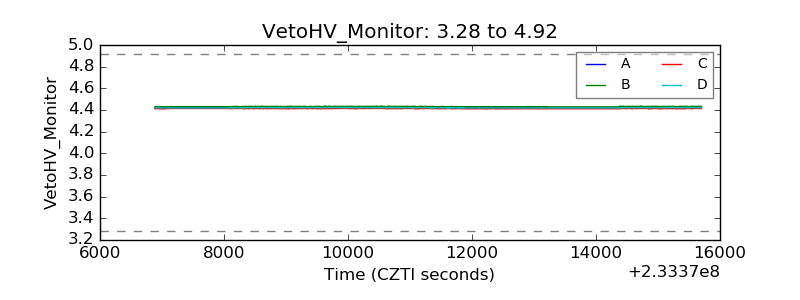 |
| Veto LLD | 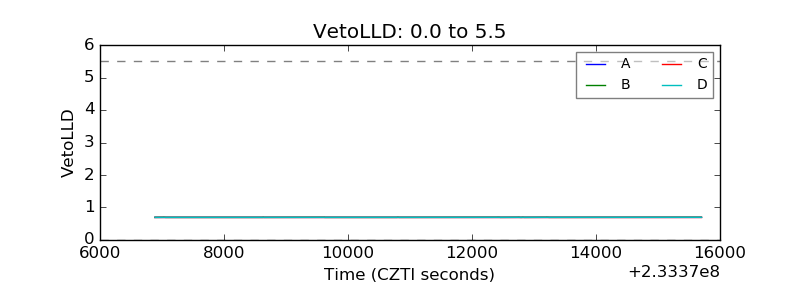 |
| Alpha Counter | 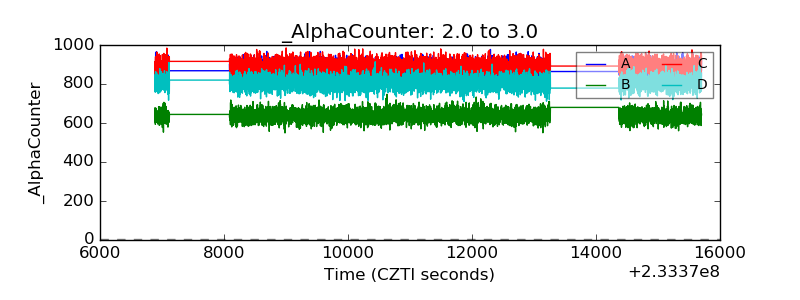 |
| _CPM_Rate | 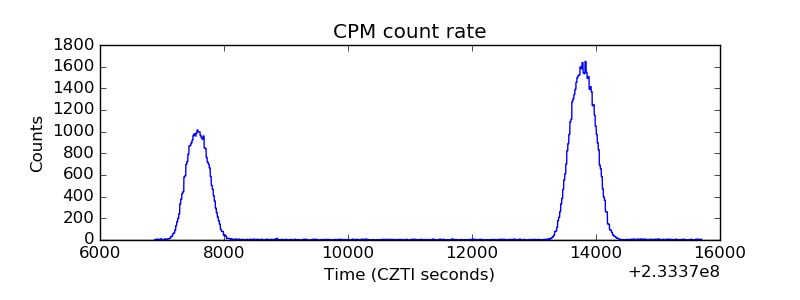 |
| CZT Counter |  |
| +2.5 Volts monitor |  |
| +5 Volts monitor |  |
| _ROLL_ROT | 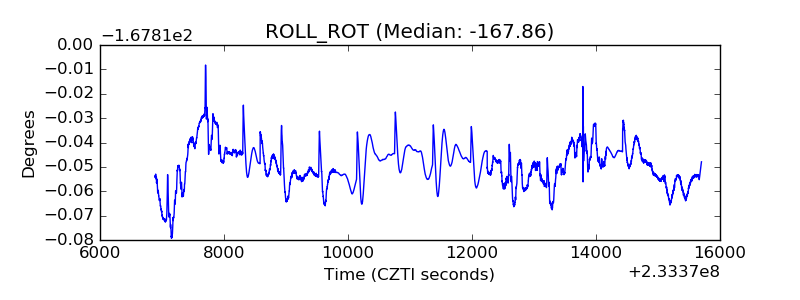 |
| _Roll_DEC |  |
| _Roll_RA | 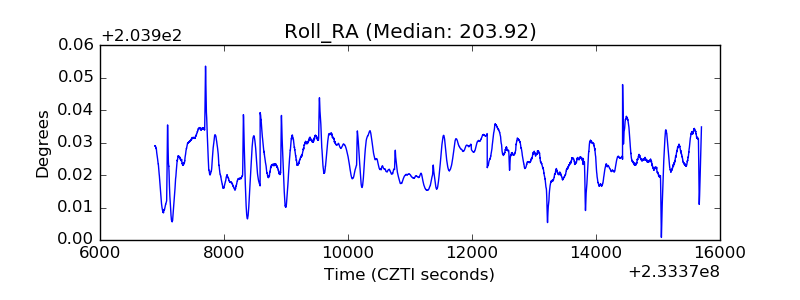 |
| Veto Counter | 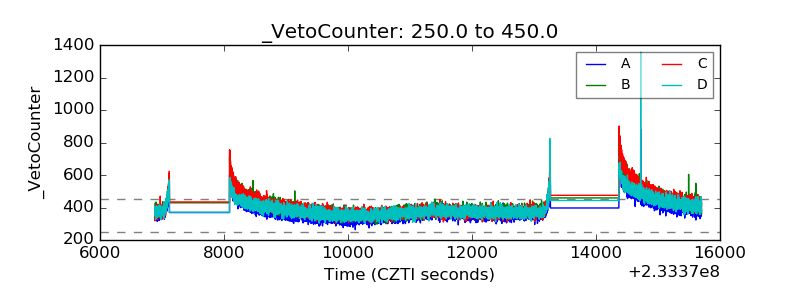 |