| Param | Original file | Final file |
|---|---|---|
| Filename | modeM0/AS1A03_051T01_9000001242_08957cztM0_level2.evt | modeM0/AS1A03_051T01_9000001242_08957cztM0_level2_quad_clean.evt |
| Size (bytes) | 472,086,720 | 63,884,160 |
| Size | 450.2 MB | 60.9 MB |
| Events in quadrant A | 3,496,831 | 372,498 |
| Events in quadrant B | 3,108,226 | 382,476 |
| Events in quadrant C | 3,598,510 | 376,024 |
| Events in quadrant D | 3,665,707 | 363,256 |
| Mode M9 | |||
|---|---|---|---|
| Quadrant | BADHDUFLAG | Total packets | Discarded packets |
| A | 0 | 15 | 0 |
| B | 0 | 15 | 0 |
| C | 0 | 15 | 0 |
| D | 0 | 16 | 0 |
| Mode M0 | |||
|---|---|---|---|
| Quadrant | BADHDUFLAG | Total packets | Discarded packets |
| A | 0 | 14295 | 3 |
| B | 0 | 13131 | 2 |
| C | 0 | 14828 | 2 |
| D | 0 | 14752 | 2 |
| Mode SS | |||
|---|---|---|---|
| Quadrant | BADHDUFLAG | Total packets | Discarded packets |
| A | 0 | 128 | 0 |
| B | 0 | 128 | 0 |
| C | 0 | 128 | 0 |
| D | 0 | 128 | 0 |
| Quadrant | Total seconds | Saturated seconds | Saturation percentage |
|---|---|---|---|
| A | 6302 | 107 | 1.697874% |
| B | 6302 | 34 | 0.539511% |
| C | 6302 | 270 | 4.284354% |
| D | 6302 | 115 | 1.824818% |
Noise dominated data is calculated using 1-second bins in cleaned event files. If a bin has >2000 counts, and if more than 50% of those come from <1% of pixels, then it is considered to be noise-dominated and hence unusable.
| Quadrant | # 1 sec bins | Bins with >0 counts | Bins with >2000 counts | High rate bins dominated by noise | Noise dominated (total time) | Noise dominated (detector-on time) | Marked lightcurve |
|---|---|---|---|---|---|---|---|
| A | 7492 | 6303 | 66 | 66 | 0.88% | 1.05% | 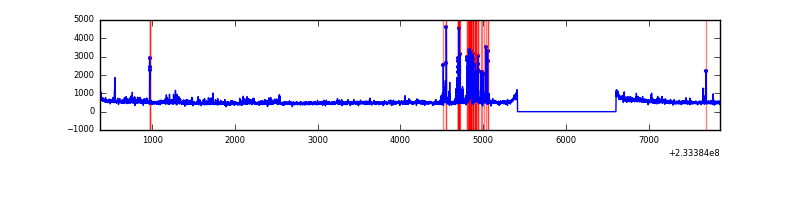 |
| B | 7492 | 6303 | 0 | 0 | 0.00% | 0.00% | 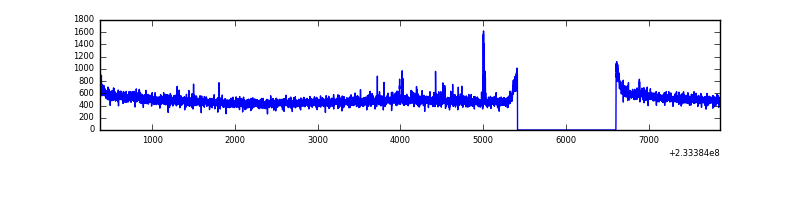 |
| C | 7492 | 6303 | 177 | 177 | 2.36% | 2.81% | 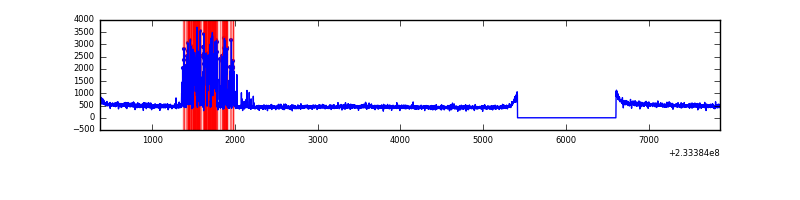 |
| D | 7492 | 6303 | 81 | 81 | 1.08% | 1.29% | 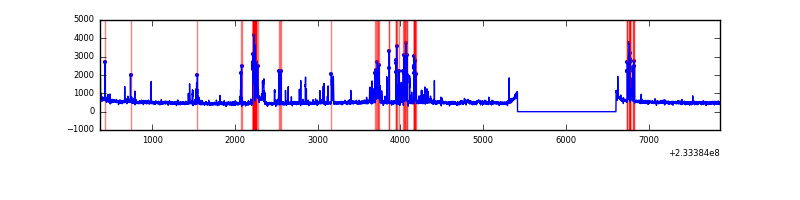 |
Top three noisy pixels from each quadrant. If the there are fewer than three noisy pixels in the level2.evt file, extra rows are filled as -1
| Pixel properties | Quadrant properties | ||||||
|---|---|---|---|---|---|---|---|
| Quadrant | DetID | PixID | Counts | Sigma | Mean | Median | Sigma |
| A | 5 | 16 | 262942 | 1696.22 | 775 | 760 | 154.6 |
| A | 8 | 5 | 212336 | 1368.81 | 775 | 760 | 154.6 |
| A | 13 | 248 | 18521 | 114.91 | 775 | 760 | 154.6 |
| B | 4 | 173 | 24498 | 161.0 | 787 | 771 | 147.4 |
| B | 0 | 214 | 19164 | 124.81 | 787 | 771 | 147.4 |
| B | 12 | 111 | 15819 | 102.11 | 787 | 771 | 147.4 |
| C | 4 | 254 | 674944 | 3911.73 | 749 | 754 | 172.4 |
| C | 13 | 61 | 5673 | 28.54 | 749 | 754 | 172.4 |
| C | 4 | 238 | 4673 | 22.74 | 749 | 754 | 172.4 |
| D | 13 | 104 | 313746 | 1650.65 | 752 | 733 | 189.6 |
| D | 8 | 195 | 172672 | 906.71 | 752 | 733 | 189.6 |
| D | 6 | 225 | 70816 | 369.58 | 752 | 733 | 189.6 |
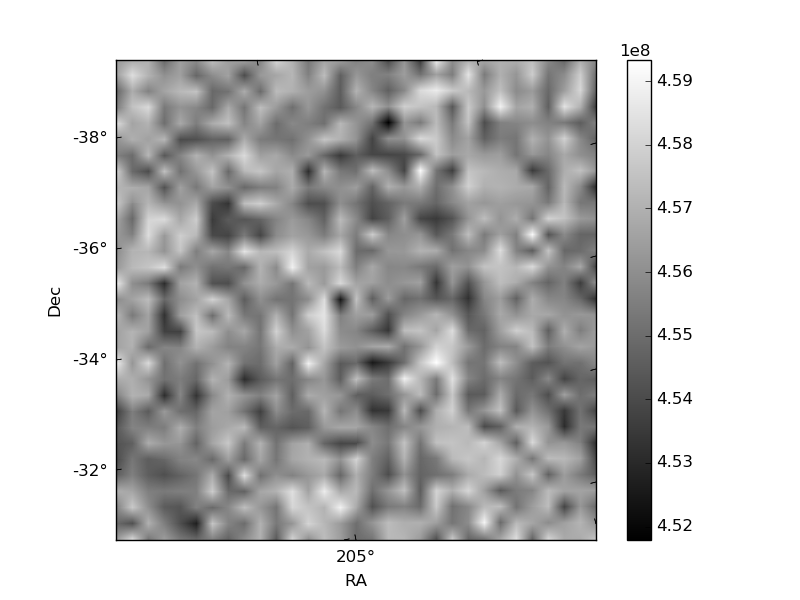
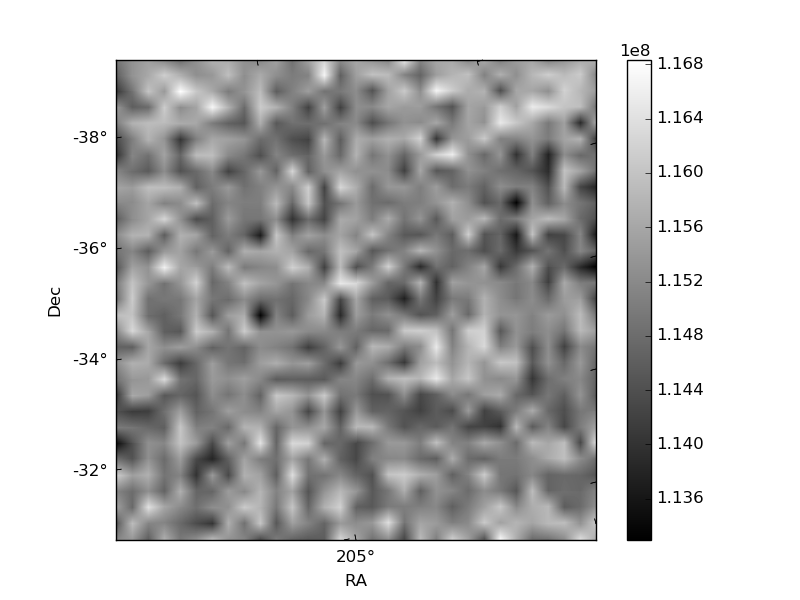
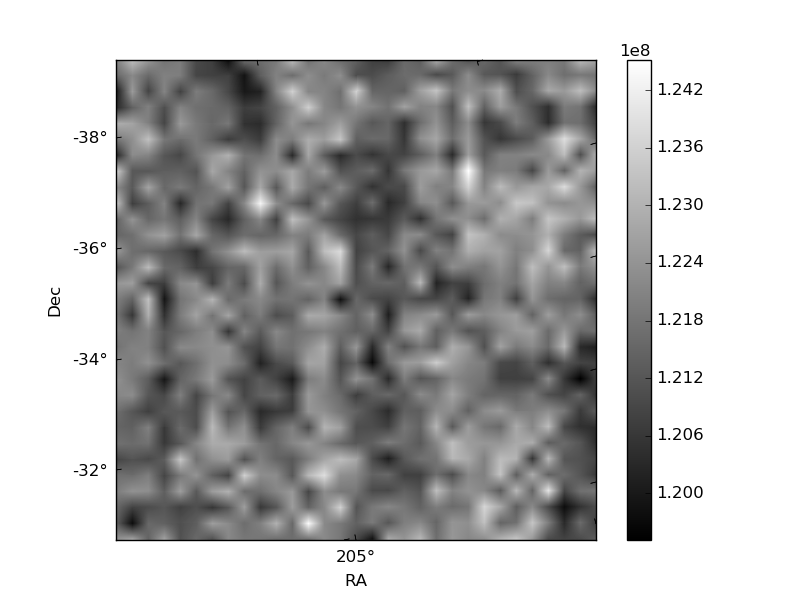
Histogram calculated using DETX and DETY for each event in the final _common_clean file
| Quadrant A | 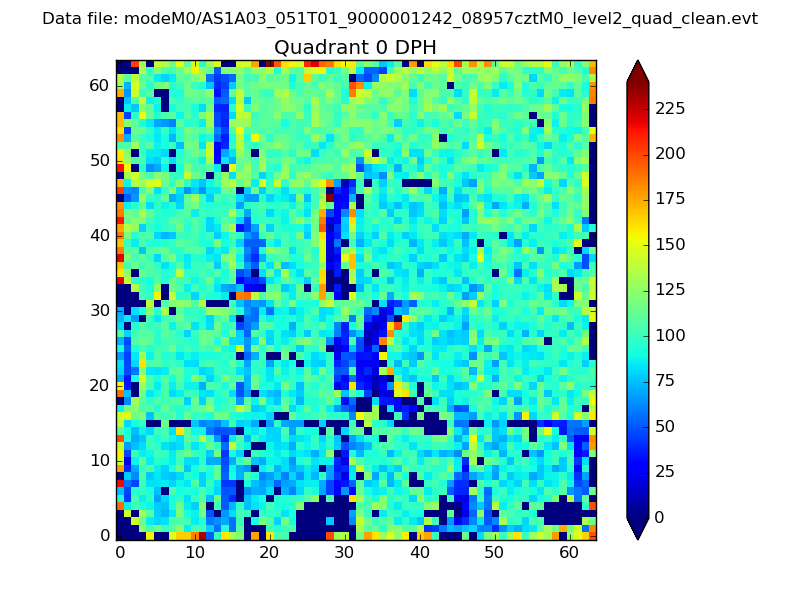 |
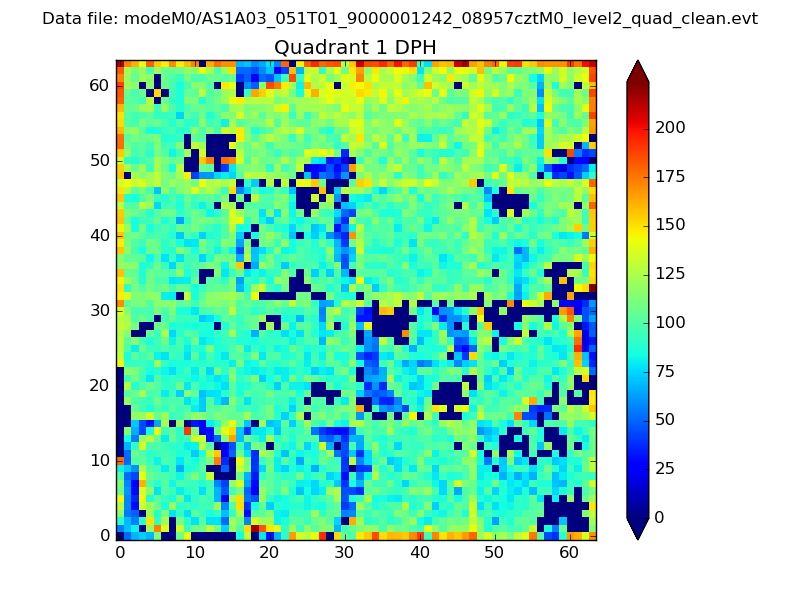 |
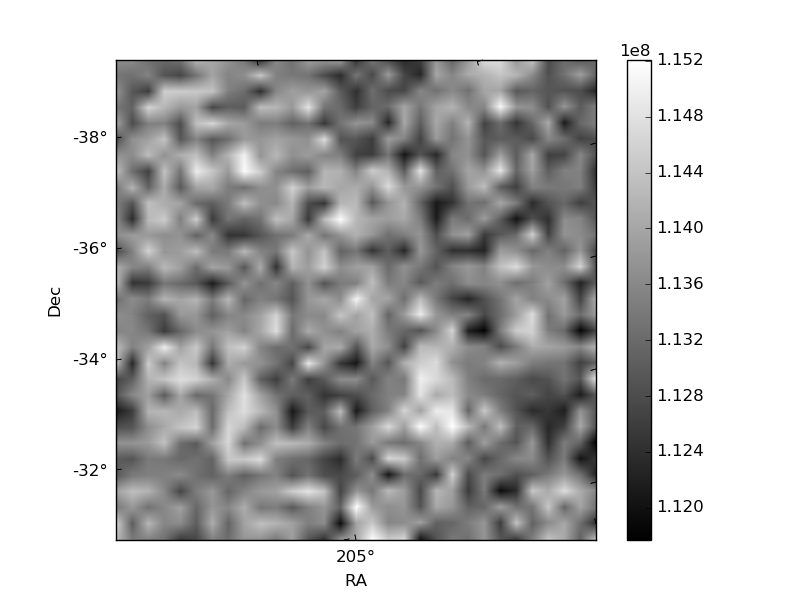
Quadrant B |
|---|---|---|---|
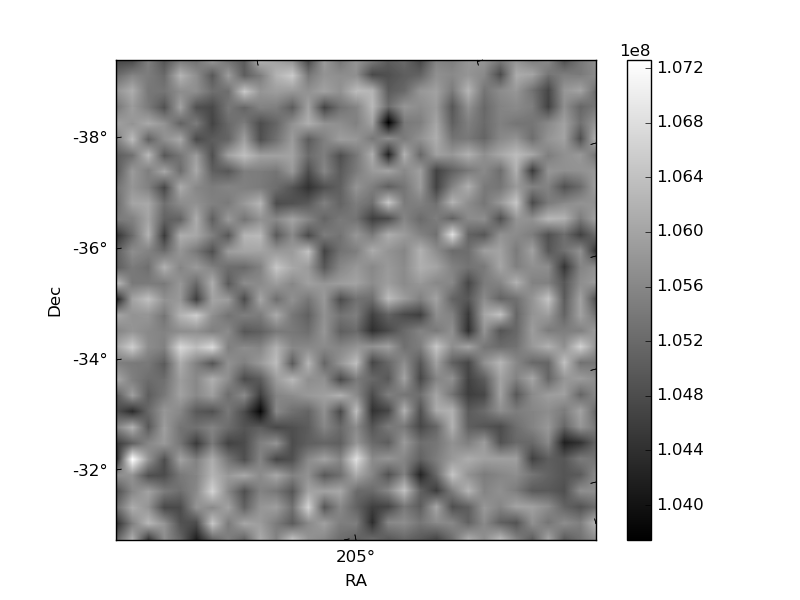
| Quadrant D | 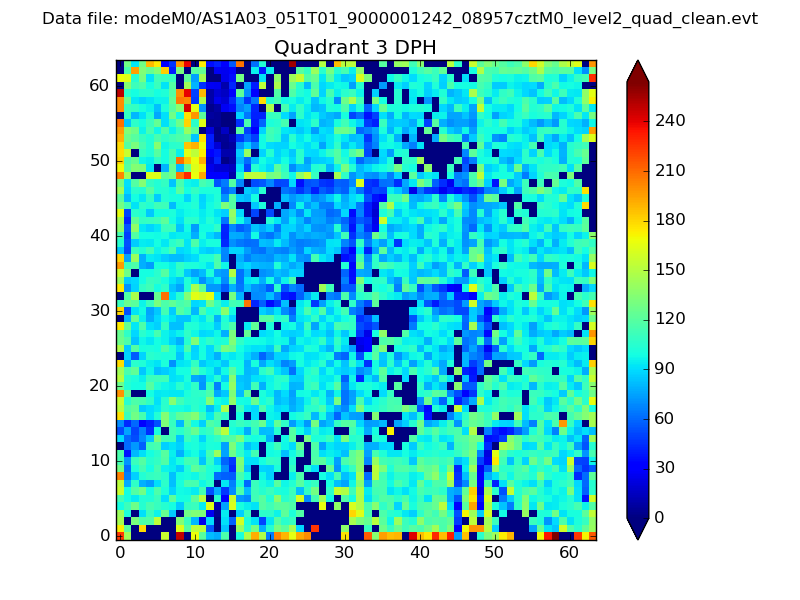 |
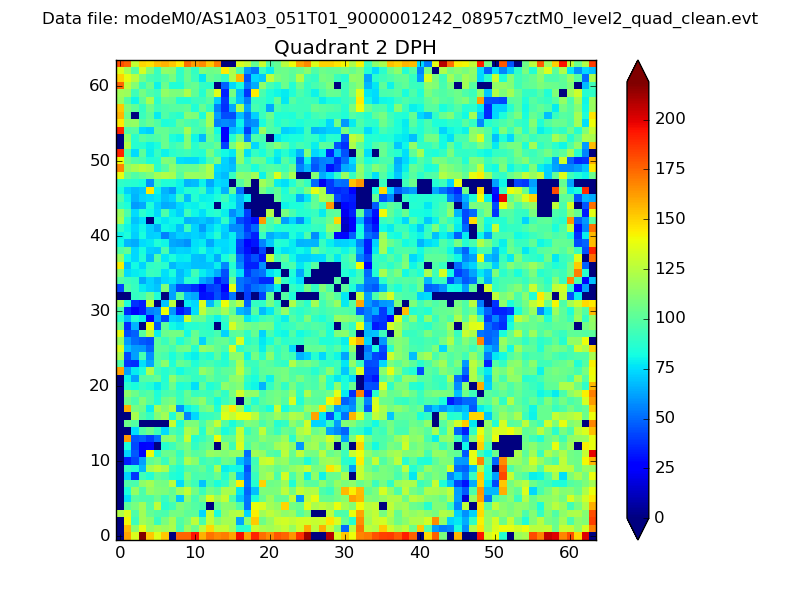 |
Quadrant C |
| Plot type | Count rate plots | Images |
|---|---|---|
| Comparison with Poisson distribution Blue bars denote a histogram of data divided into 1 sec bins. Red curve is a Poisson curve with rate = median count rate of data. |
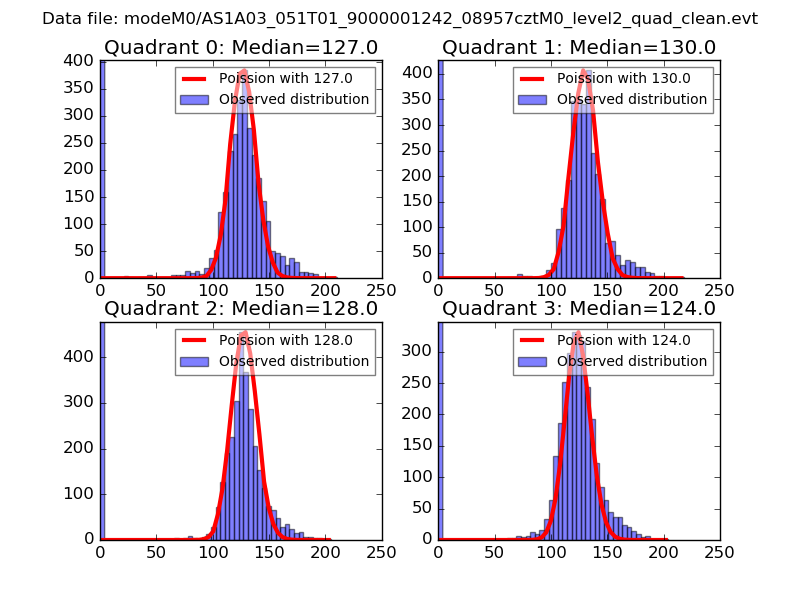 |
 |
| Quadrant-wise count rates Data is divided into 100 sec bins |
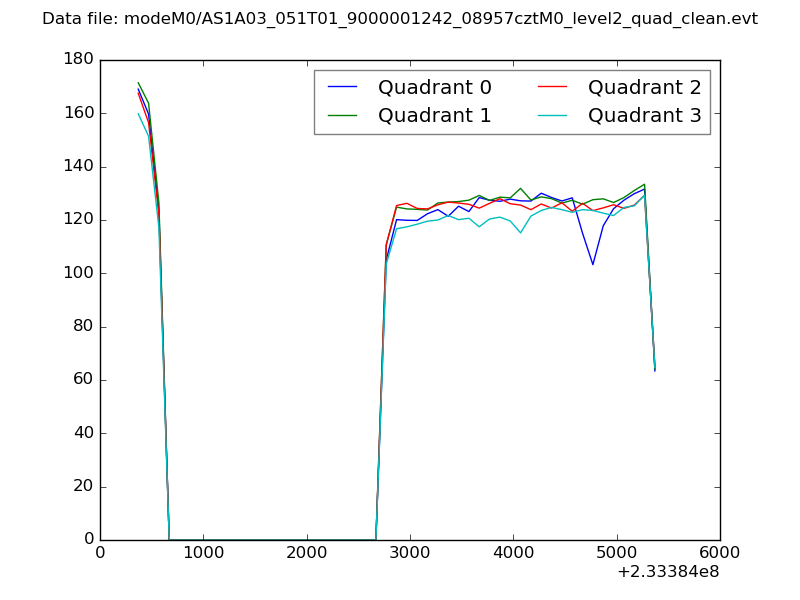 |
|
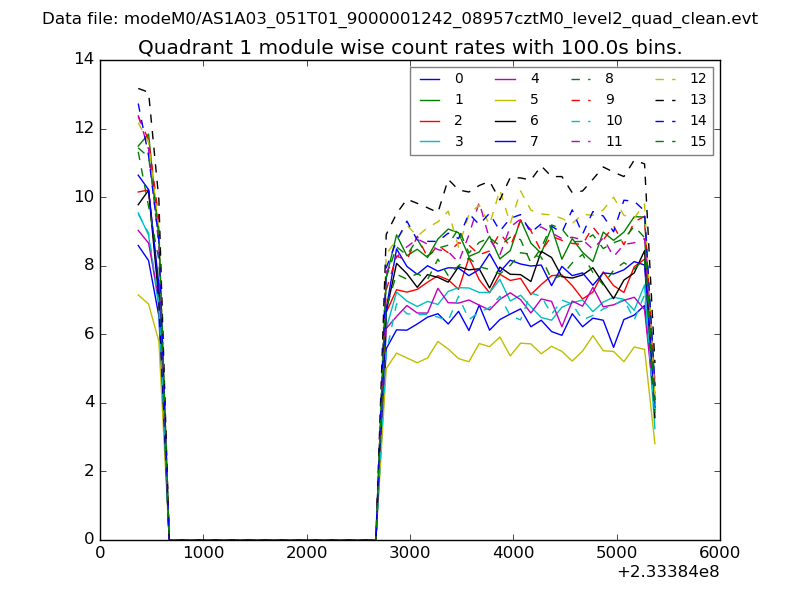
| Module-wise count rates for Quadrant A Data is divided into 100 sec bins |
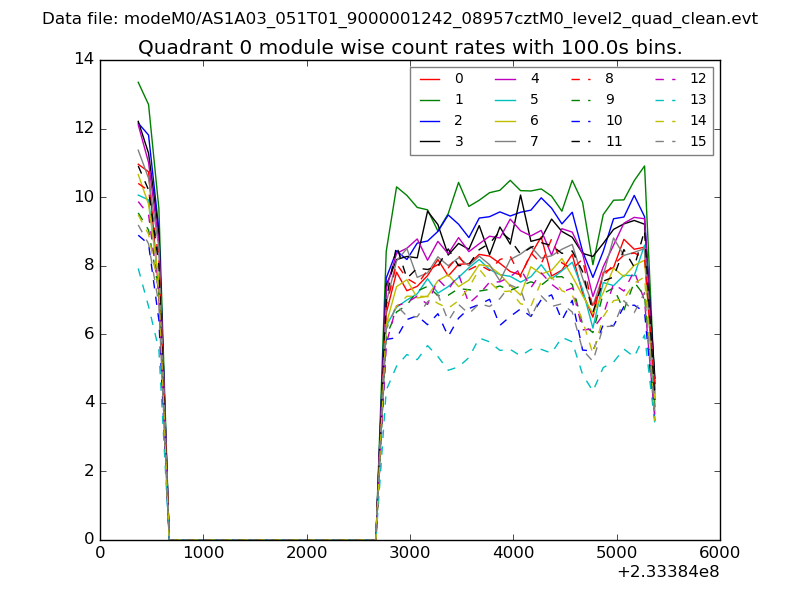 |
 |
| Module-wise count rates for Quadrant B Data is divided into 100 sec bins |
 |
 |
| Module-wise count rates for Quadrant C Data is divided into 100 sec bins |
 |
 |
| Module-wise count rates for Quadrant D Data is divided into 100 sec bins |
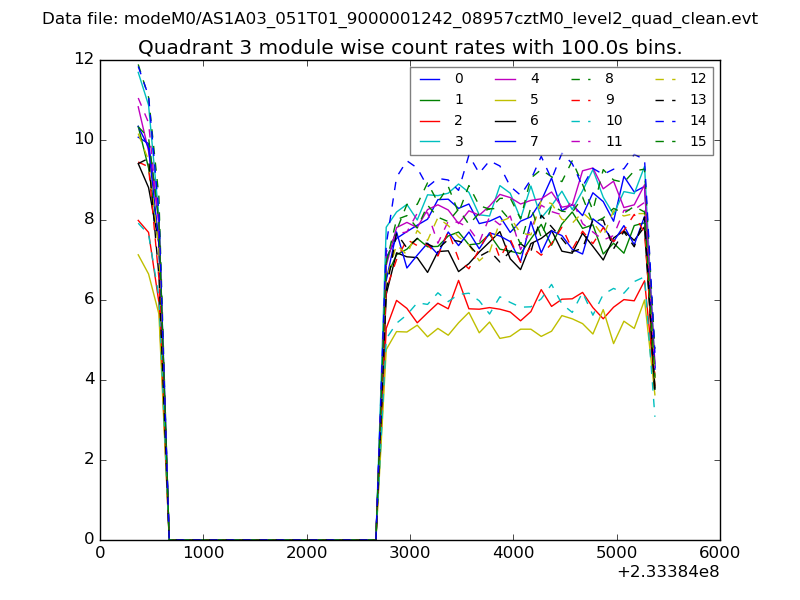 |
 |
| Parameter | Plot |
|---|---|
| CZT HV Monitor | 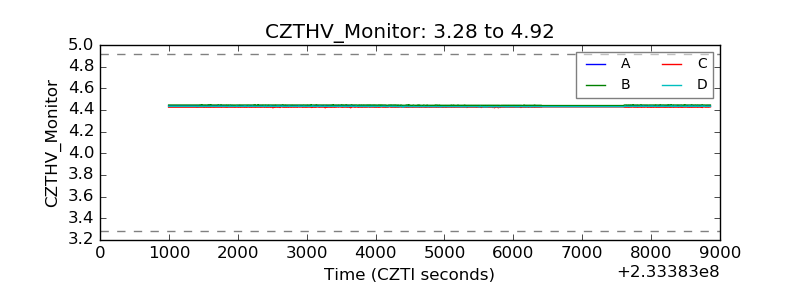 |
| D_VDD | 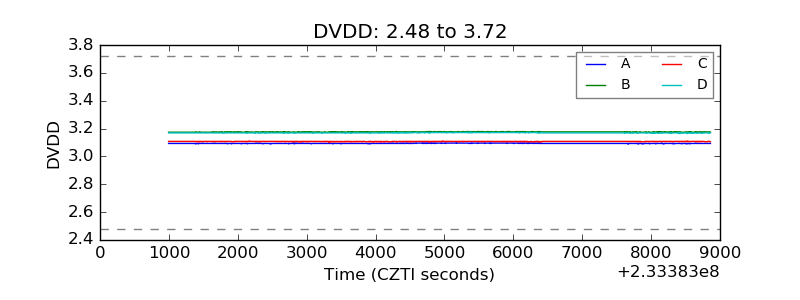 |
| Temperature 1 | 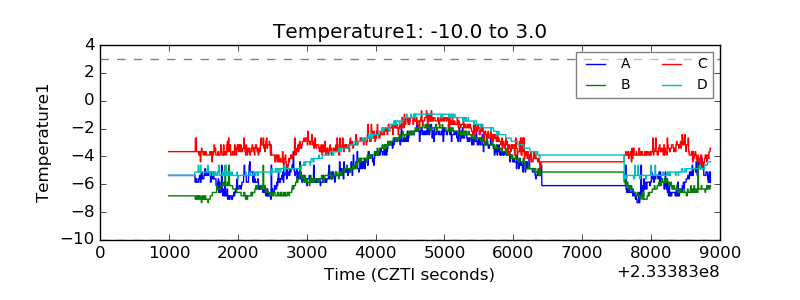 |
| Veto HV Monitor | 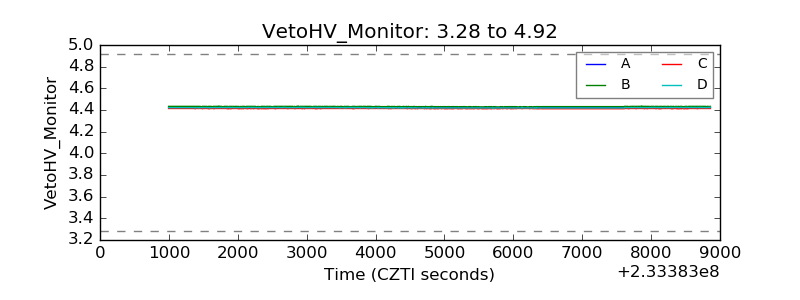 |
| Veto LLD | 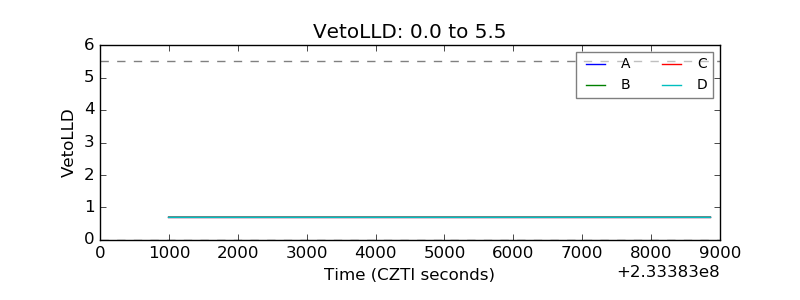 |
| Alpha Counter | 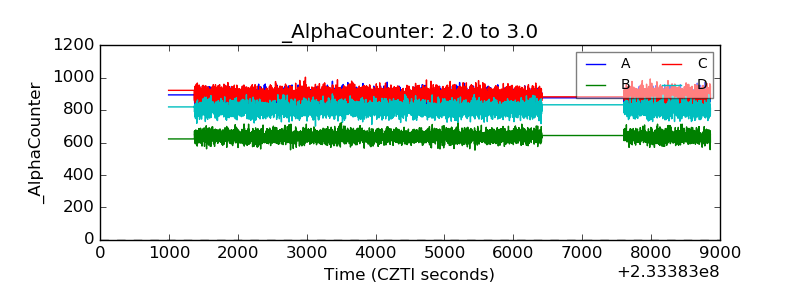 |
| _CPM_Rate | 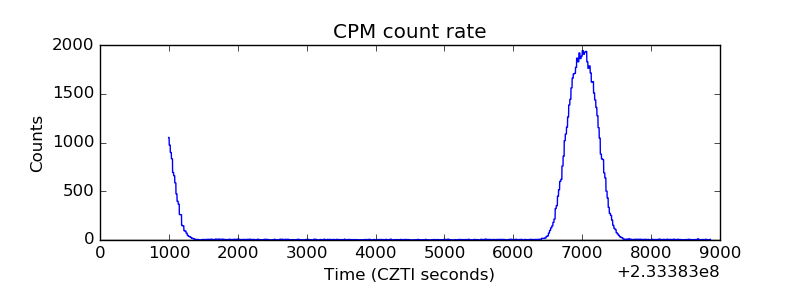 |
| CZT Counter | 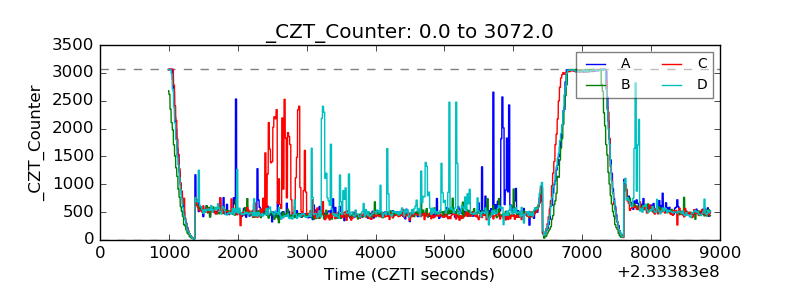 |
| +2.5 Volts monitor |  |
| +5 Volts monitor |  |
| _ROLL_ROT | 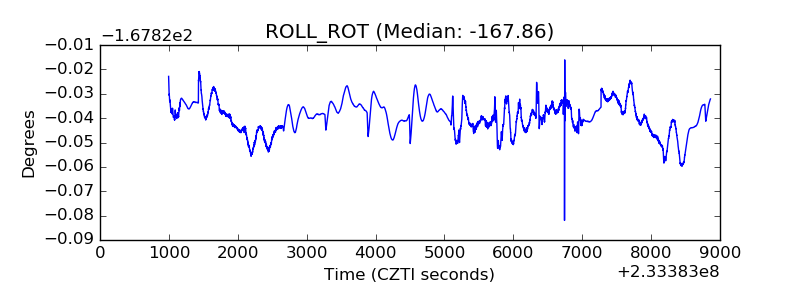 |
| _Roll_DEC | 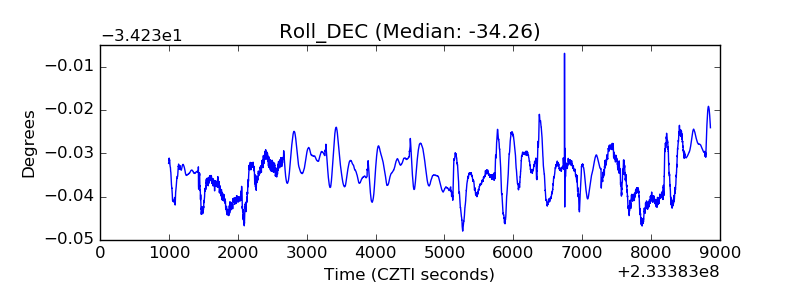 |
| _Roll_RA | 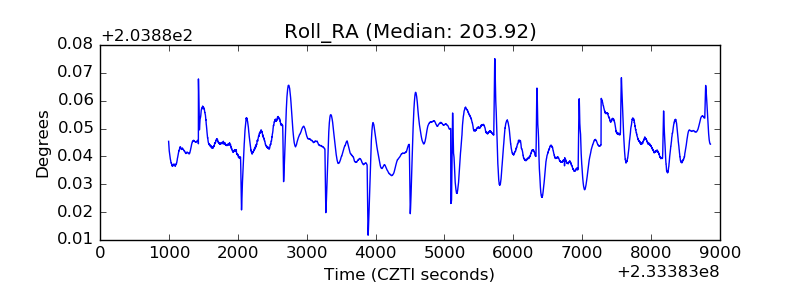 |
| Veto Counter | 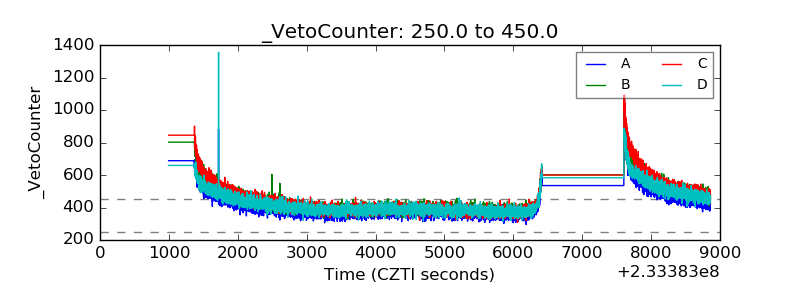 |