| Param | Original file | Final file |
|---|---|---|
| Filename | modeM0/AS1A03_051T01_9000001242_08959cztM0_level2.evt | modeM0/AS1A03_051T01_9000001242_08959cztM0_level2_quad_clean.evt |
| Size (bytes) | 486,547,200 | 74,361,600 |
| Size | 464.0 MB | 70.9 MB |
| Events in quadrant A | 4,013,004 | 450,590 |
| Events in quadrant B | 3,333,880 | 466,363 |
| Events in quadrant C | 3,229,822 | 457,641 |
| Events in quadrant D | 3,734,515 | 441,090 |
| Mode M9 | |||
|---|---|---|---|
| Quadrant | BADHDUFLAG | Total packets | Discarded packets |
| A | 0 | 21 | 0 |
| B | 0 | 21 | 0 |
| C | 0 | 21 | 0 |
| D | 0 | 22 | 0 |
| Mode M0 | |||
|---|---|---|---|
| Quadrant | BADHDUFLAG | Total packets | Discarded packets |
| A | 0 | 15844 | 5 |
| B | 0 | 13586 | 16 |
| C | 0 | 13520 | 14 |
| D | 0 | 14667 | 8 |
| Mode SS | |||
|---|---|---|---|
| Quadrant | BADHDUFLAG | Total packets | Discarded packets |
| A | 0 | 128 | 0 |
| B | 0 | 128 | 0 |
| C | 0 | 128 | 0 |
| D | 0 | 128 | 0 |
| Quadrant | Total seconds | Saturated seconds | Saturation percentage |
|---|---|---|---|
| A | 6243 | 232 | 3.716162% |
| B | 6238 | 107 | 1.715293% |
| C | 6238 | 117 | 1.875601% |
| D | 6241 | 131 | 2.099023% |
Noise dominated data is calculated using 1-second bins in cleaned event files. If a bin has >2000 counts, and if more than 50% of those come from <1% of pixels, then it is considered to be noise-dominated and hence unusable.
| Quadrant | # 1 sec bins | Bins with >0 counts | Bins with >2000 counts | High rate bins dominated by noise | Noise dominated (total time) | Noise dominated (detector-on time) | Marked lightcurve |
|---|---|---|---|---|---|---|---|
| A | 7549 | 6245 | 103 | 103 | 1.36% | 1.65% | 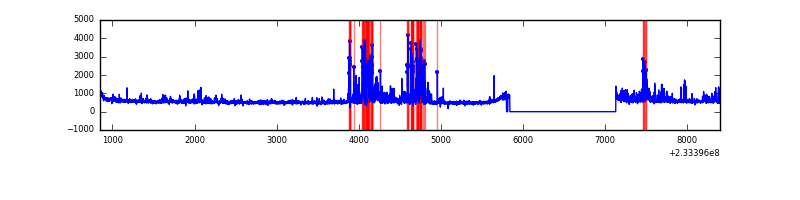 |
| B | 7549 | 6245 | 3 | 3 | 0.04% | 0.05% | 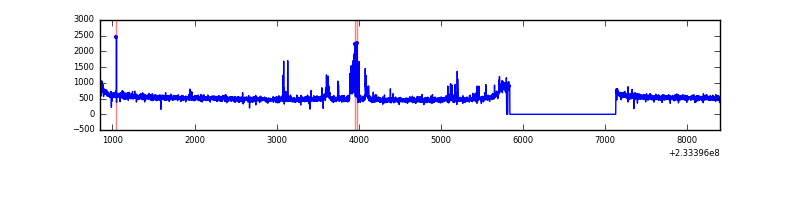 |
| C | 7549 | 6245 | 23 | 23 | 0.30% | 0.37% | 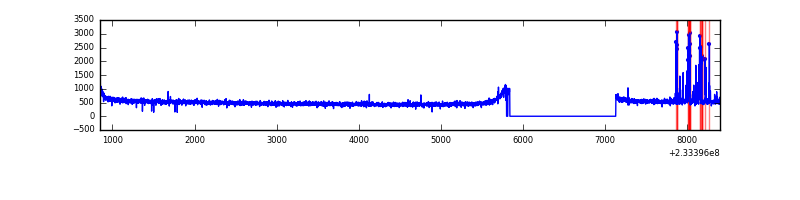 |
| D | 7549 | 6245 | 50 | 50 | 0.66% | 0.80% | 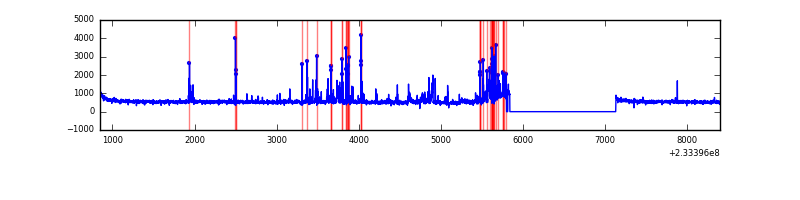 |
Top three noisy pixels from each quadrant. If the there are fewer than three noisy pixels in the level2.evt file, extra rows are filled as -1
| Pixel properties | Quadrant properties | ||||||
|---|---|---|---|---|---|---|---|
| Quadrant | DetID | PixID | Counts | Sigma | Mean | Median | Sigma |
| A | 8 | 5 | 454646 | 2791.75 | 810 | 796 | 162.6 |
| A | 5 | 16 | 423330 | 2599.12 | 810 | 796 | 162.6 |
| A | 13 | 164 | 10253 | 58.17 | 810 | 796 | 162.6 |
| B | 4 | 173 | 114158 | 738.96 | 819 | 800 | 153.4 |
| B | 0 | 214 | 20934 | 131.25 | 819 | 800 | 153.4 |
| B | 12 | 111 | 16004 | 99.11 | 819 | 800 | 153.4 |
| C | 4 | 254 | 137608 | 758.12 | 792 | 798 | 180.5 |
| C | 13 | 61 | 6020 | 28.94 | 792 | 798 | 180.5 |
| C | 12 | 4 | 2966 | 12.01 | 792 | 798 | 180.5 |
| D | 13 | 104 | 303204 | 1522.46 | 792 | 769 | 198.6 |
| D | 8 | 195 | 258239 | 1296.1 | 792 | 769 | 198.6 |
| D | 7 | 71 | 44455 | 219.92 | 792 | 769 | 198.6 |
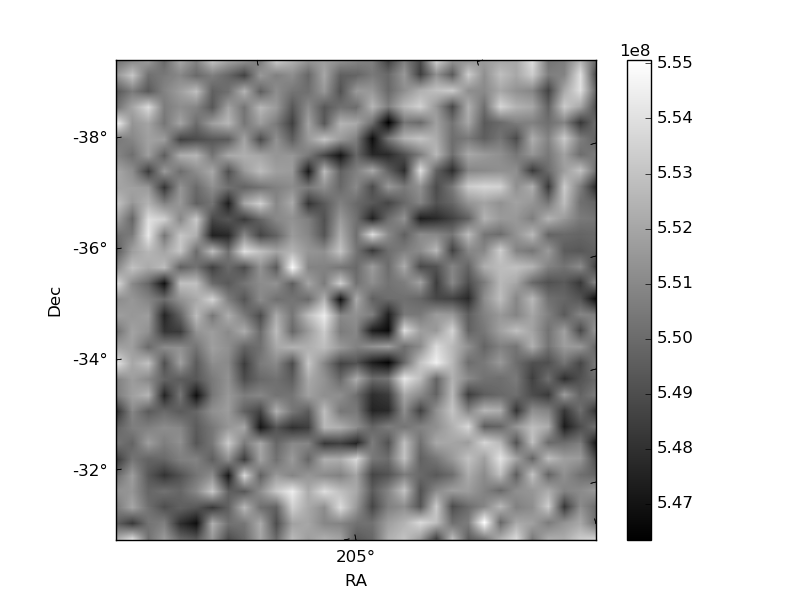
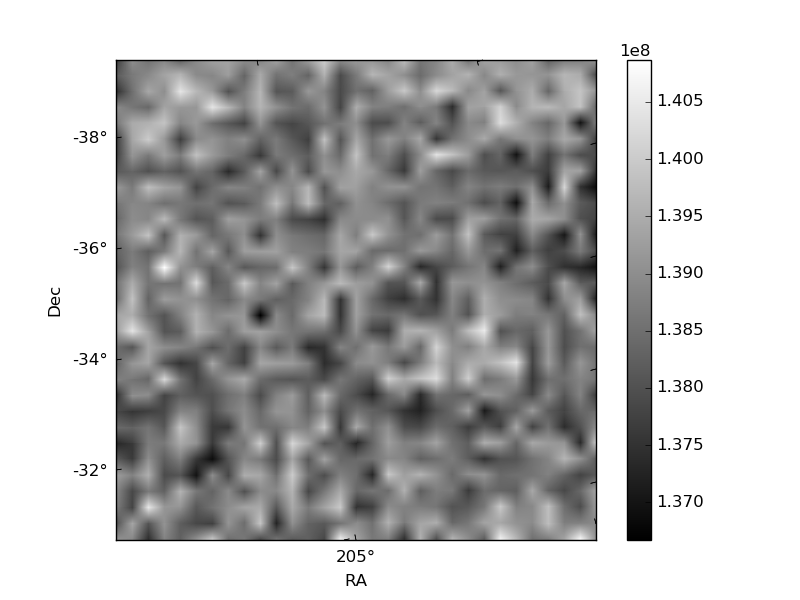
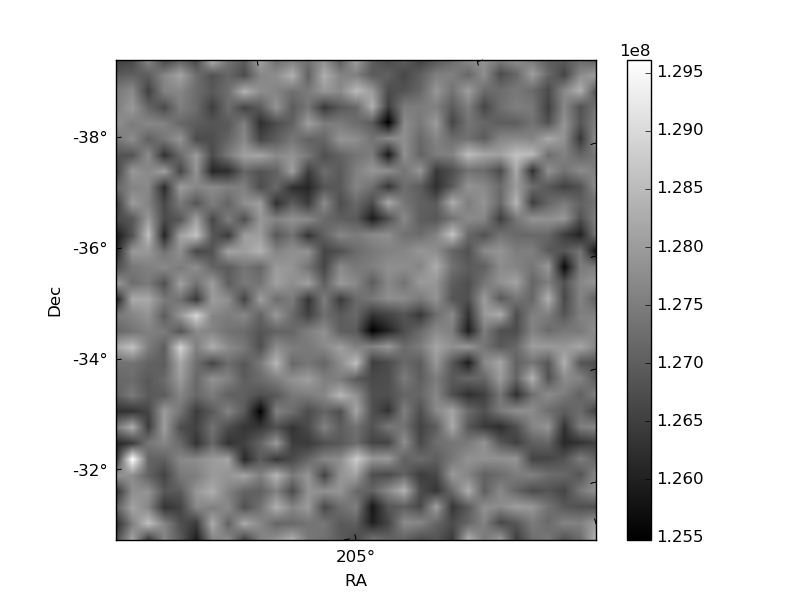
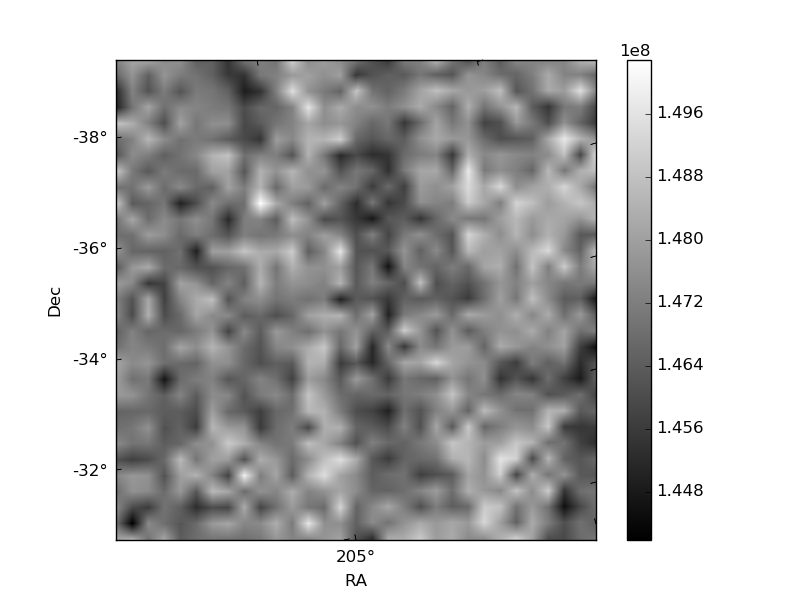
Histogram calculated using DETX and DETY for each event in the final _common_clean file
| Quadrant A | 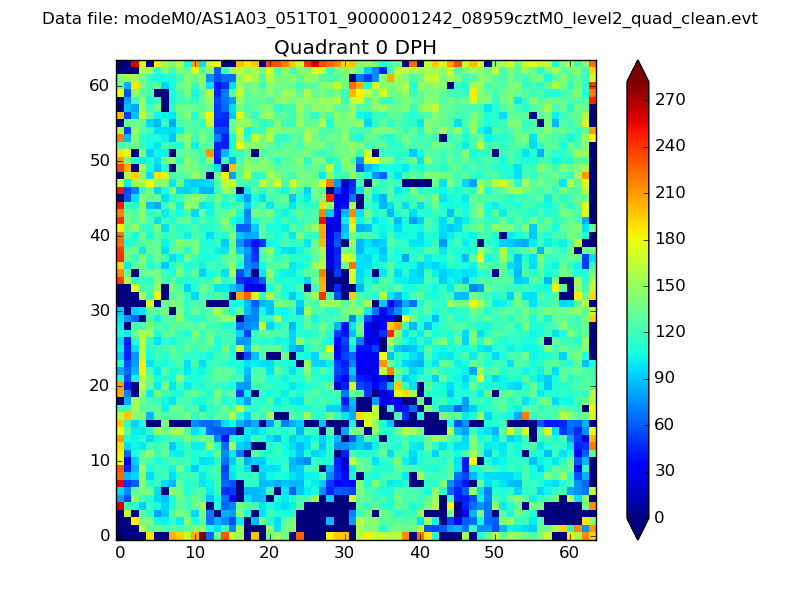 |
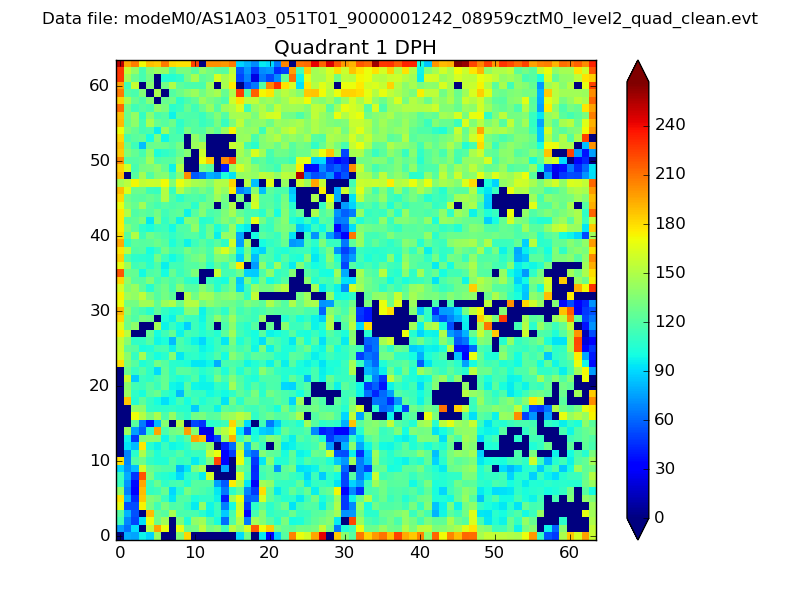 |
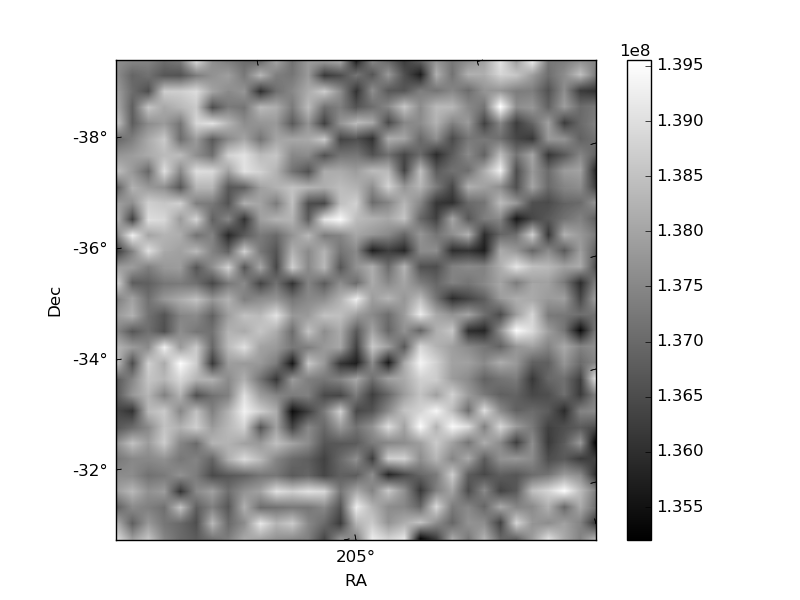
Quadrant B |
|---|---|---|---|
| Quadrant D | 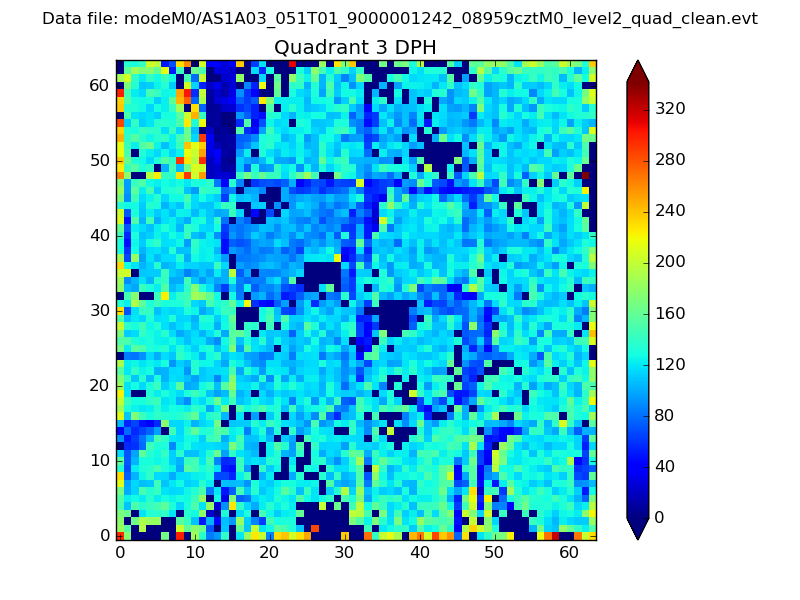 |
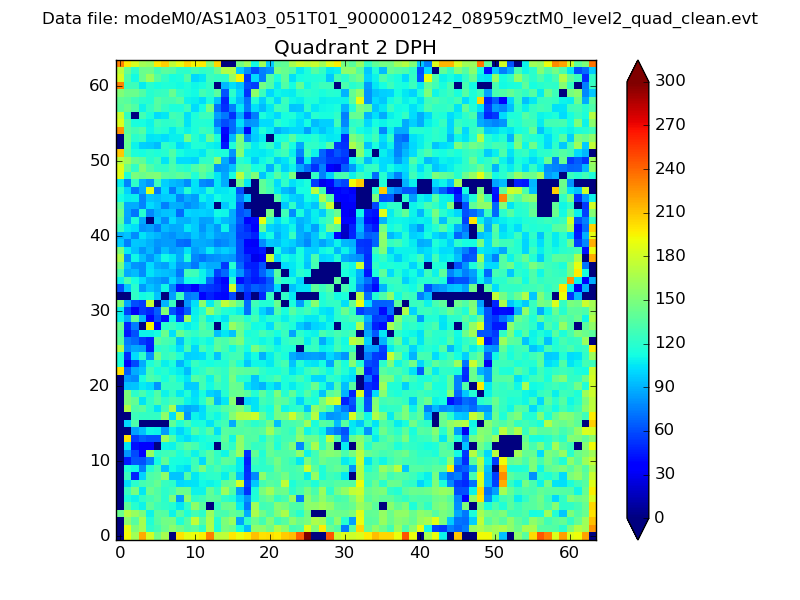 |
Quadrant C |
| Plot type | Count rate plots | Images |
|---|---|---|
| Comparison with Poisson distribution Blue bars denote a histogram of data divided into 1 sec bins. Red curve is a Poisson curve with rate = median count rate of data. |
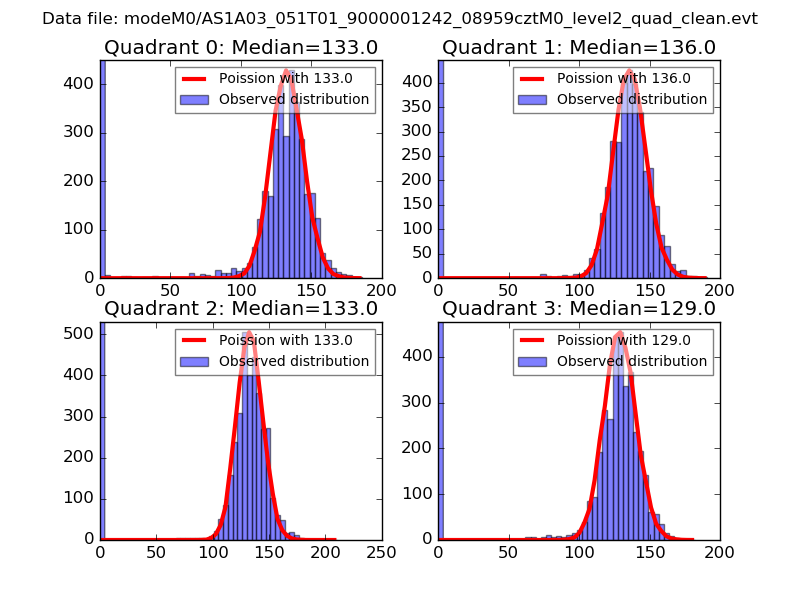 |
 |
| Quadrant-wise count rates Data is divided into 100 sec bins |
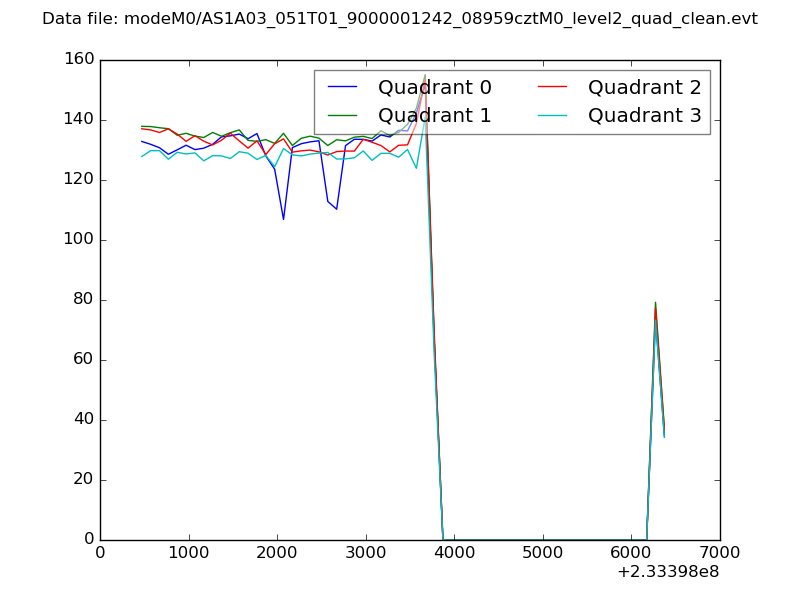 |
|
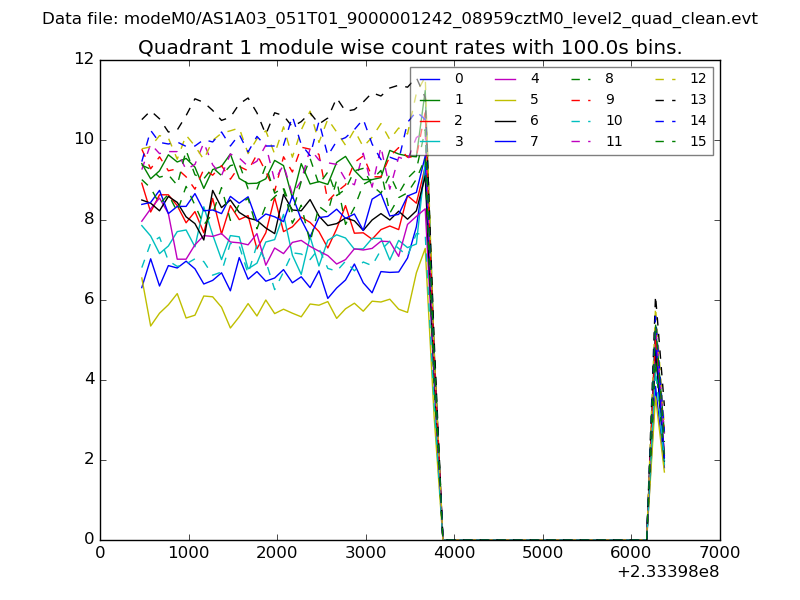
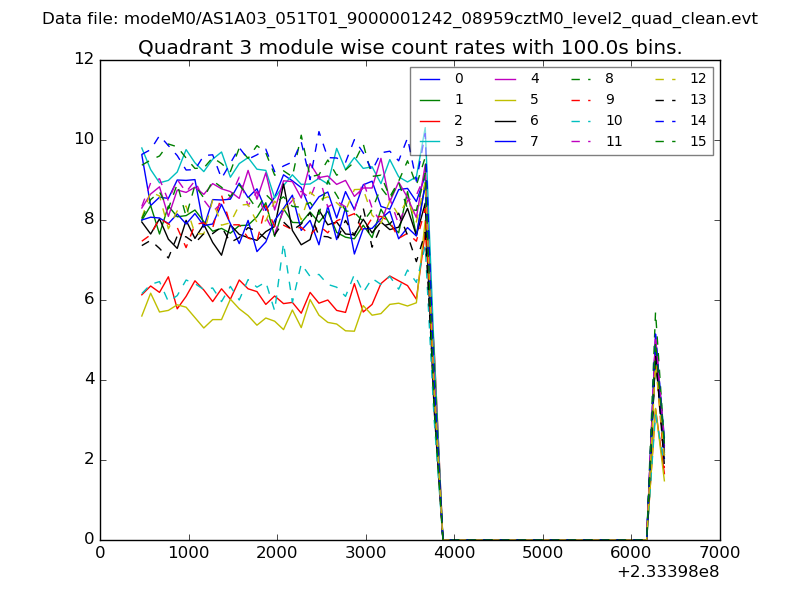
| Module-wise count rates for Quadrant A Data is divided into 100 sec bins |
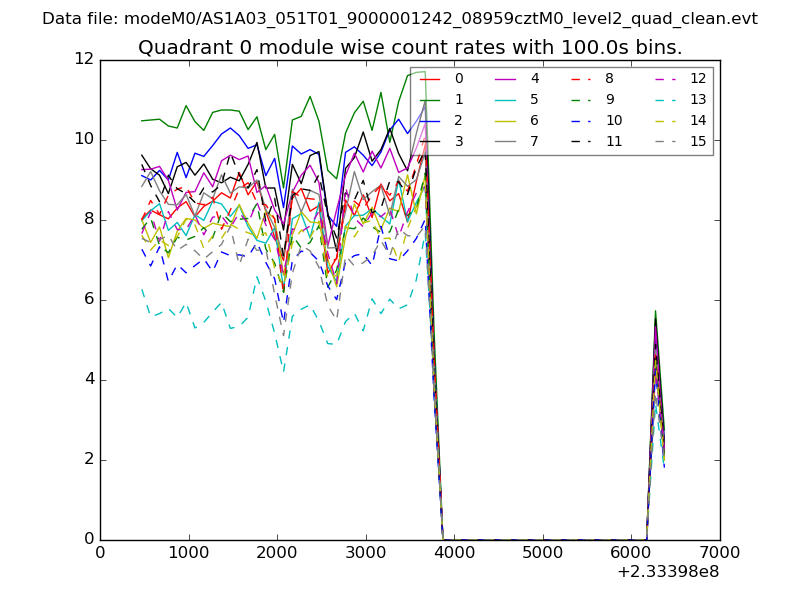 |
 |
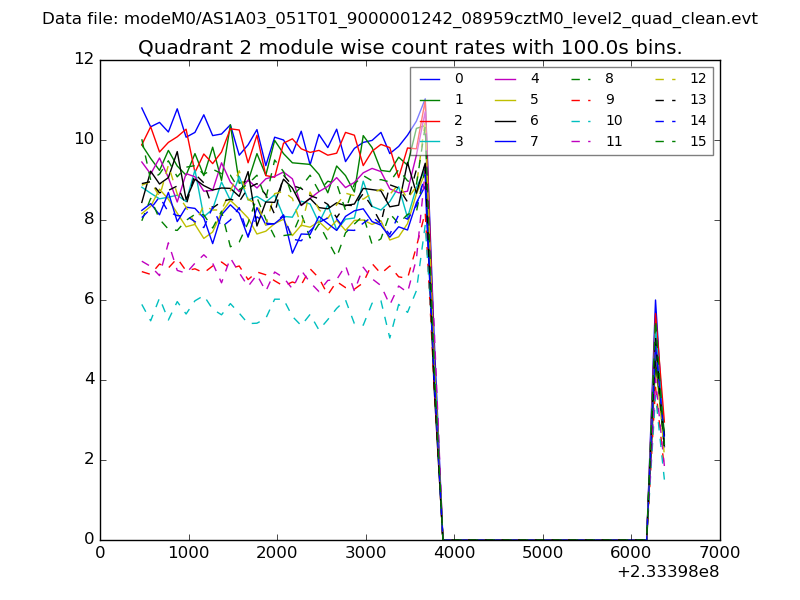
| Module-wise count rates for Quadrant B Data is divided into 100 sec bins |
 |
 |
| Module-wise count rates for Quadrant C Data is divided into 100 sec bins |
 |
 |
| Module-wise count rates for Quadrant D Data is divided into 100 sec bins |
 |
 |
| Parameter | Plot |
|---|---|
| CZT HV Monitor | 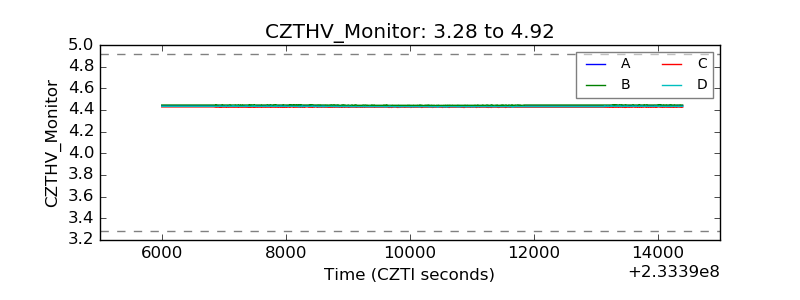 |
| D_VDD | 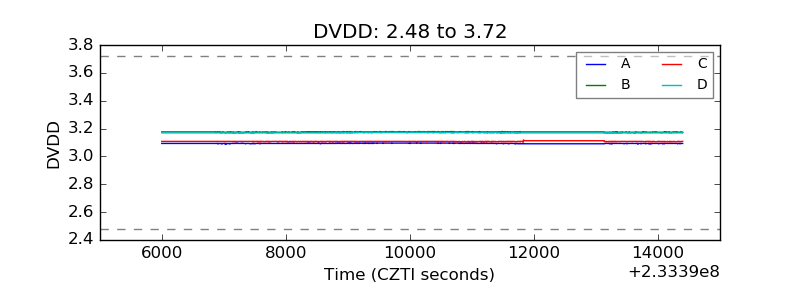 |
| Temperature 1 | 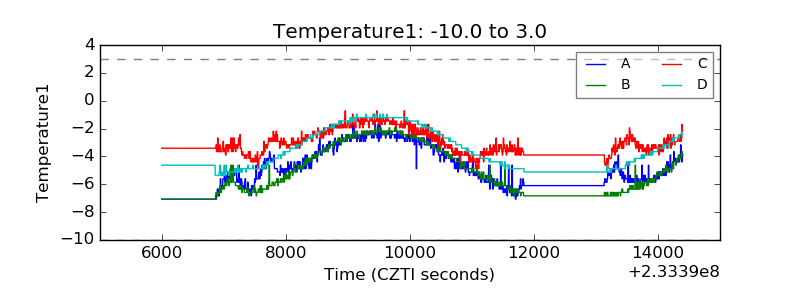 |
| Veto HV Monitor | 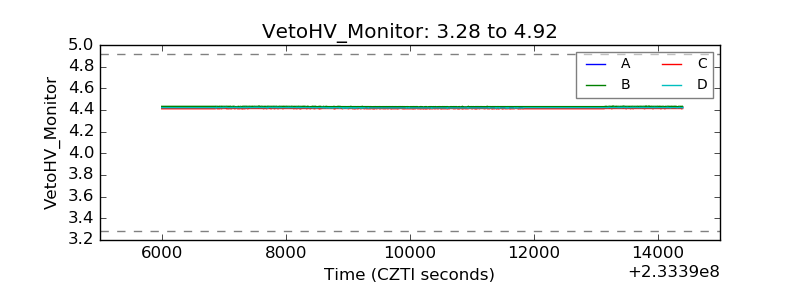 |
| Veto LLD | 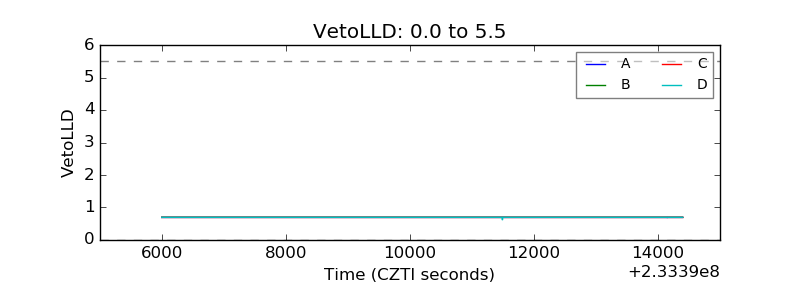 |
| Alpha Counter | 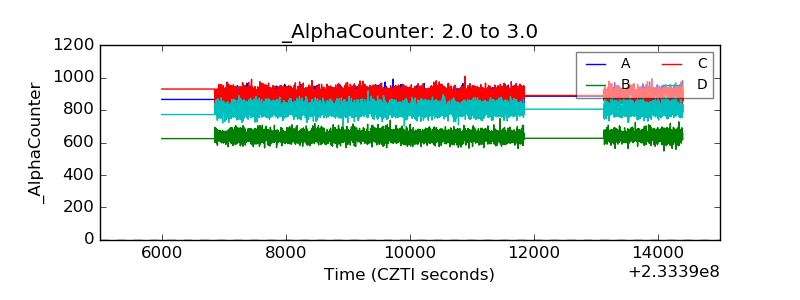 |
| _CPM_Rate | 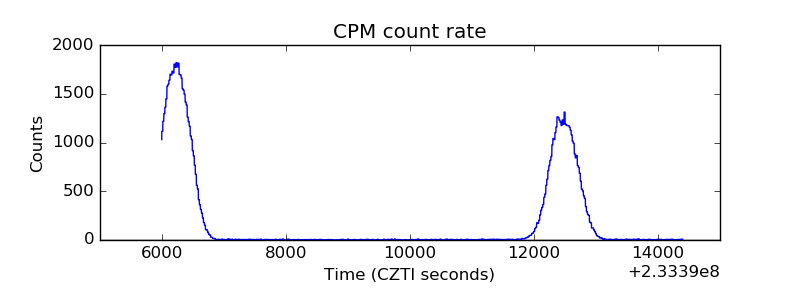 |
| CZT Counter | 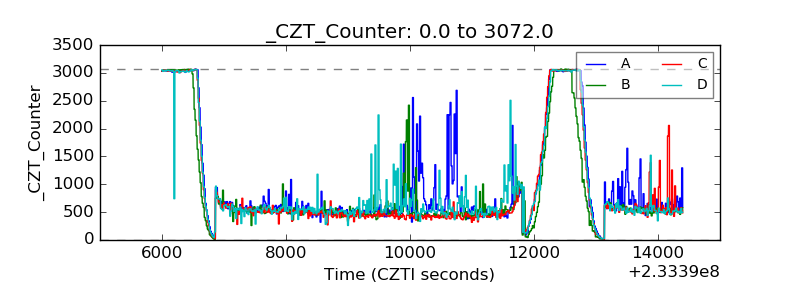 |
| +2.5 Volts monitor |  |
| +5 Volts monitor |  |
| _ROLL_ROT | 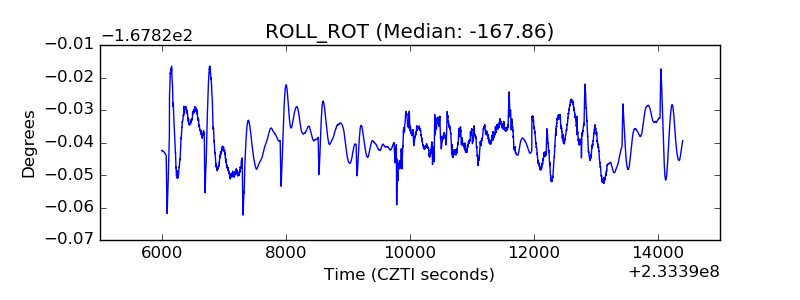 |
| _Roll_DEC | 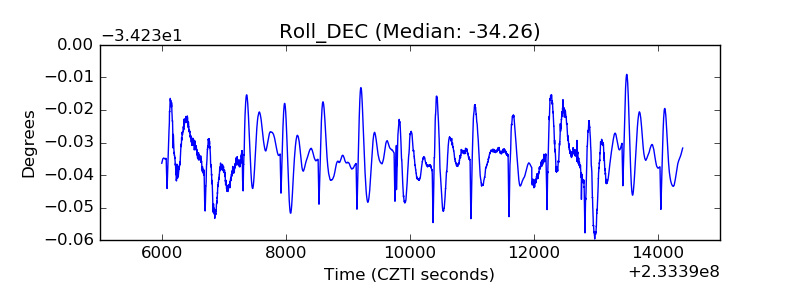 |
| _Roll_RA | 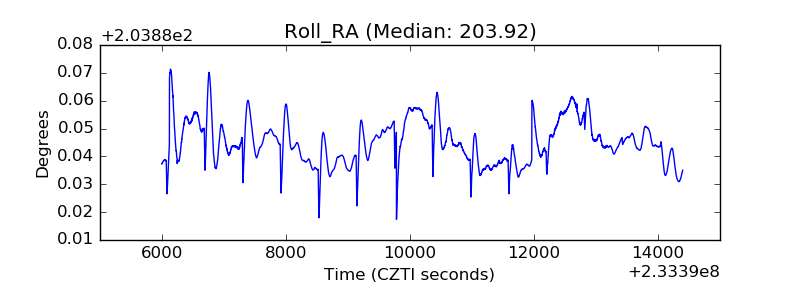 |
| Veto Counter | 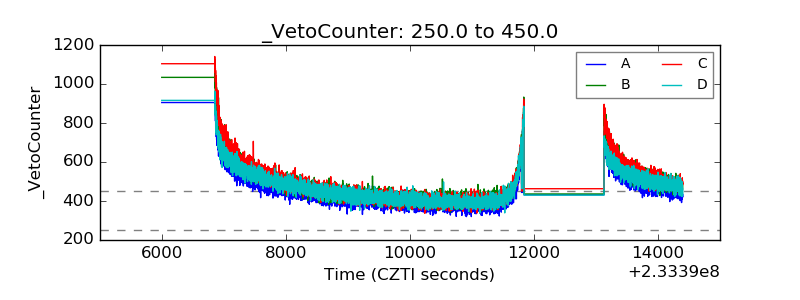 |