| Param | Original file | Final file |
|---|---|---|
| Filename | modeM0/AS1A03_051T01_9000001242_08961cztM0_level2.evt | modeM0/AS1A03_051T01_9000001242_08961cztM0_level2_quad_clean.evt |
| Size (bytes) | 485,507,520 | 91,229,760 |
| Size | 463.0 MB | 87.0 MB |
| Events in quadrant A | 3,554,485 | 589,227 |
| Events in quadrant B | 3,236,369 | 596,748 |
| Events in quadrant C | 3,672,258 | 567,244 |
| Events in quadrant D | 3,806,980 | 564,325 |
| Mode M9 | |||
|---|---|---|---|
| Quadrant | BADHDUFLAG | Total packets | Discarded packets |
| A | 0 | 21 | 0 |
| B | 0 | 21 | 0 |
| C | 0 | 21 | 0 |
| D | 0 | 22 | 1 |
| Mode M0 | |||
|---|---|---|---|
| Quadrant | BADHDUFLAG | Total packets | Discarded packets |
| A | 0 | 14685 | 213 |
| B | 0 | 13734 | 221 |
| C | 0 | 15398 | 220 |
| D | 0 | 15415 | 238 |
| Mode SS | |||
|---|---|---|---|
| Quadrant | BADHDUFLAG | Total packets | Discarded packets |
| A | 0 | 132 | 2 |
| B | 0 | 132 | 0 |
| C | 0 | 132 | 4 |
| D | 0 | 132 | 0 |
| Quadrant | Total seconds | Saturated seconds | Saturation percentage |
|---|---|---|---|
| A | 6387 | 127 | 1.988414% |
| B | 6371 | 86 | 1.349867% |
| C | 6384 | 259 | 4.057018% |
| D | 6369 | 191 | 2.998901% |
Noise dominated data is calculated using 1-second bins in cleaned event files. If a bin has >2000 counts, and if more than 50% of those come from <1% of pixels, then it is considered to be noise-dominated and hence unusable.
| Quadrant | # 1 sec bins | Bins with >0 counts | Bins with >2000 counts | High rate bins dominated by noise | Noise dominated (total time) | Noise dominated (detector-on time) | Marked lightcurve |
|---|---|---|---|---|---|---|---|
| A | 7564 | 6468 | 55 | 55 | 0.73% | 0.85% | 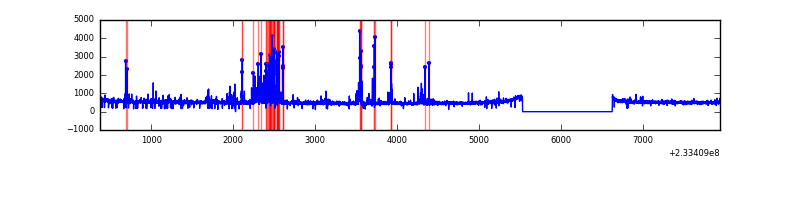 |
| B | 7564 | 6465 | 9 | 9 | 0.12% | 0.14% | 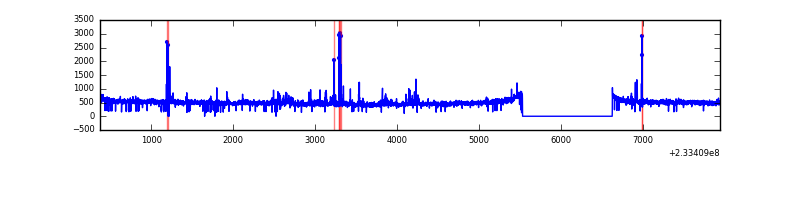 |
| C | 7564 | 6463 | 168 | 168 | 2.22% | 2.60% | 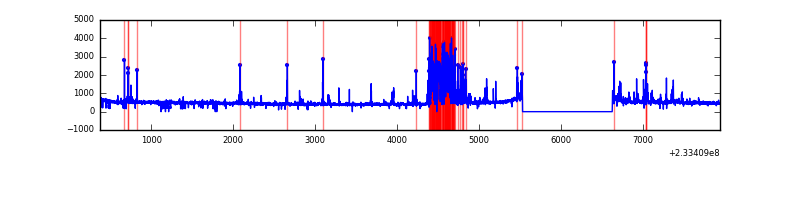 |
| D | 7564 | 6465 | 72 | 72 | 0.95% | 1.11% | 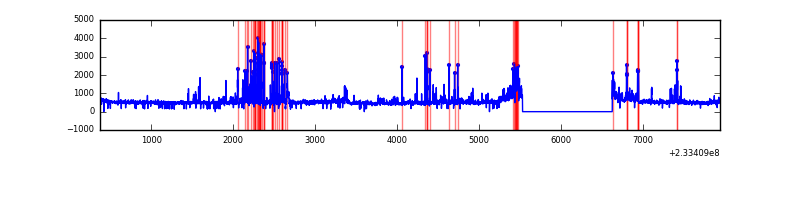 |
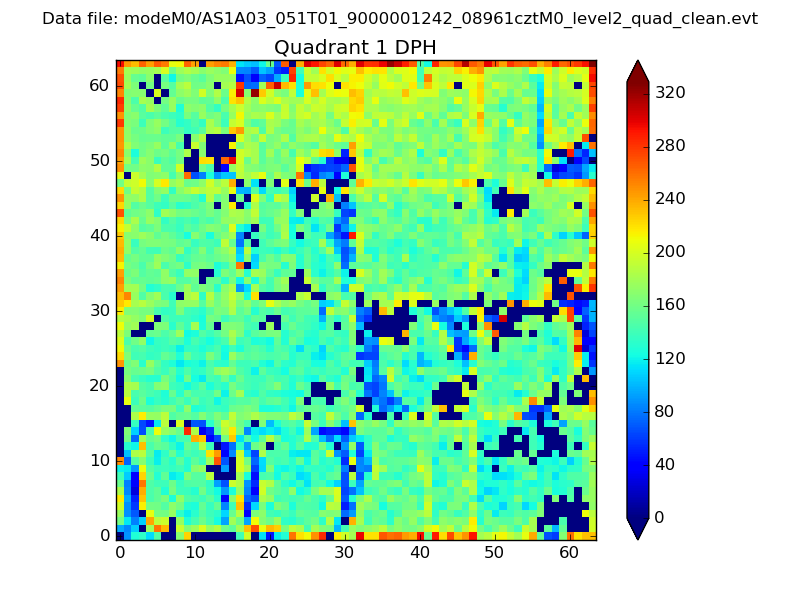
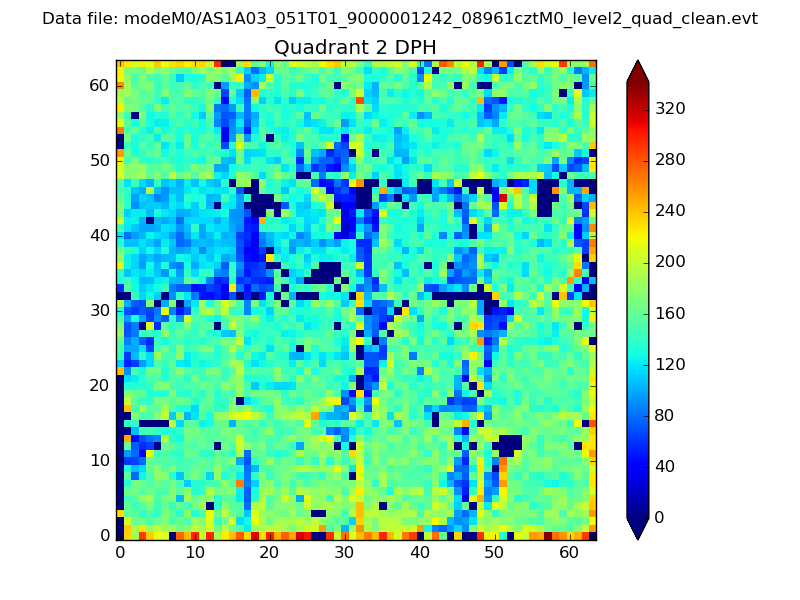
Top three noisy pixels from each quadrant. If the there are fewer than three noisy pixels in the level2.evt file, extra rows are filled as -1
| Pixel properties | Quadrant properties | ||||||
|---|---|---|---|---|---|---|---|
| Quadrant | DetID | PixID | Counts | Sigma | Mean | Median | Sigma |
| A | 5 | 16 | 259422 | 1618.51 | 788 | 771 | 159.8 |
| A | 8 | 5 | 241002 | 1503.25 | 788 | 771 | 159.8 |
| A | 13 | 14 | 9697 | 55.85 | 788 | 771 | 159.8 |
| B | 6 | 51 | 68962 | 453.61 | 787 | 769 | 150.3 |
| B | 5 | 255 | 27652 | 178.82 | 787 | 769 | 150.3 |
| B | 0 | 214 | 21168 | 135.69 | 787 | 769 | 150.3 |
| C | 4 | 254 | 747525 | 4348.02 | 748 | 750 | 171.8 |
| C | 13 | 61 | 5717 | 28.92 | 748 | 750 | 171.8 |
| C | 4 | 253 | 4976 | 24.61 | 748 | 750 | 171.8 |
| D | 7 | 9 | 287725 | 1454.99 | 756 | 736 | 197.2 |
| D | 13 | 104 | 244960 | 1238.18 | 756 | 736 | 197.2 |
| D | 8 | 195 | 184163 | 929.95 | 756 | 736 | 197.2 |
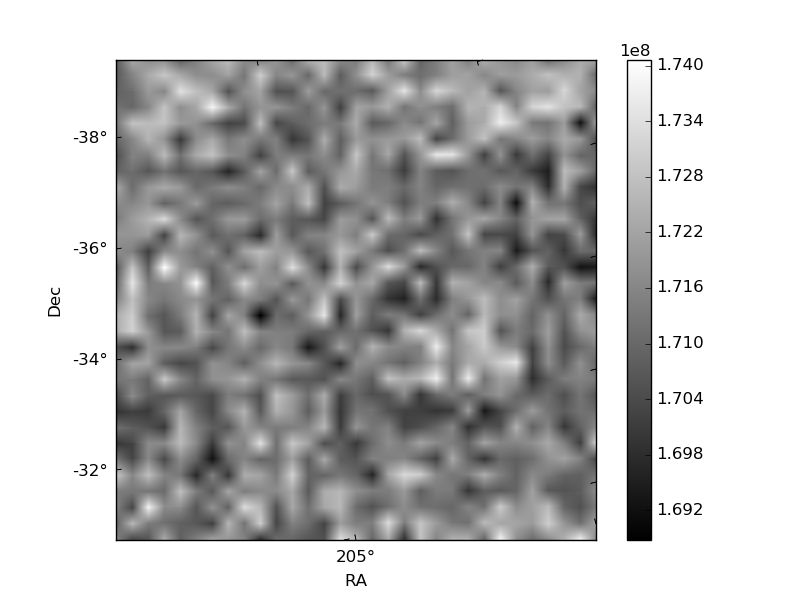
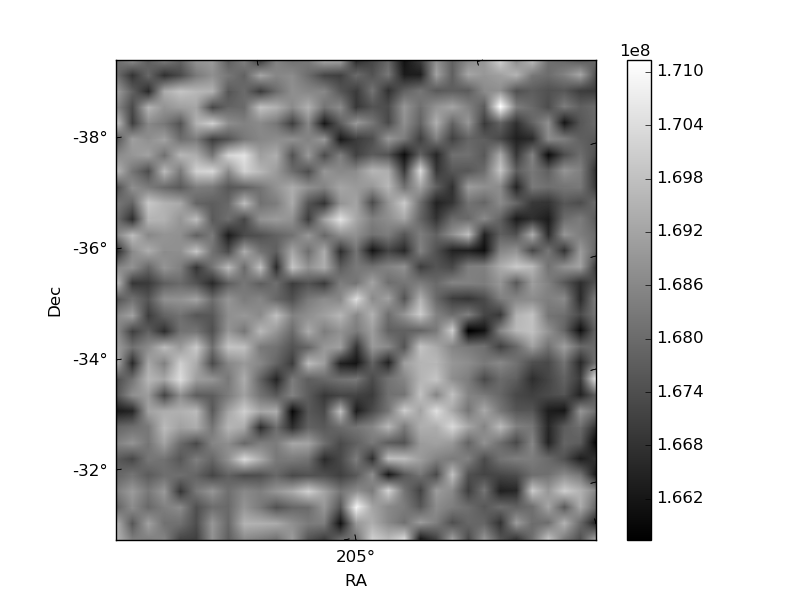
Histogram calculated using DETX and DETY for each event in the final _common_clean file
| Quadrant A | 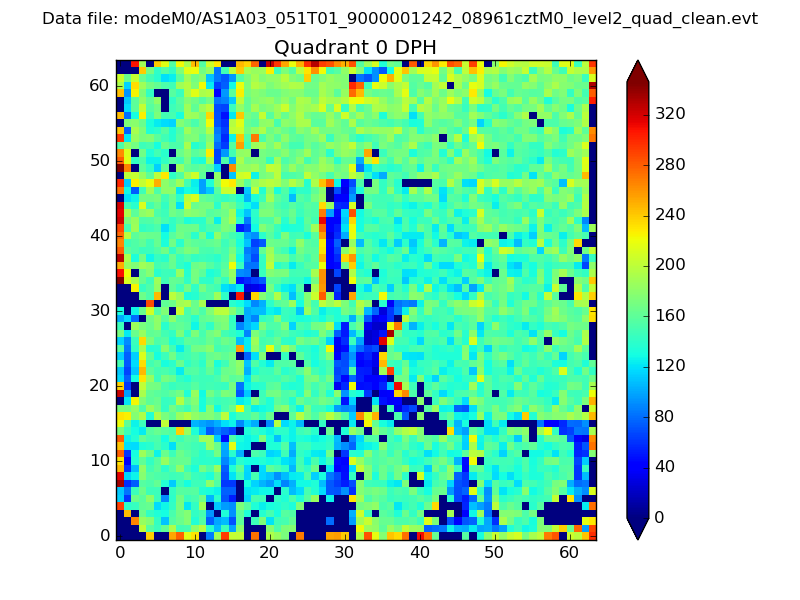 |
 |
Quadrant B |
|---|---|---|---|
| Quadrant D | 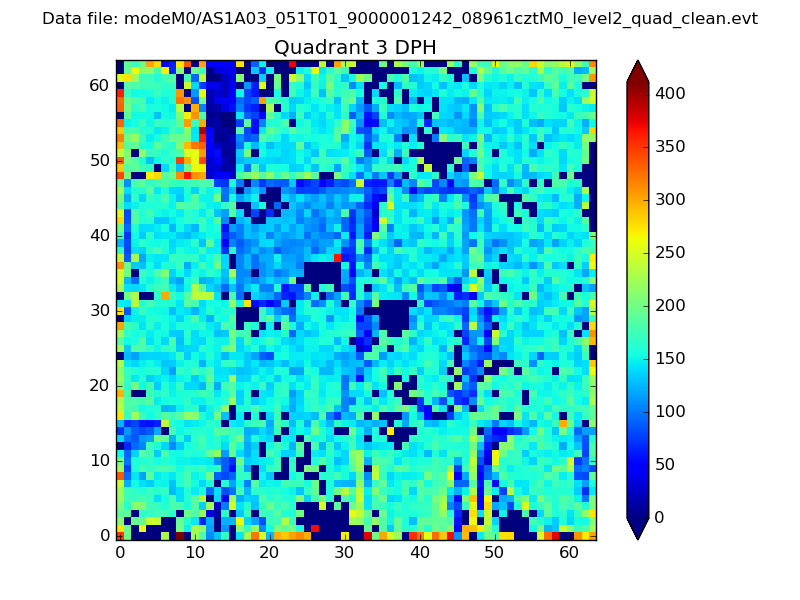 |
 |
Quadrant C |
| Plot type | Count rate plots | Images |
|---|---|---|
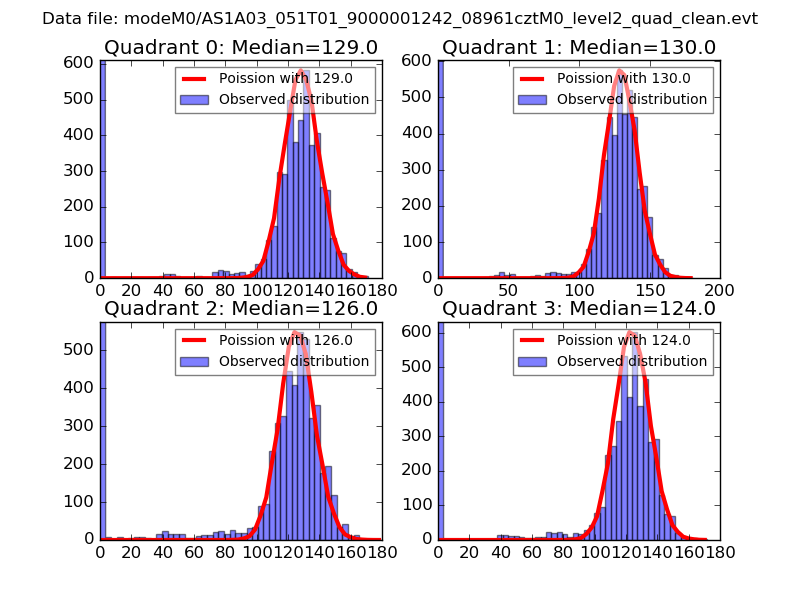
| Comparison with Poisson distribution Blue bars denote a histogram of data divided into 1 sec bins. Red curve is a Poisson curve with rate = median count rate of data. |
 |
 |
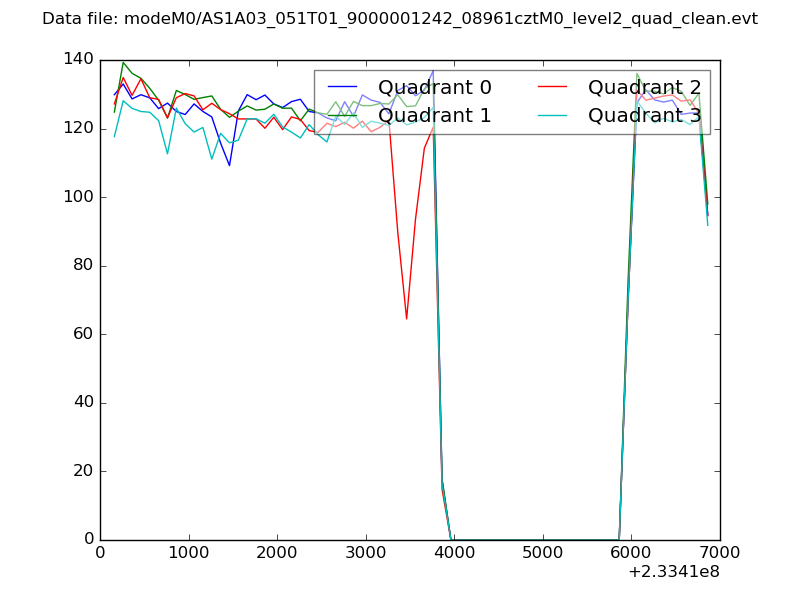
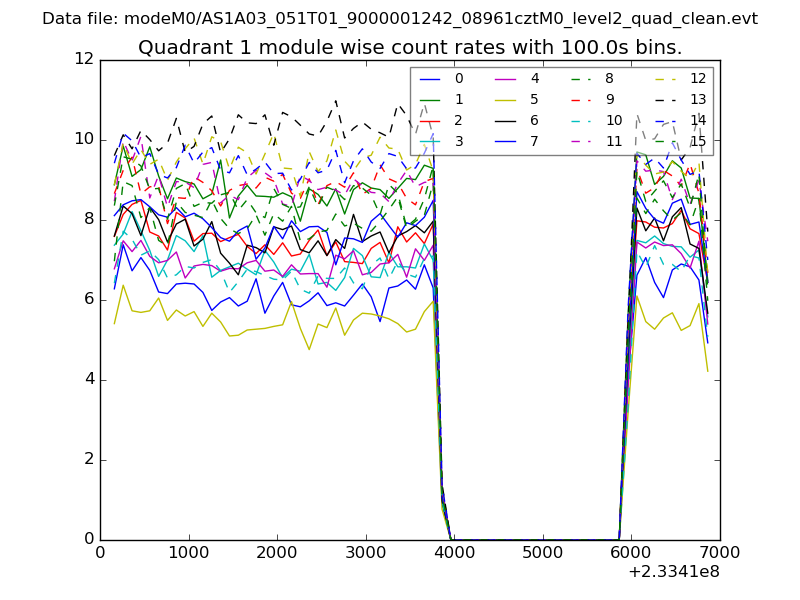
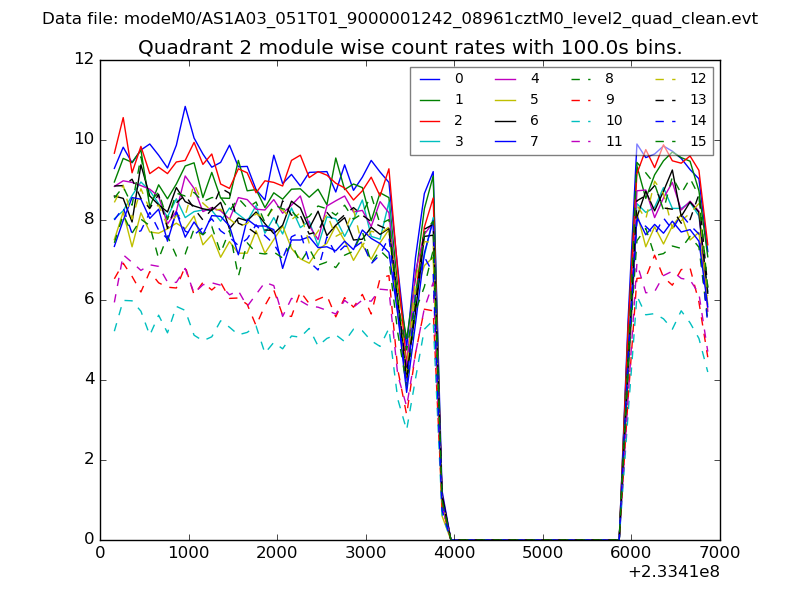
| Quadrant-wise count rates Data is divided into 100 sec bins |
 |
|
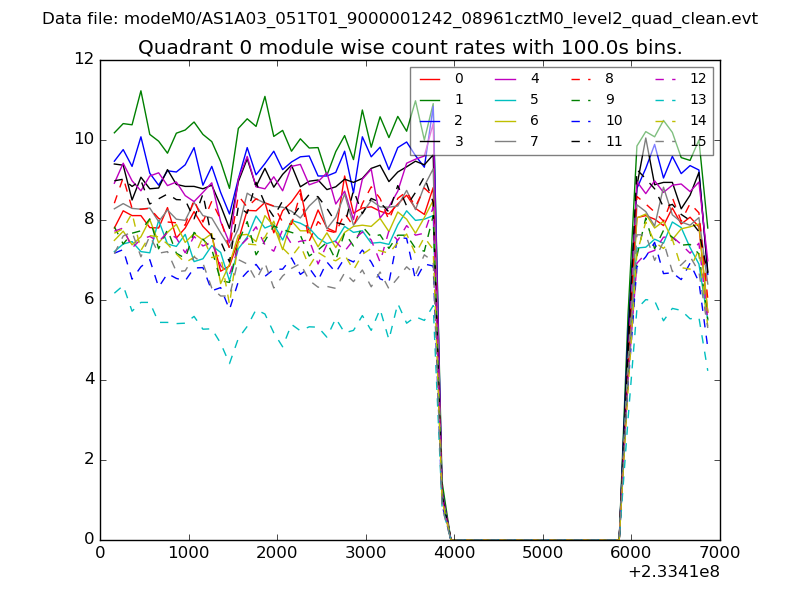
| Module-wise count rates for Quadrant A Data is divided into 100 sec bins |
 |
 |
| Module-wise count rates for Quadrant B Data is divided into 100 sec bins |
 |
 |
| Module-wise count rates for Quadrant C Data is divided into 100 sec bins |
 |
 |
| Module-wise count rates for Quadrant D Data is divided into 100 sec bins |
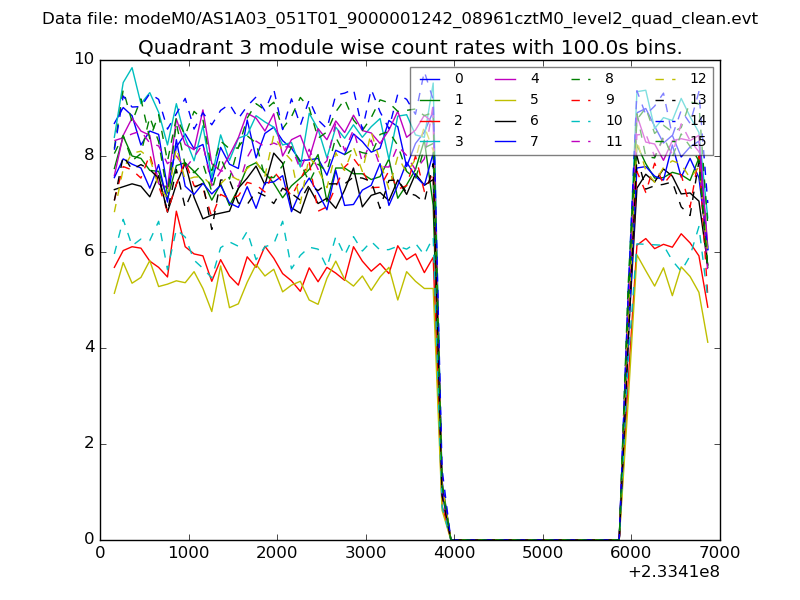 |
 |
| Parameter | Plot |
|---|---|
| CZT HV Monitor | 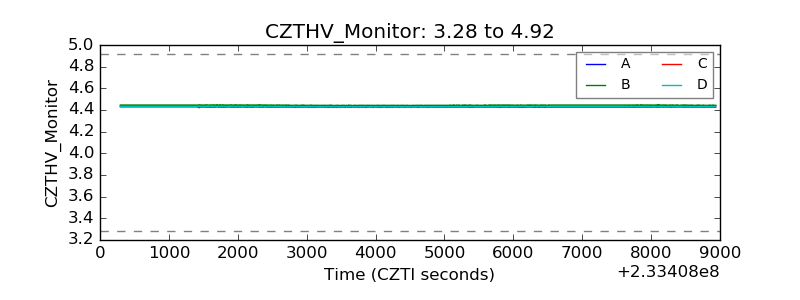 |
| D_VDD | 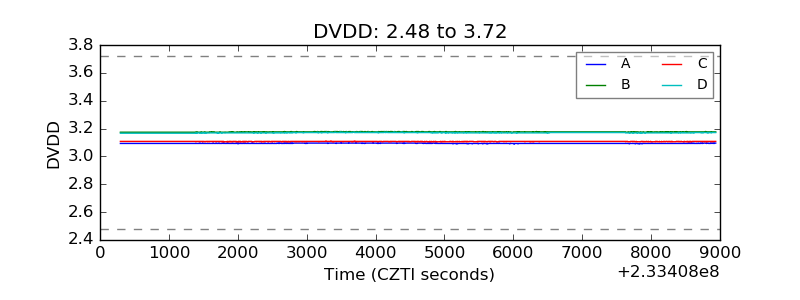 |
| Temperature 1 |  |
| Veto HV Monitor | 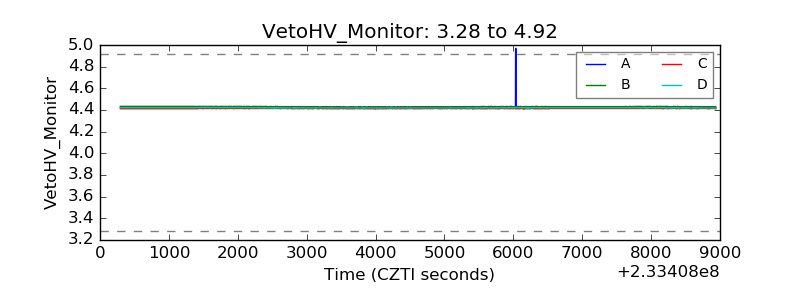 |
| Veto LLD | 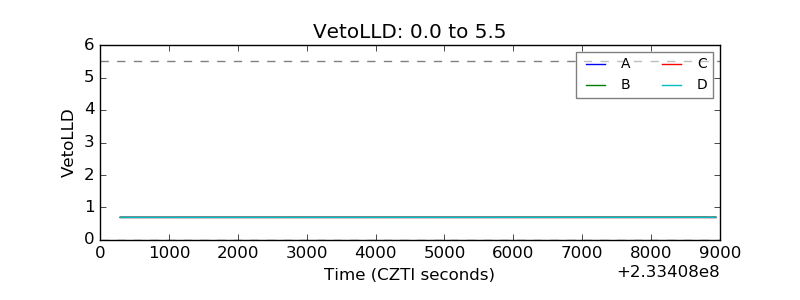 |
| Alpha Counter | 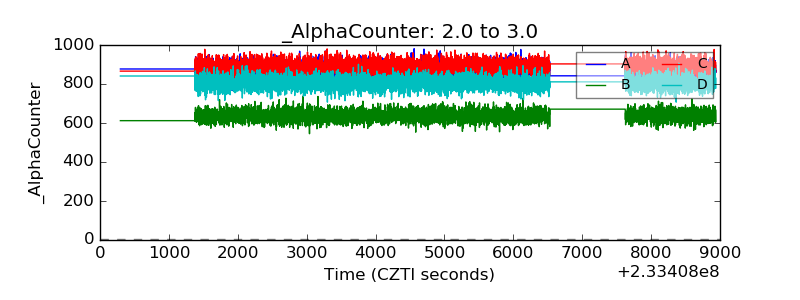 |
| _CPM_Rate | 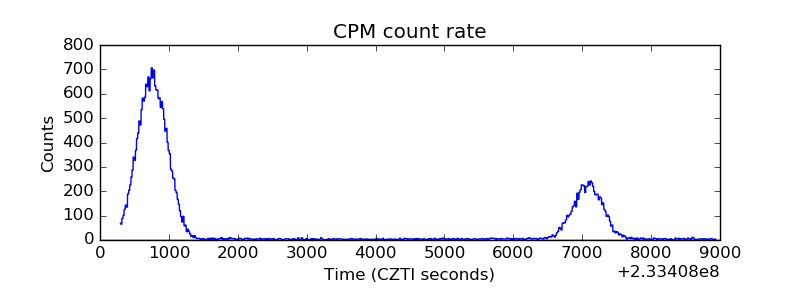 |
| CZT Counter | 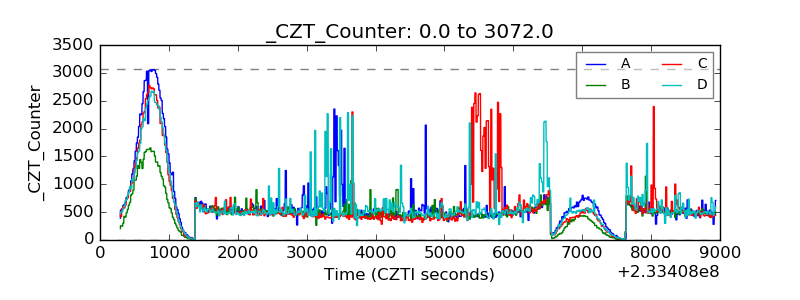 |
| +2.5 Volts monitor |  |
| +5 Volts monitor |  |
| _ROLL_ROT | 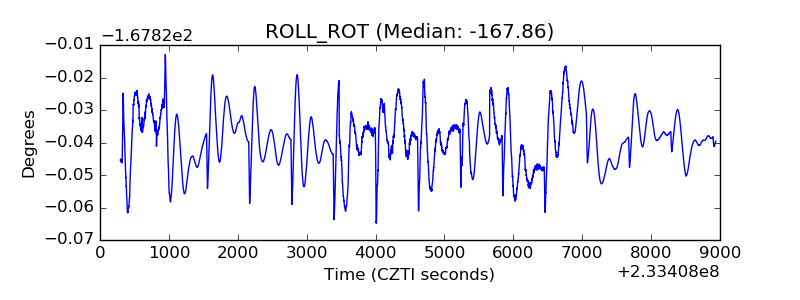 |
| _Roll_DEC | 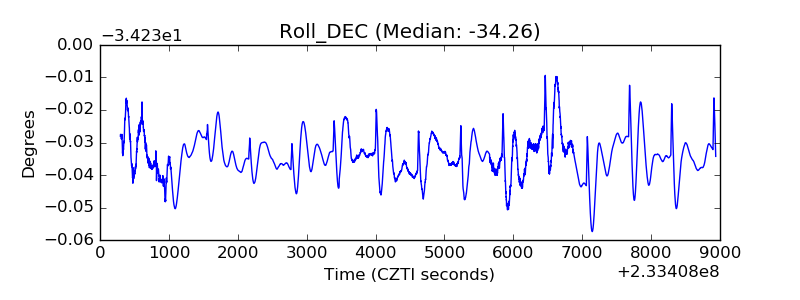 |
| _Roll_RA | 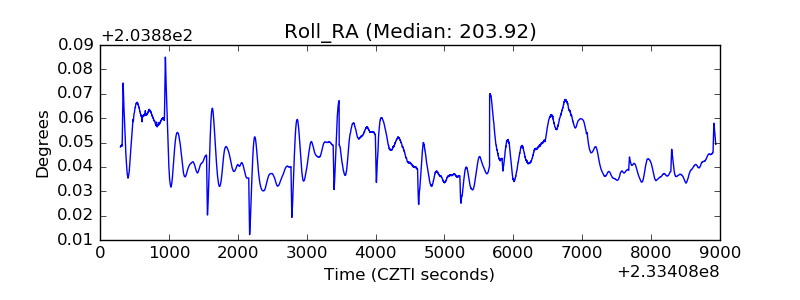 |
| Veto Counter | 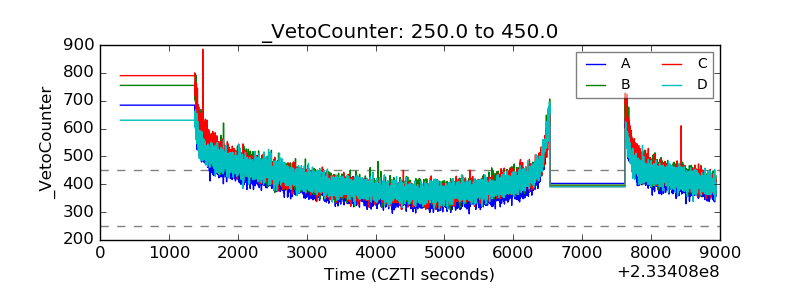 |