| Param | Original file | Final file |
|---|---|---|
| Filename | modeM0/AS1A03_051T01_9000001242_08962cztM0_level2.evt | modeM0/AS1A03_051T01_9000001242_08962cztM0_level2_quad_clean.evt |
| Size (bytes) | 514,846,080 | 92,848,320 |
| Size | 491.0 MB | 88.5 MB |
| Events in quadrant A | 3,409,190 | 607,076 |
| Events in quadrant B | 3,105,576 | 613,245 |
| Events in quadrant C | 4,830,601 | 578,942 |
| Events in quadrant D | 3,817,499 | 571,519 |
| Mode M9 | |||
|---|---|---|---|
| Quadrant | BADHDUFLAG | Total packets | Discarded packets |
| A | 0 | 6 | 0 |
| B | 0 | 6 | 0 |
| C | 0 | 6 | 0 |
| D | 0 | 6 | 0 |
| Mode M0 | |||
|---|---|---|---|
| Quadrant | BADHDUFLAG | Total packets | Discarded packets |
| A | 0 | 14456 | 271 |
| B | 0 | 13467 | 234 |
| C | 0 | 19245 | 500 |
| D | 0 | 15774 | 400 |
| Mode SS | |||
|---|---|---|---|
| Quadrant | BADHDUFLAG | Total packets | Discarded packets |
| A | 0 | 132 | 2 |
| B | 0 | 132 | 0 |
| C | 0 | 132 | 2 |
| D | 0 | 132 | 2 |
| Quadrant | Total seconds | Saturated seconds | Saturation percentage |
|---|---|---|---|
| A | 6316 | 150 | 2.374921% |
| B | 6327 | 138 | 2.181128% |
| C | 6288 | 821 | 13.056616% |
| D | 6306 | 253 | 4.012052% |
Noise dominated data is calculated using 1-second bins in cleaned event files. If a bin has >2000 counts, and if more than 50% of those come from <1% of pixels, then it is considered to be noise-dominated and hence unusable.
| Quadrant | # 1 sec bins | Bins with >0 counts | Bins with >2000 counts | High rate bins dominated by noise | Noise dominated (total time) | Noise dominated (detector-on time) | Marked lightcurve |
|---|---|---|---|---|---|---|---|
| A | 7114 | 6435 | 26 | 26 | 0.37% | 0.40% | 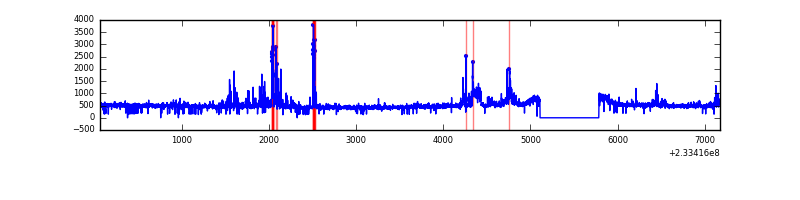 |
| B | 7114 | 6434 | 2 | 2 | 0.03% | 0.03% | 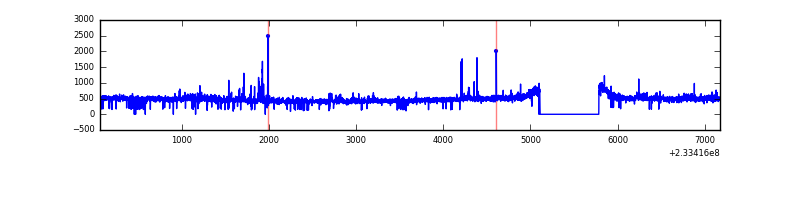 |
| C | 7114 | 6421 | 458 | 458 | 6.44% | 7.13% | 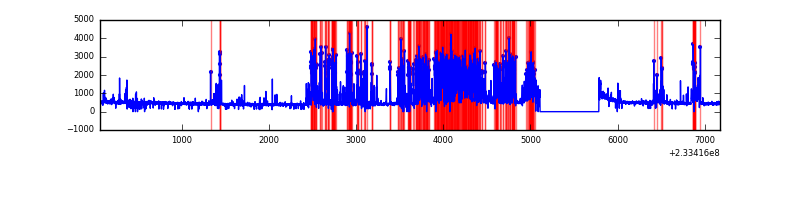 |
| D | 7114 | 6425 | 119 | 119 | 1.67% | 1.85% | 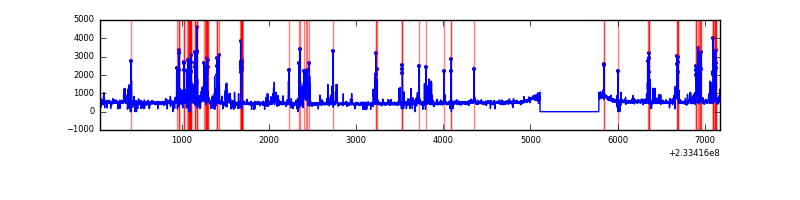 |
Top three noisy pixels from each quadrant. If the there are fewer than three noisy pixels in the level2.evt file, extra rows are filled as -1
| Pixel properties | Quadrant properties | ||||||
|---|---|---|---|---|---|---|---|
| Quadrant | DetID | PixID | Counts | Sigma | Mean | Median | Sigma |
| A | 5 | 16 | 179907 | 1153.3 | 761 | 745 | 155.3 |
| A | 8 | 5 | 170219 | 1090.94 | 761 | 745 | 155.3 |
| A | 15 | 174 | 129958 | 831.77 | 761 | 745 | 155.3 |
| B | 6 | 51 | 45004 | 302.62 | 762 | 742 | 146.3 |
| B | 0 | 214 | 37784 | 253.26 | 762 | 742 | 146.3 |
| B | 12 | 111 | 15309 | 99.59 | 762 | 742 | 146.3 |
| C | 4 | 254 | 2117034 | 13353.72 | 685 | 688 | 158.5 |
| C | 14 | 234 | 20026 | 122.02 | 685 | 688 | 158.5 |
| C | 4 | 238 | 19024 | 115.7 | 685 | 688 | 158.5 |
| D | 13 | 104 | 439508 | 2242.83 | 724 | 708 | 195.6 |
| D | 1 | 52 | 219579 | 1118.71 | 724 | 708 | 195.6 |
| D | 8 | 195 | 214908 | 1094.84 | 724 | 708 | 195.6 |
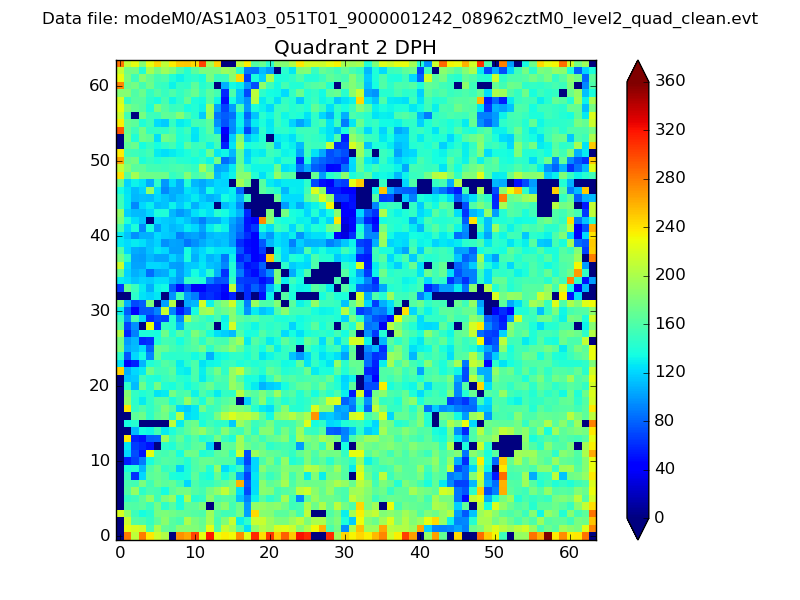
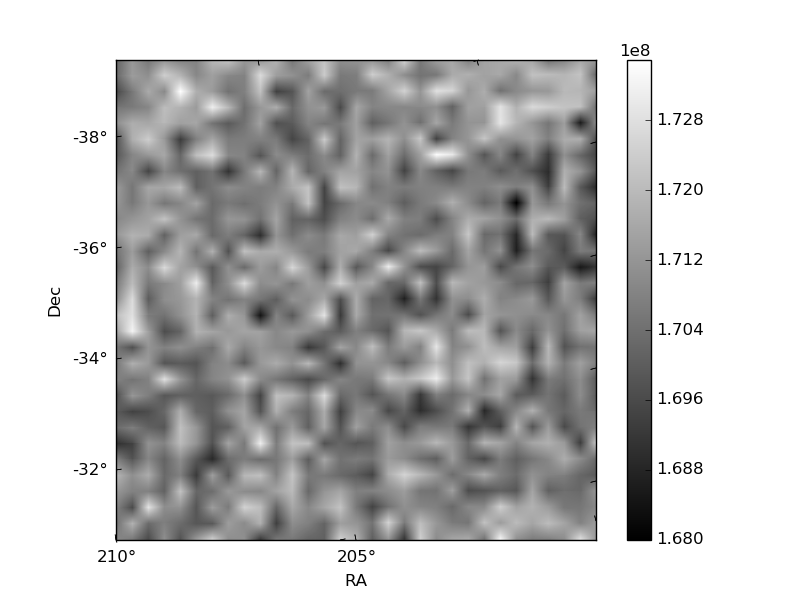
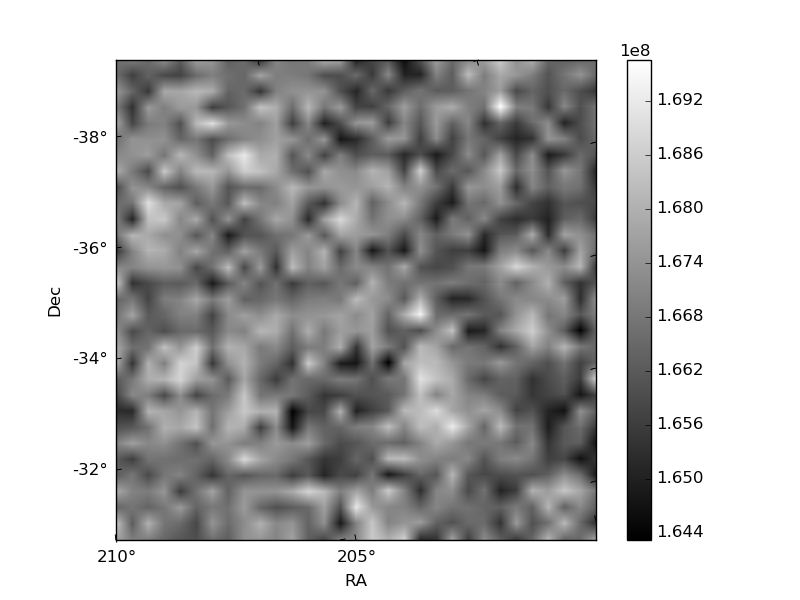
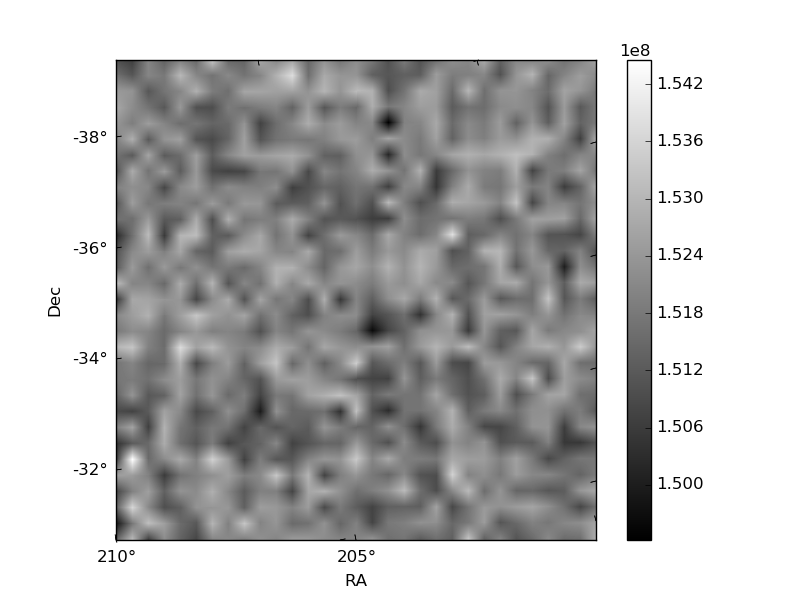
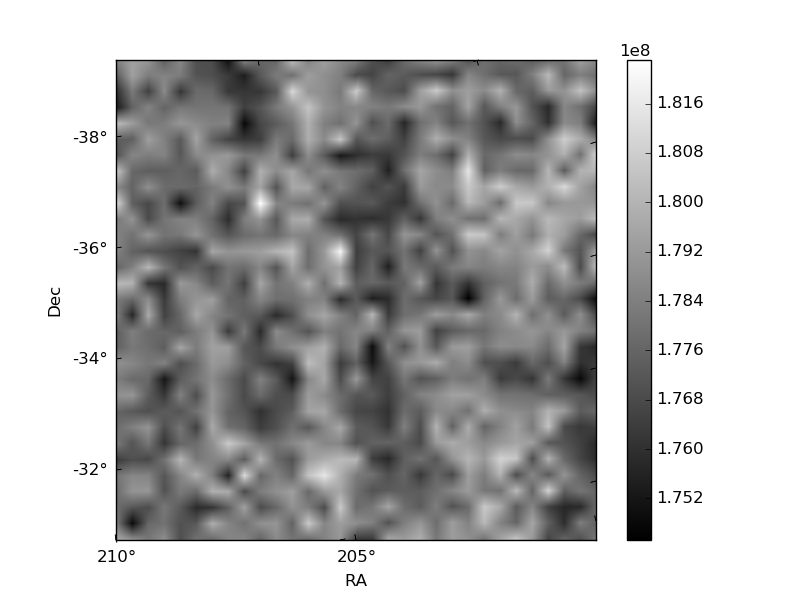
Histogram calculated using DETX and DETY for each event in the final _common_clean file
| Quadrant A | 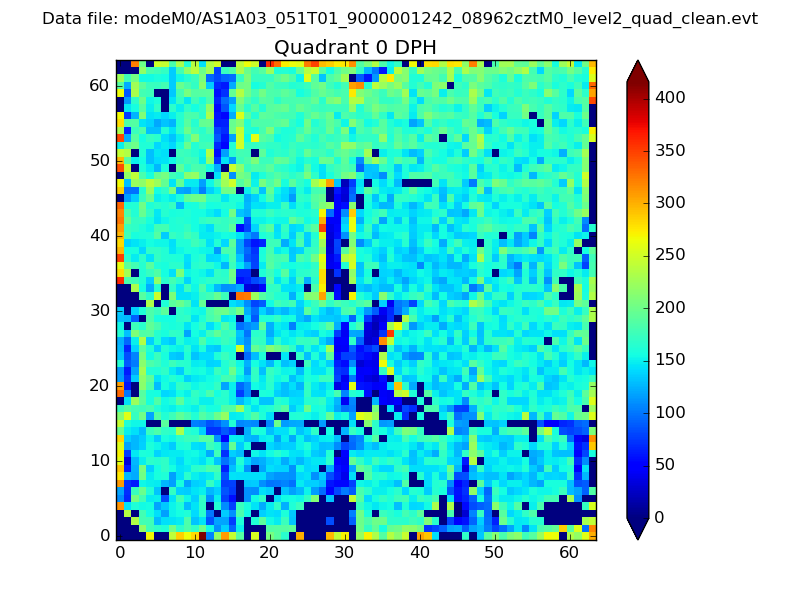 |
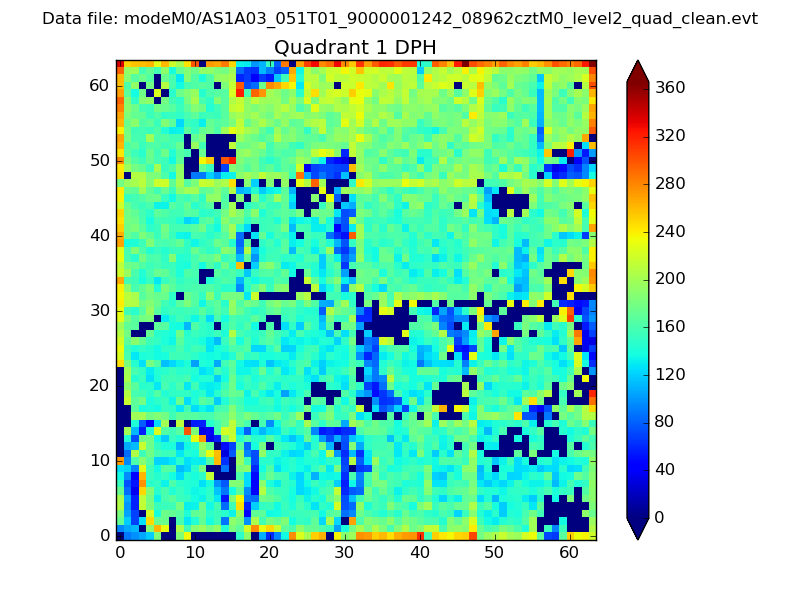 |
Quadrant B |
|---|---|---|---|
| Quadrant D | 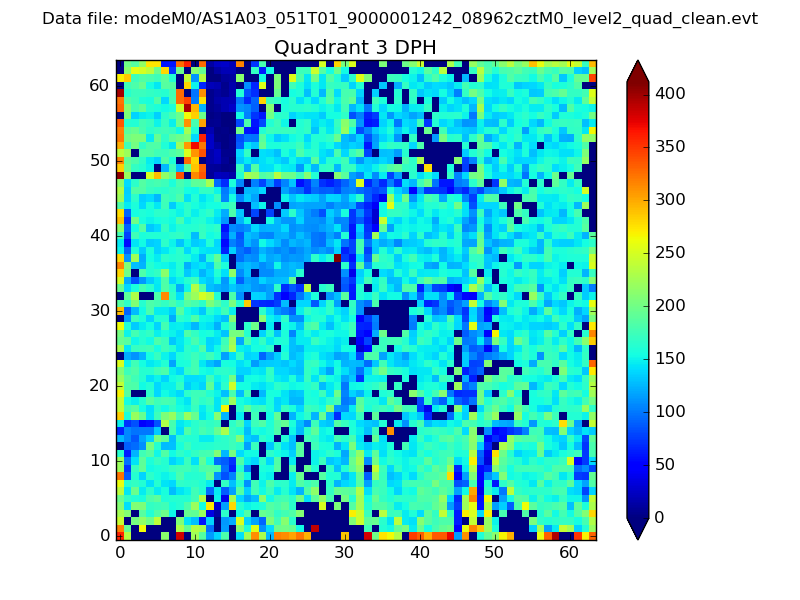 |
 |
Quadrant C |
| Plot type | Count rate plots | Images |
|---|---|---|
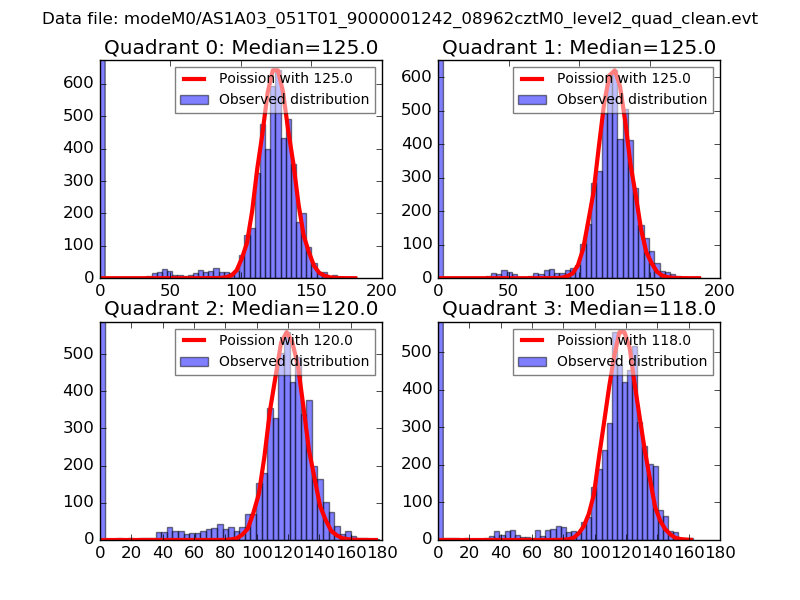
| Comparison with Poisson distribution Blue bars denote a histogram of data divided into 1 sec bins. Red curve is a Poisson curve with rate = median count rate of data. |
 |
 |
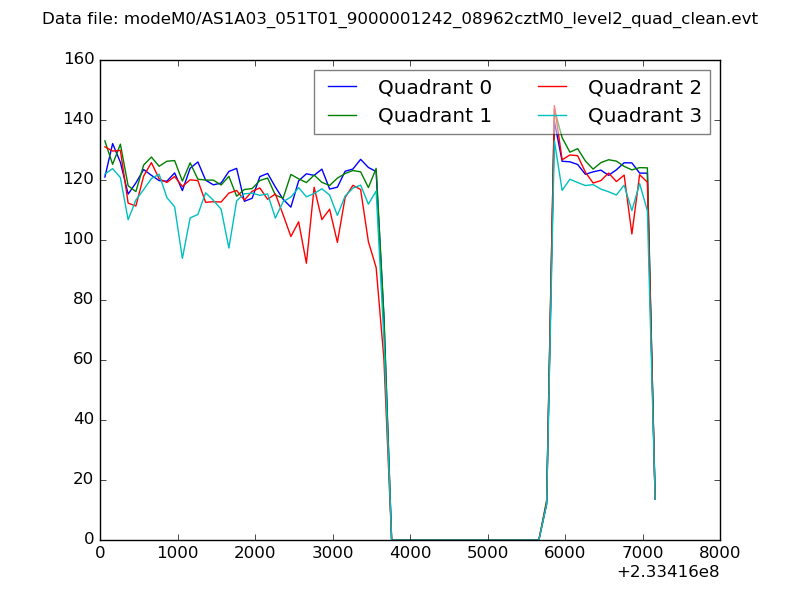
| Quadrant-wise count rates Data is divided into 100 sec bins |
 |
|
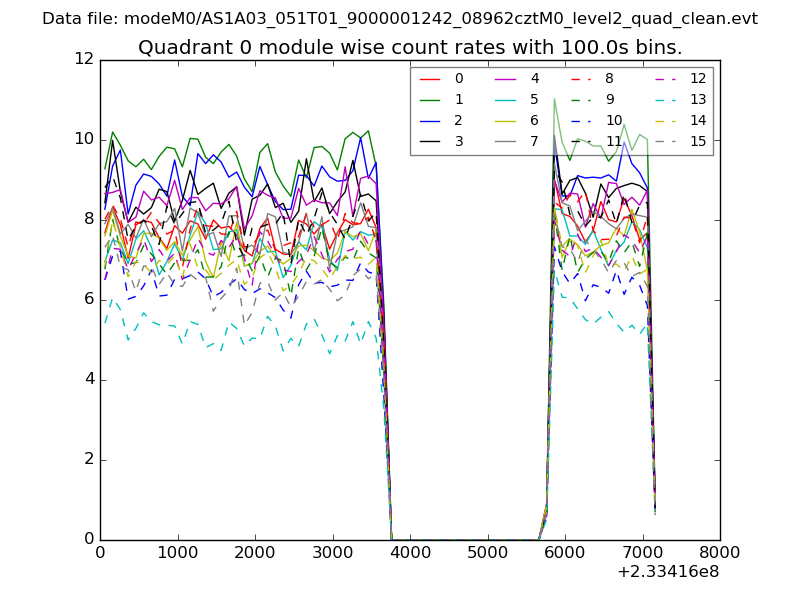
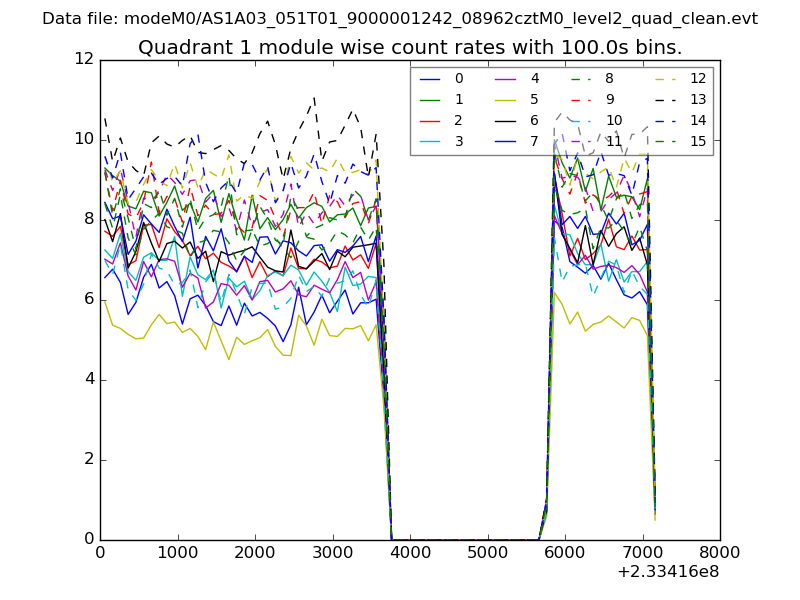
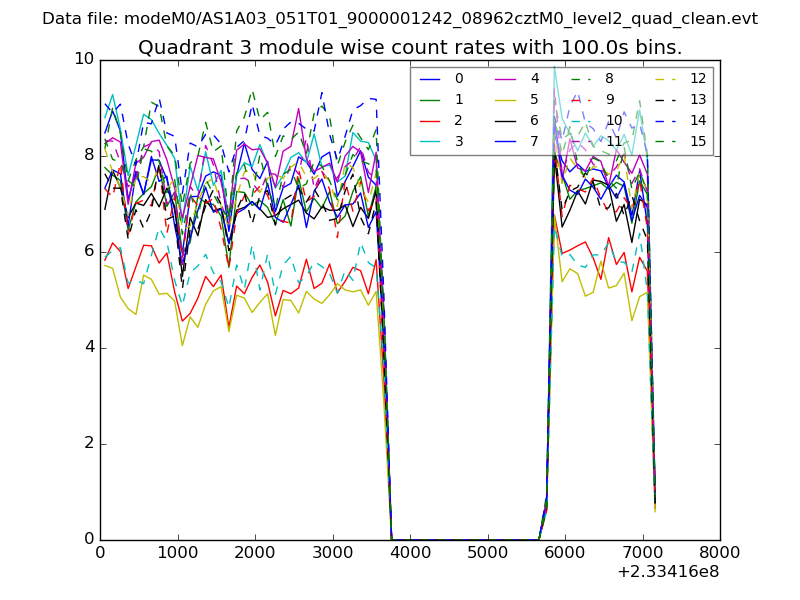
| Module-wise count rates for Quadrant A Data is divided into 100 sec bins |
 |
 |
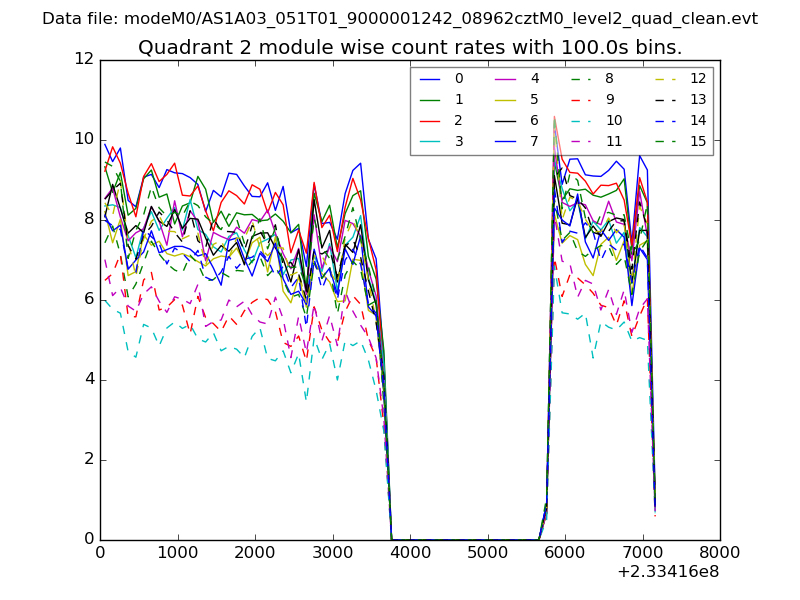
| Module-wise count rates for Quadrant B Data is divided into 100 sec bins |
 |
 |
| Module-wise count rates for Quadrant C Data is divided into 100 sec bins |
 |
 |
| Module-wise count rates for Quadrant D Data is divided into 100 sec bins |
 |
 |
| Parameter | Plot |
|---|---|
| CZT HV Monitor | 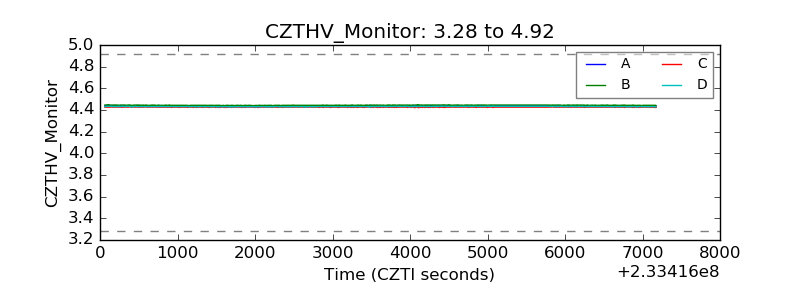 |
| D_VDD | 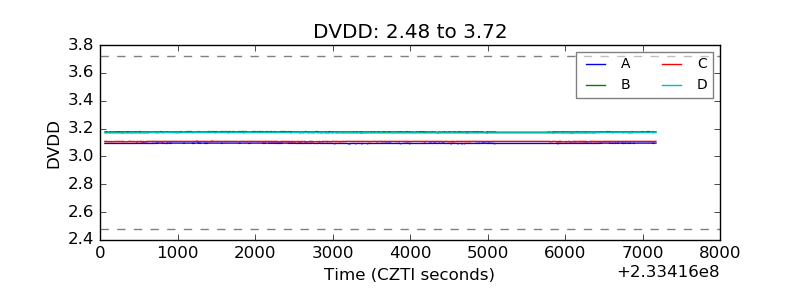 |
| Temperature 1 | 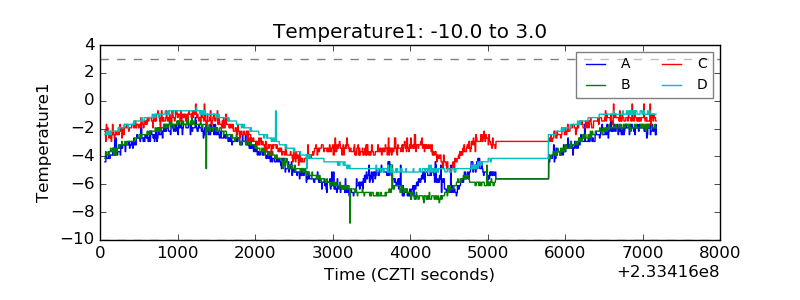 |
| Veto HV Monitor | 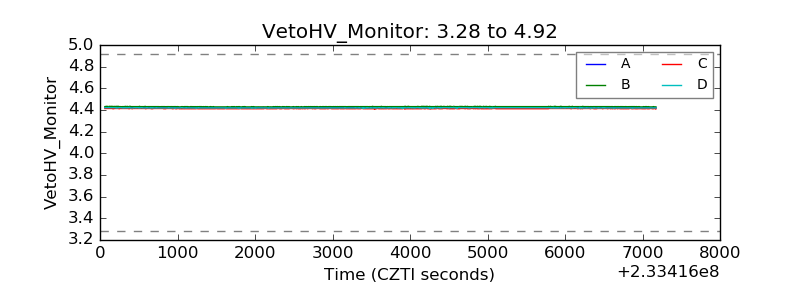 |
| Veto LLD | 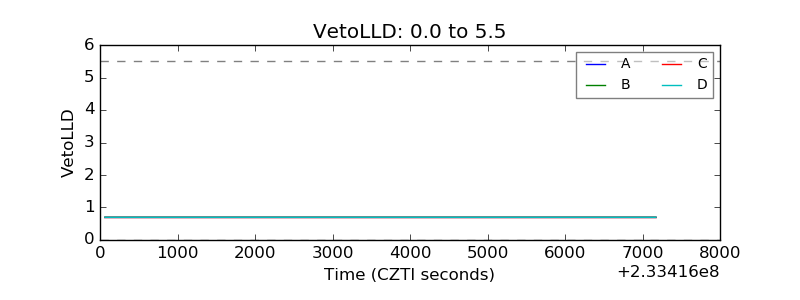 |
| Alpha Counter | 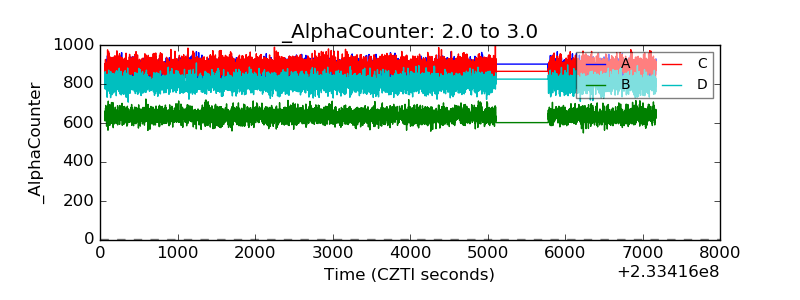 |
| _CPM_Rate | 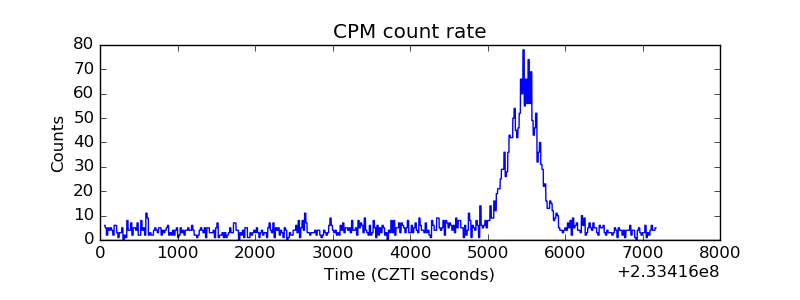 |
| CZT Counter | 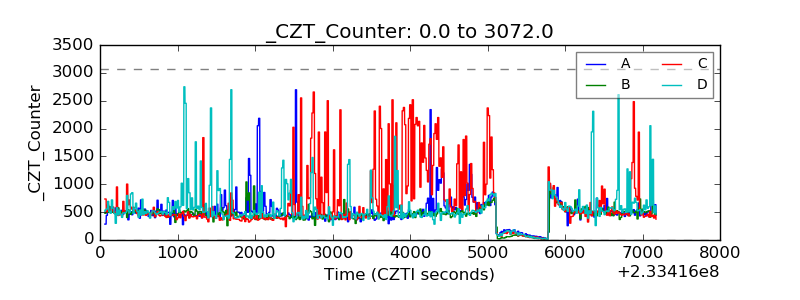 |
| +2.5 Volts monitor | 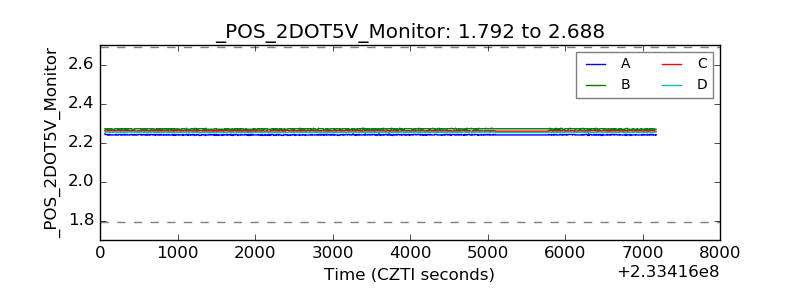 |
| +5 Volts monitor | 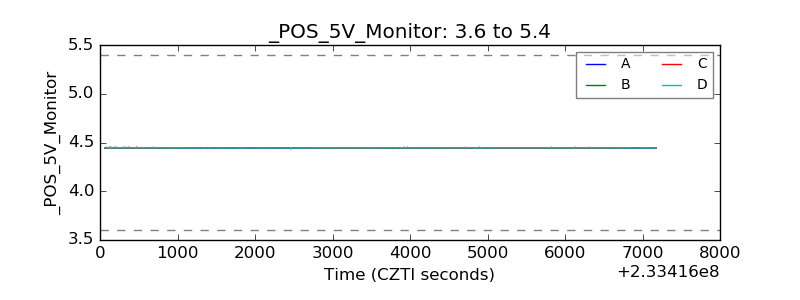 |
| _ROLL_ROT | 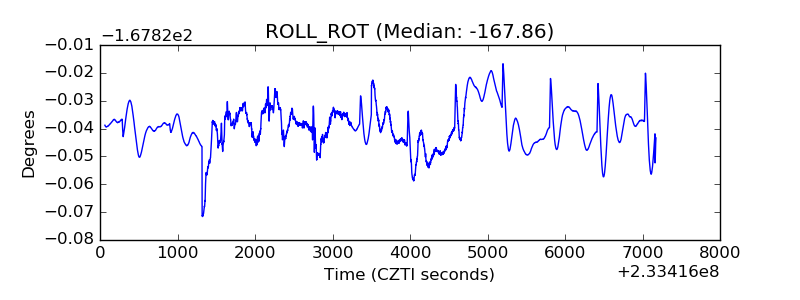 |
| _Roll_DEC | 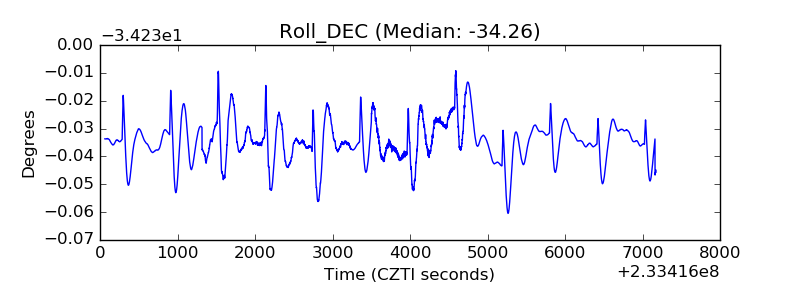 |
| _Roll_RA | 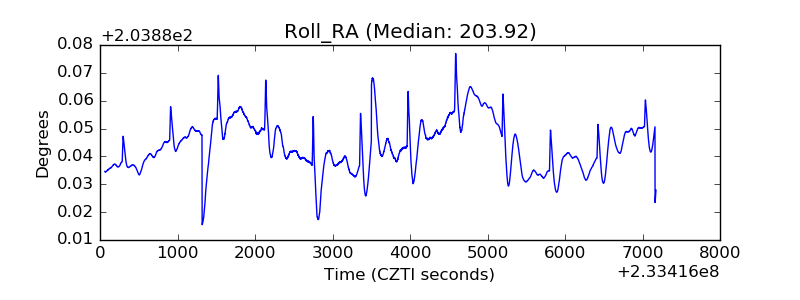 |
| Veto Counter | 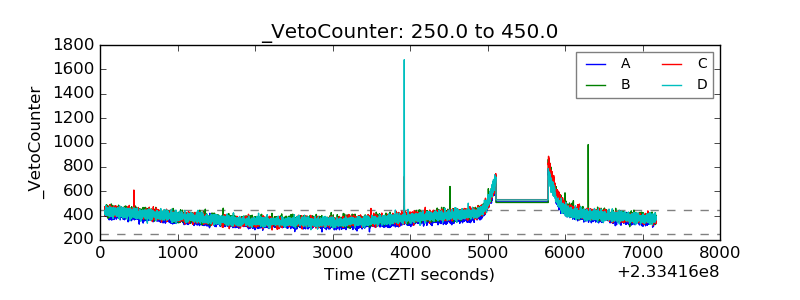 |