| Param | Original file | Final file |
|---|---|---|
| Filename | modeM0/AS1A03_051T01_9000001242_08963cztM0_level2.evt | modeM0/AS1A03_051T01_9000001242_08963cztM0_level2_quad_clean.evt |
| Size (bytes) | 226,722,240 | 50,682,240 |
| Size | 216.2 MB | 48.3 MB |
| Events in quadrant A | 1,778,065 | 335,968 |
| Events in quadrant B | 1,439,860 | 342,526 |
| Events in quadrant C | 1,736,730 | 327,516 |
| Events in quadrant D | 1,713,216 | 322,289 |
| Mode M9 | |||
|---|---|---|---|
| Quadrant | BADHDUFLAG | Total packets | Discarded packets |
| A | 0 | 6 | 0 |
| B | 0 | 6 | 0 |
| C | 0 | 6 | 0 |
| D | 0 | 6 | 0 |
| Mode M0 | |||
|---|---|---|---|
| Quadrant | BADHDUFLAG | Total packets | Discarded packets |
| A | 0 | 7126 | 1 |
| B | 0 | 6182 | 1 |
| C | 0 | 7266 | 1 |
| D | 0 | 6912 | 1 |
| Mode SS | |||
|---|---|---|---|
| Quadrant | BADHDUFLAG | Total packets | Discarded packets |
| A | 0 | 62 | 0 |
| B | 0 | 62 | 0 |
| C | 0 | 62 | 0 |
| D | 0 | 62 | 0 |
| Quadrant | Total seconds | Saturated seconds | Saturation percentage |
|---|---|---|---|
| A | 2884 | 152 | 5.270458% |
| B | 2884 | 102 | 3.536755% |
| C | 2884 | 168 | 5.825243% |
| D | 2884 | 135 | 4.680999% |
Noise dominated data is calculated using 1-second bins in cleaned event files. If a bin has >2000 counts, and if more than 50% of those come from <1% of pixels, then it is considered to be noise-dominated and hence unusable.
| Quadrant | # 1 sec bins | Bins with >0 counts | Bins with >2000 counts | High rate bins dominated by noise | Noise dominated (total time) | Noise dominated (detector-on time) | Marked lightcurve |
|---|---|---|---|---|---|---|---|
| A | 3559 | 2885 | 62 | 62 | 1.74% | 2.15% | 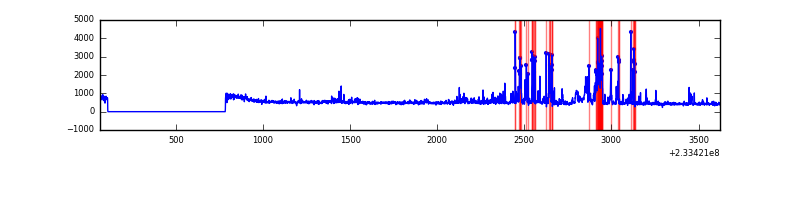 |
| B | 3559 | 2885 | 0 | 0 | 0.00% | 0.00% | 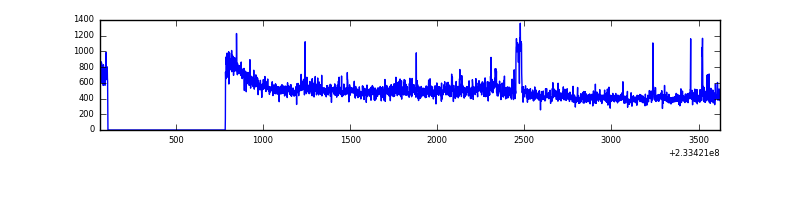 |
| C | 3559 | 2885 | 69 | 69 | 1.94% | 2.39% | 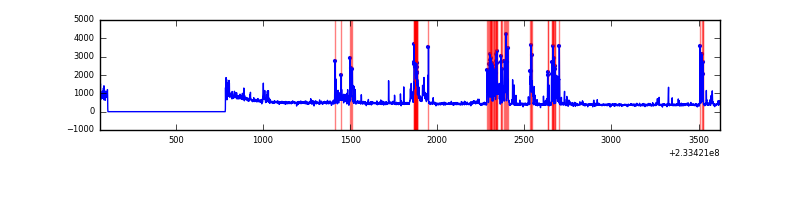 |
| D | 3559 | 2884 | 38 | 38 | 1.07% | 1.32% | 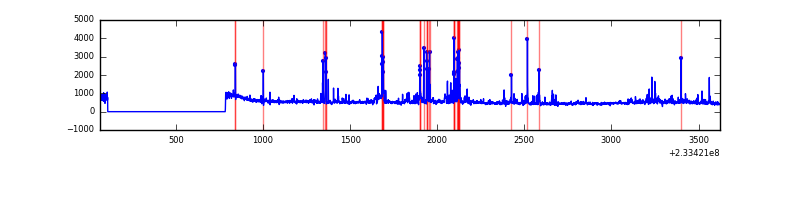 |
Top three noisy pixels from each quadrant. If the there are fewer than three noisy pixels in the level2.evt file, extra rows are filled as -1
| Pixel properties | Quadrant properties | ||||||
|---|---|---|---|---|---|---|---|
| Quadrant | DetID | PixID | Counts | Sigma | Mean | Median | Sigma |
| A | 5 | 16 | 340701 | 4708.79 | 345 | 337 | 72.3 |
| A | 8 | 5 | 99438 | 1371.02 | 345 | 337 | 72.3 |
| A | 15 | 174 | 4467 | 57.14 | 345 | 337 | 72.3 |
| B | 5 | 255 | 31615 | 456.37 | 345 | 338 | 68.5 |
| B | 0 | 214 | 21324 | 306.21 | 345 | 338 | 68.5 |
| B | 6 | 51 | 18430 | 263.99 | 345 | 338 | 68.5 |
| C | 4 | 254 | 445058 | 5787.09 | 325 | 326 | 76.8 |
| C | 14 | 234 | 21243 | 272.18 | 325 | 326 | 76.8 |
| C | 4 | 238 | 2699 | 30.88 | 325 | 326 | 76.8 |
| D | 8 | 195 | 155226 | 1734.08 | 331 | 323 | 89.3 |
| D | 13 | 104 | 144775 | 1617.08 | 331 | 323 | 89.3 |
| D | 7 | 71 | 47282 | 525.69 | 331 | 323 | 89.3 |
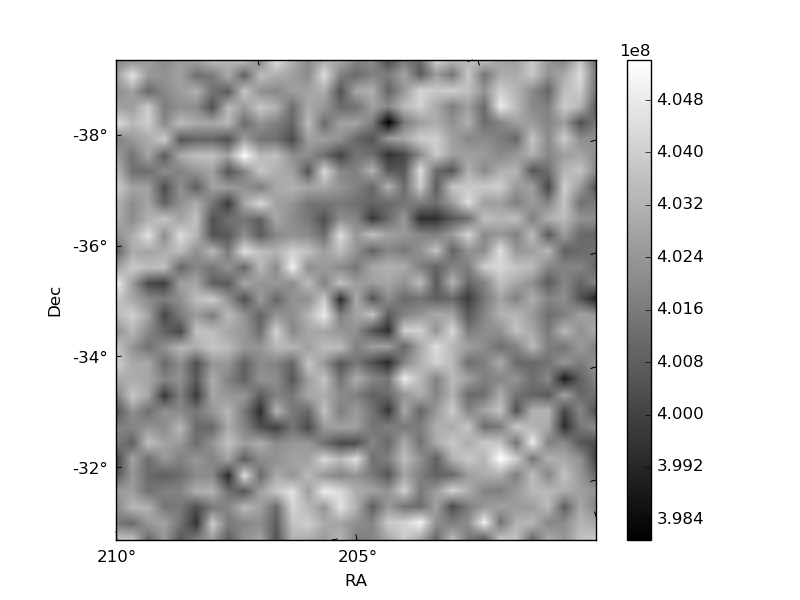
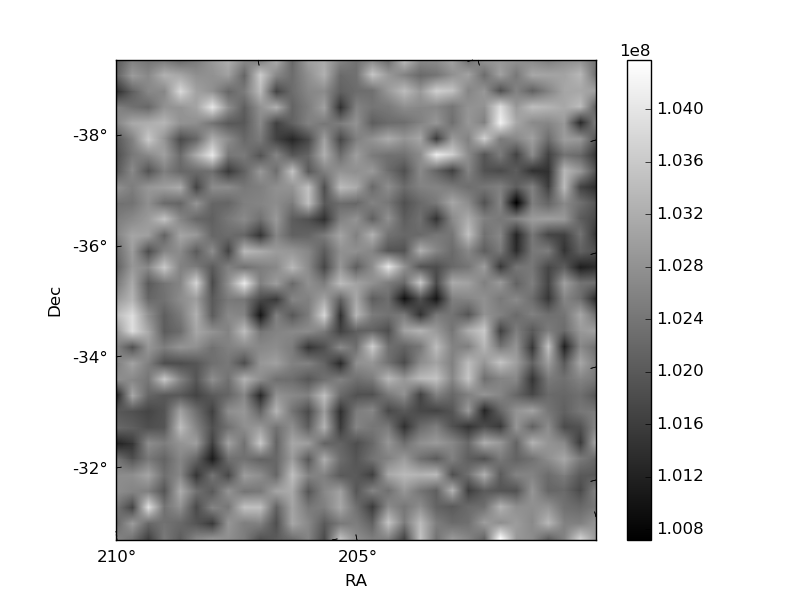
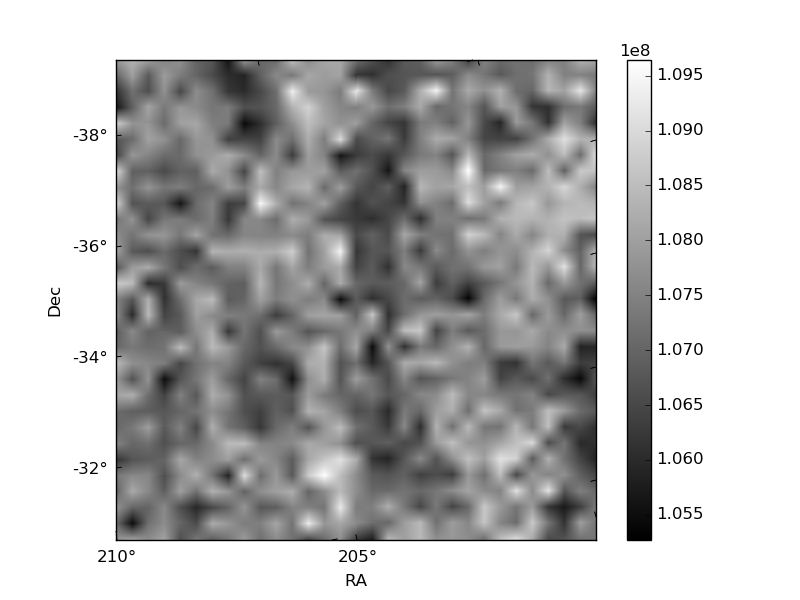
Histogram calculated using DETX and DETY for each event in the final _common_clean file
| Quadrant A | 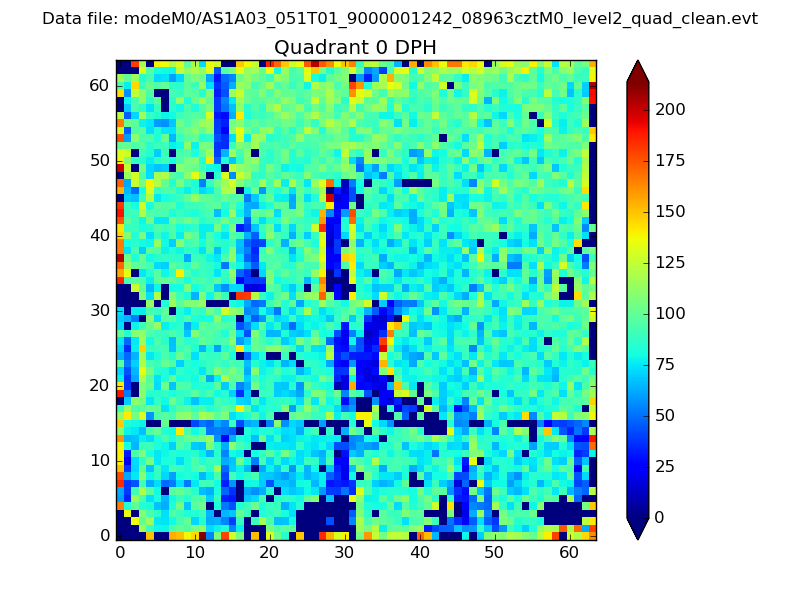 |
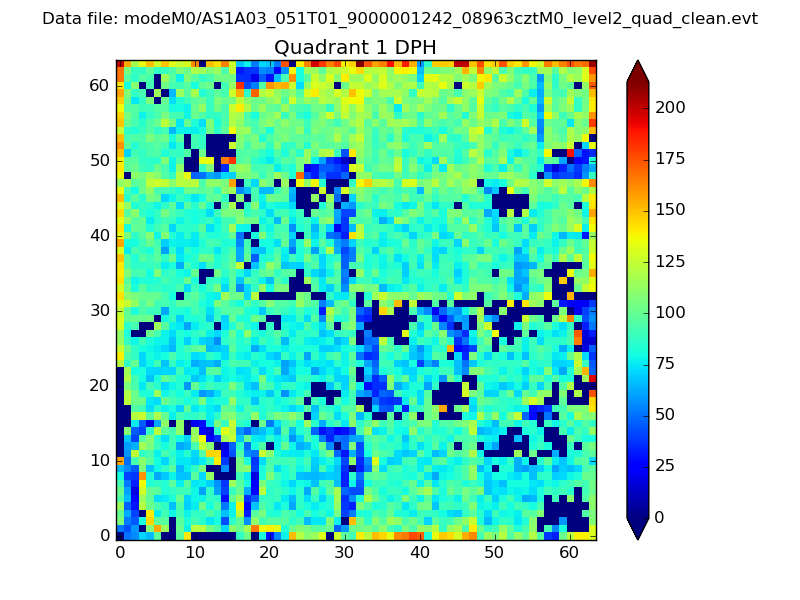 |
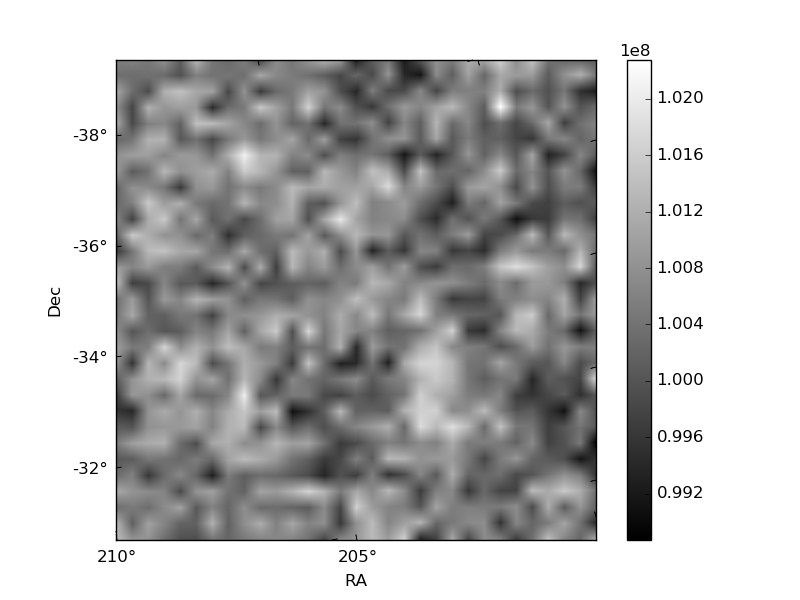
Quadrant B |
|---|---|---|---|
| Quadrant D | 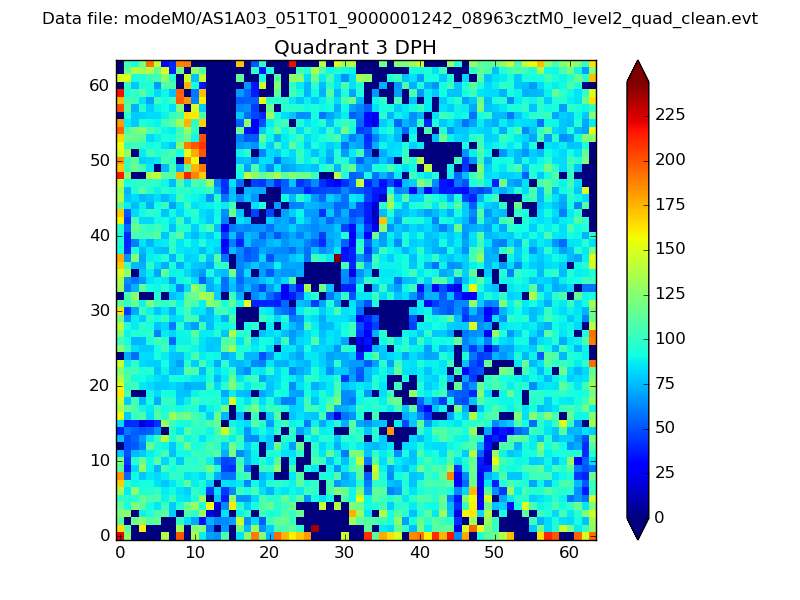 |
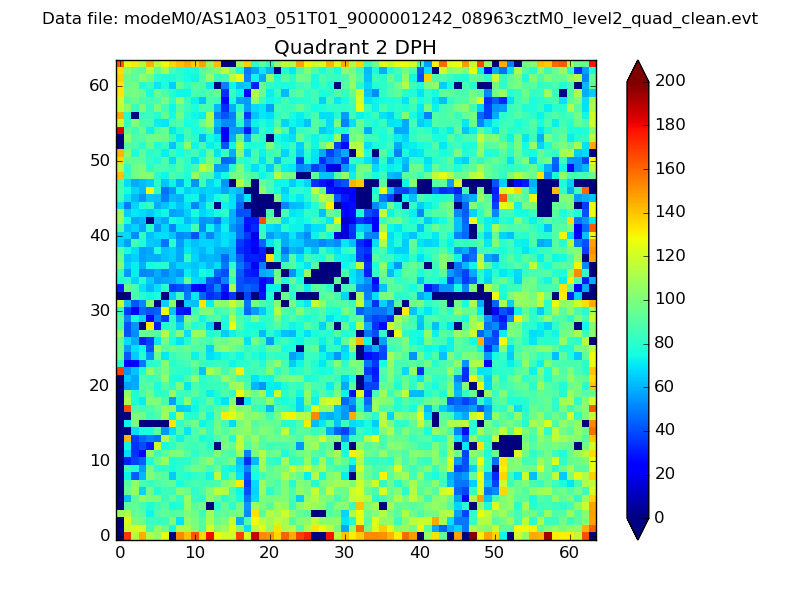 |
Quadrant C |
| Plot type | Count rate plots | Images |
|---|---|---|
| Comparison with Poisson distribution Blue bars denote a histogram of data divided into 1 sec bins. Red curve is a Poisson curve with rate = median count rate of data. |
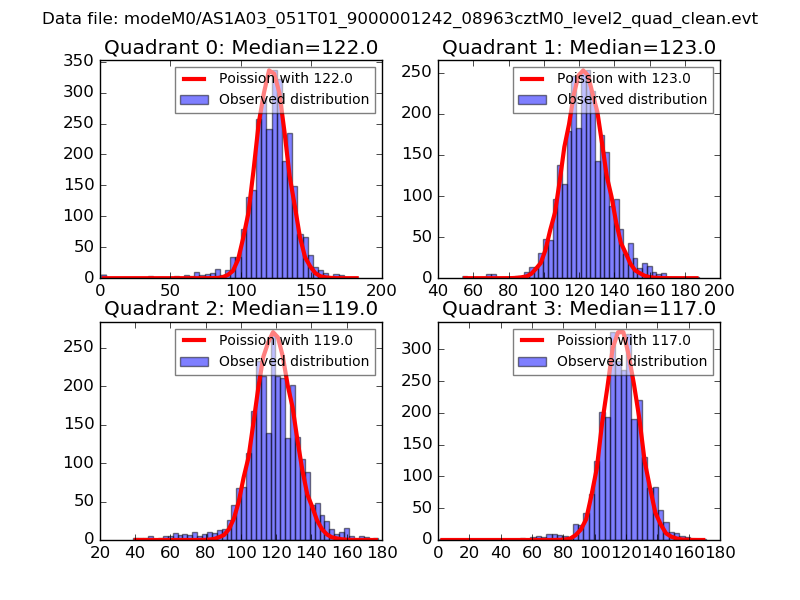 |
 |
| Quadrant-wise count rates Data is divided into 100 sec bins |
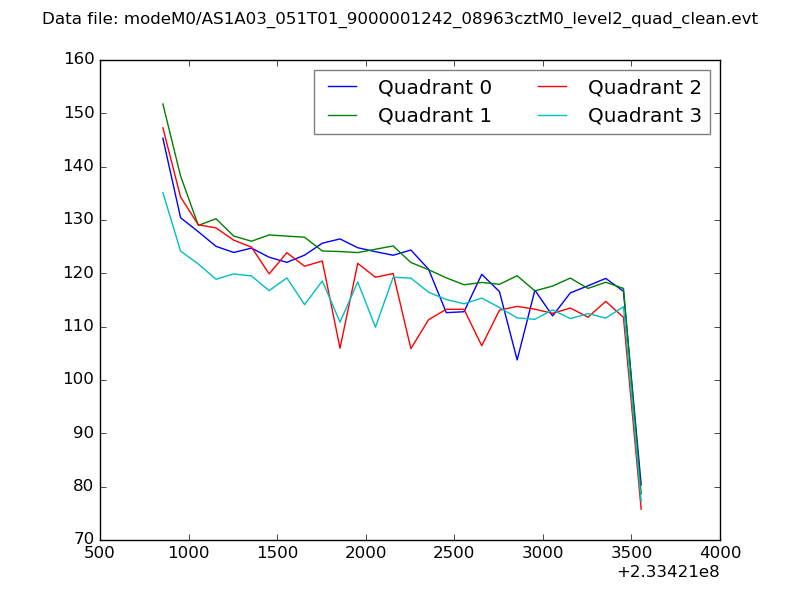 |
|
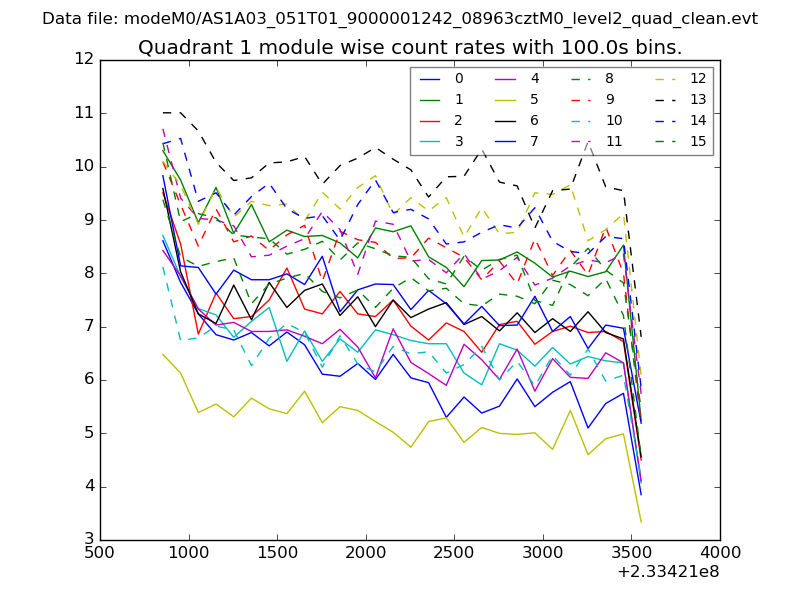
| Module-wise count rates for Quadrant A Data is divided into 100 sec bins |
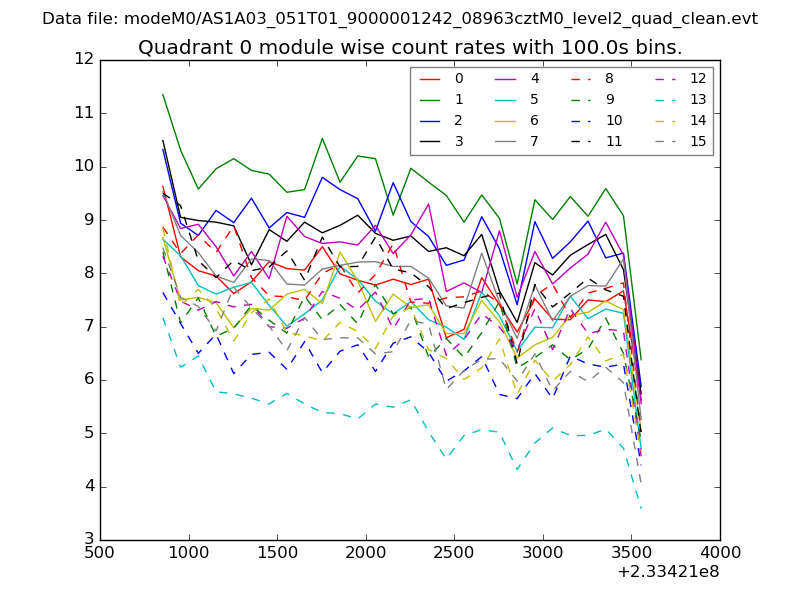 |
 |
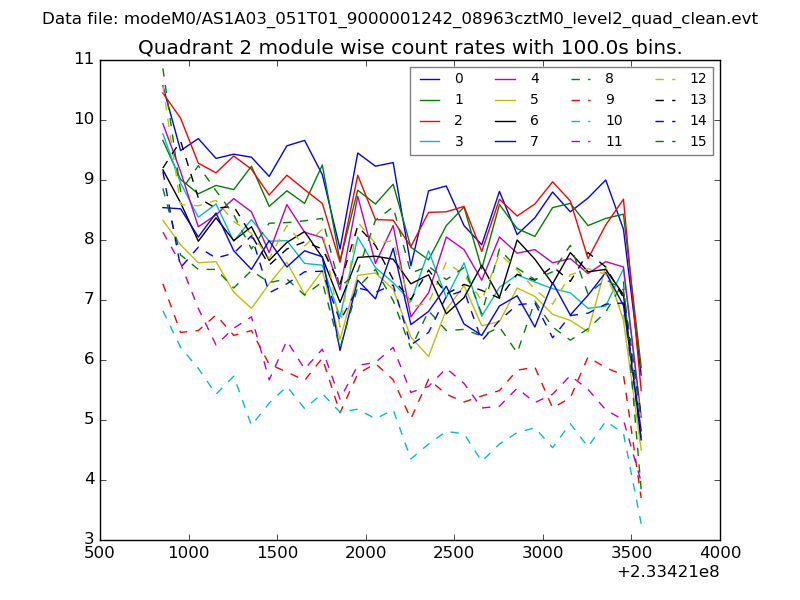
| Module-wise count rates for Quadrant B Data is divided into 100 sec bins |
 |
 |
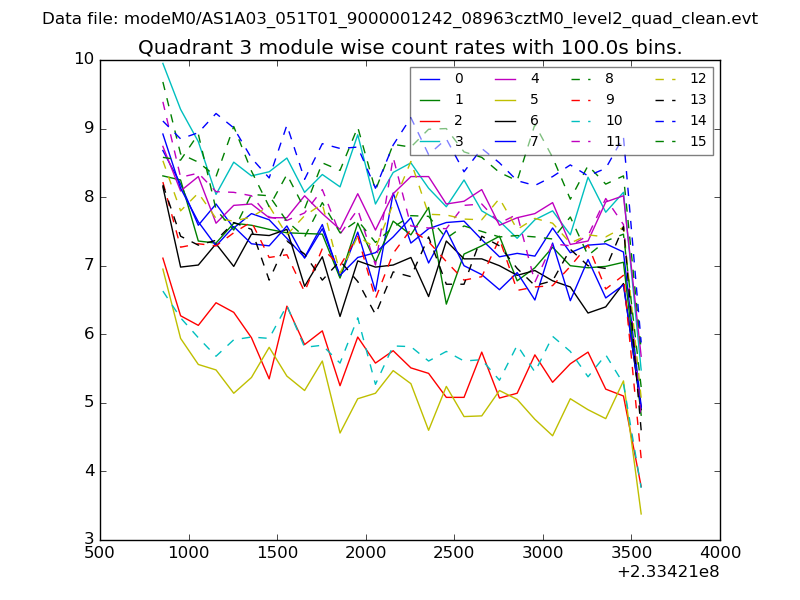
| Module-wise count rates for Quadrant C Data is divided into 100 sec bins |
 |
 |
| Module-wise count rates for Quadrant D Data is divided into 100 sec bins |
 |
 |
| Parameter | Plot |
|---|---|
| CZT HV Monitor | 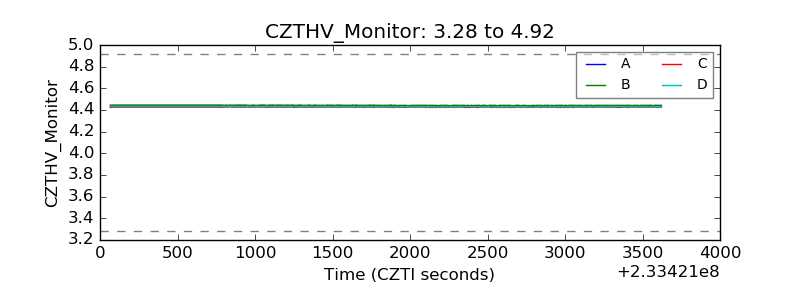 |
| D_VDD |  |
| Temperature 1 | 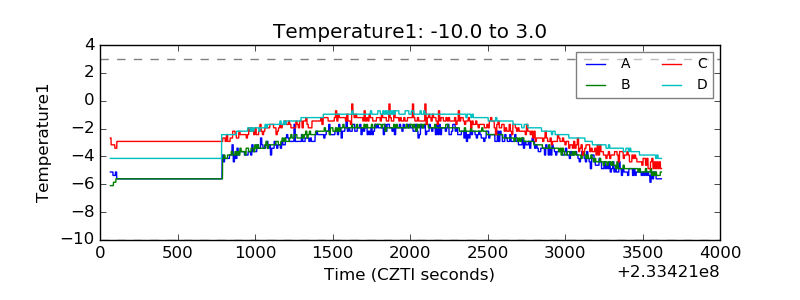 |
| Veto HV Monitor | 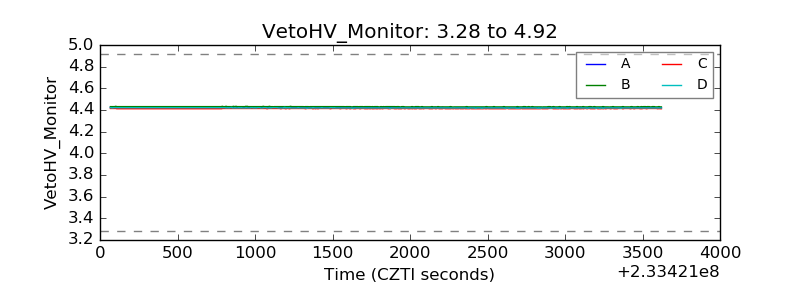 |
| Veto LLD | 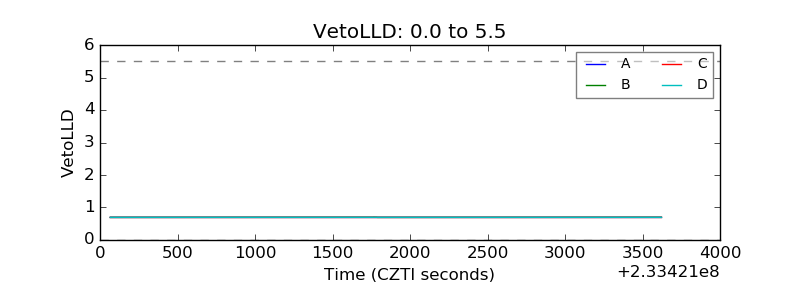 |
| Alpha Counter |  |
| _CPM_Rate | 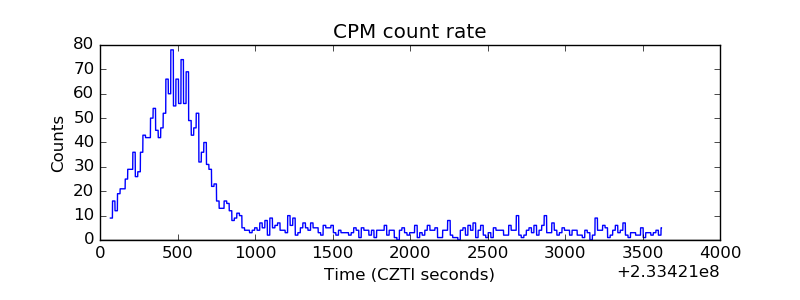 |
| CZT Counter | 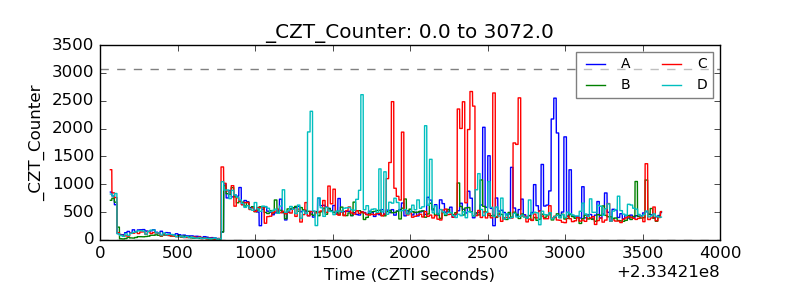 |
| +2.5 Volts monitor |  |
| +5 Volts monitor |  |
| _ROLL_ROT | 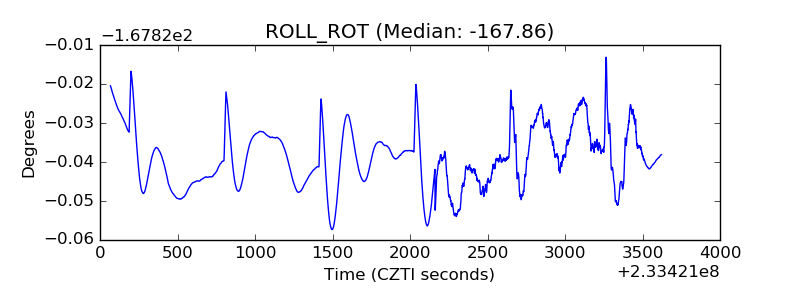 |
| _Roll_DEC | 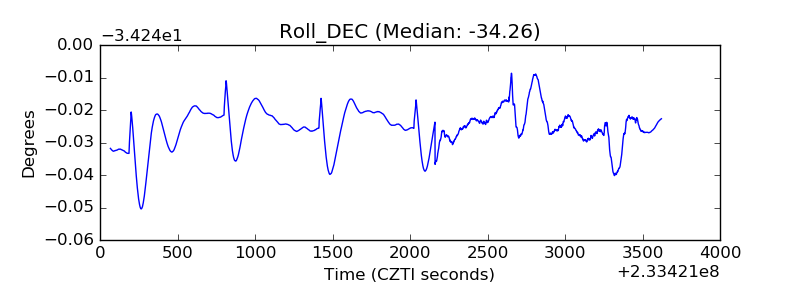 |
| _Roll_RA | 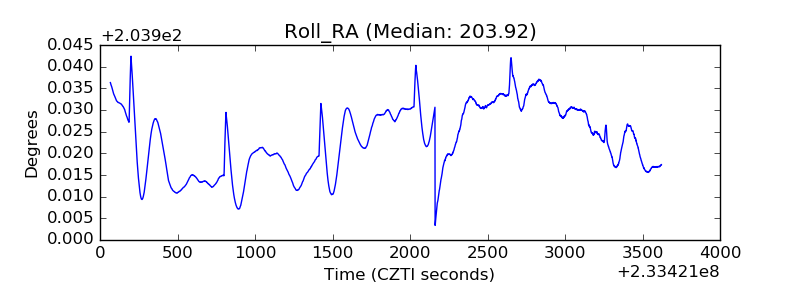 |
| Veto Counter | 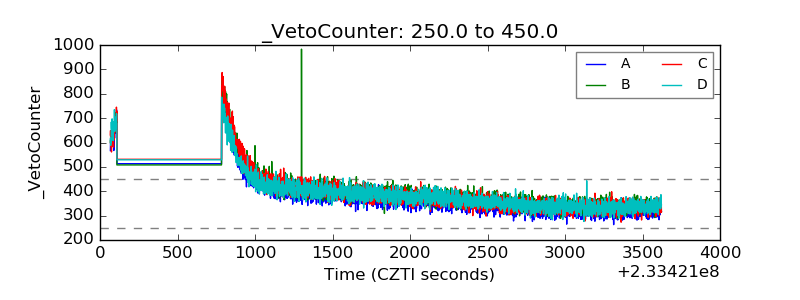 |