| Param | Original file | Final file |
|---|---|---|
| Filename | modeM0/AS1G07_019T01_9000001244cztM0_level2.fits | modeM0/AS1G07_019T01_9000001244cztM0_level2_quad_clean.evt |
| Size (bytes) | 538,185,600 | 538,511,040 |
| Size | 513.3 MB | 513.6 MB |
| Events in quadrant A | 3,275,408 | 3,268,064 |
| Events in quadrant B | 3,104,988 | 3,165,435 |
| Events in quadrant C | 3,209,400 | 3,112,667 |
| Events in quadrant D | 2,734,074 | 2,789,493 |
| Mode M0 | |||
|---|---|---|---|
| Quadrant | BADHDUFLAG | Total packets | Discarded packets |
| A | 0 | 137252 | 0 |
| B | 0 | 141053 | 0 |
| C | 0 | 124349 | 0 |
| D | 0 | 148649 | 0 |
| Mode M9 | |||
|---|---|---|---|
| Quadrant | BADHDUFLAG | Total packets | Discarded packets |
| A | 0 | 91 | 0 |
| B | 0 | 91 | 0 |
| C | 0 | 91 | 0 |
| D | 0 | 91 | 0 |
| Mode SS | |||
|---|---|---|---|
| Quadrant | BADHDUFLAG | Total packets | Discarded packets |
| A | 0 | 1182 | 0 |
| B | 0 | 1182 | 0 |
| C | 0 | 1182 | 0 |
| D | 0 | 1182 | 0 |
| Quadrant | Total seconds | Saturated seconds | Saturation percentage |
|---|---|---|---|
| A | 57917 | 1091 | 1.883730% |
| B | 57917 | 2623 | 4.528895% |
| C | 57917 | 825 | 1.424452% |
| D | 57916 | 2720 | 4.696457% |
Noise dominated data is calculated using 1-second bins in cleaned event files. If a bin has >2000 counts, and if more than 50% of those come from <1% of pixels, then it is considered to be noise-dominated and hence unusable.
| Quadrant | # 1 sec bins | Bins with >0 counts | Bins with >2000 counts | High rate bins dominated by noise | Noise dominated (total time) | Noise dominated (detector-on time) | Marked lightcurve |
|---|---|---|---|---|---|---|---|
| A | 67008 | 57911 | 0 | 0 | 0.00% | 0.00% |  |
| B | 67008 | 57799 | 0 | 0 | 0.00% | 0.00% |  |
| C | 67008 | 57911 | 0 | 0 | 0.00% | 0.00% |  |
| D | 67008 | 57656 | 0 | 0 | 0.00% | 0.00% |  |
Top three noisy pixels from each quadrant. If the there are fewer than three noisy pixels in the level2.evt file, extra rows are filled as -1
| Pixel properties | Quadrant properties | ||||||
|---|---|---|---|---|---|---|---|
| Quadrant | DetID | PixID | Counts | Sigma | Mean | Median | Sigma |
| A | 0 | 29 | 3205 | 11.24 | 851 | 795 | 214.4 |
| A | 7 | 110 | 2712 | 8.94 | 851 | 795 | 214.4 |
| A | 0 | 30 | 2417 | 7.56 | 851 | 795 | 214.4 |
| B | 2 | 9 | 2649 | 11.54 | 820 | 781 | 161.9 |
| B | 12 | 226 | 2098 | 8.13 | 820 | 781 | 161.9 |
| B | 14 | 254 | 2072 | 7.97 | 820 | 781 | 161.9 |
| C | 1 | 80 | 2390 | 7.21 | 847 | 784 | 222.8 |
| C | 1 | 81 | 2338 | 6.97 | 847 | 784 | 222.8 |
| C | 12 | 241 | 2272 | 6.68 | 847 | 784 | 222.8 |
| D | 6 | 231 | 2056 | 6.56 | 780 | 710 | 205.3 |
| D | 7 | 5 | 1942 | 6.0 | 780 | 710 | 205.3 |
| D | 6 | 83 | 1923 | 5.91 | 780 | 710 | 205.3 |
Histogram calculated using DETX and DETY for each event in the final _common_clean file
| Quadrant A | 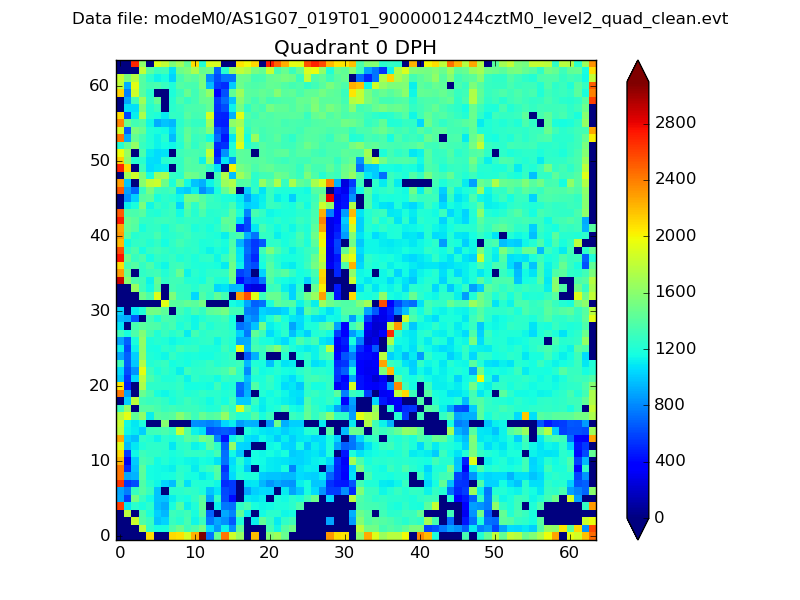 |
 |
Quadrant B |
|---|---|---|---|
| Quadrant D |  |
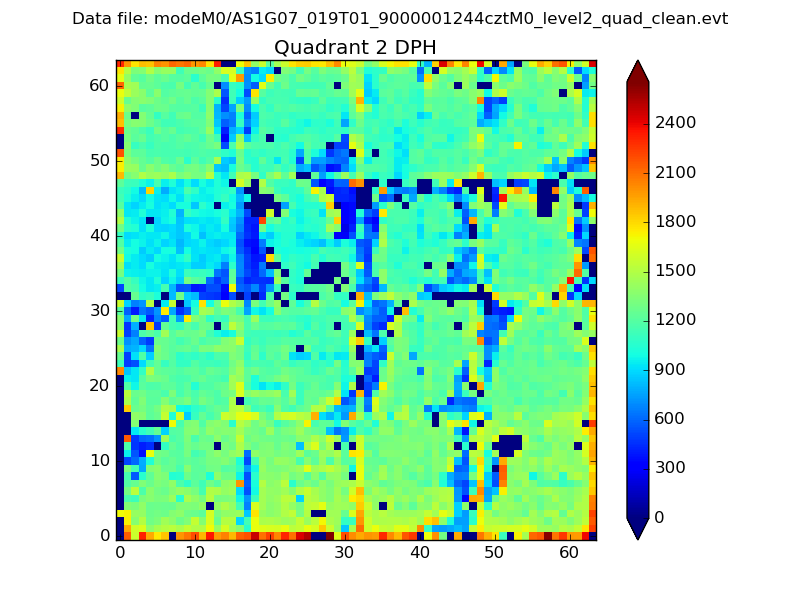 |
Quadrant C |
| Plot type | Count rate plots | Images |
|---|---|---|
| Comparison with Poisson distribution Blue bars denote a histogram of data divided into 1 sec bins. Red curve is a Poisson curve with rate = median count rate of data. |
 |
 |
| Quadrant-wise count rates Data is divided into 100 sec bins |
 |
|
| Module-wise count rates for Quadrant A Data is divided into 100 sec bins |
 |
 |
| Module-wise count rates for Quadrant B Data is divided into 100 sec bins |
 |
 |
| Module-wise count rates for Quadrant C Data is divided into 100 sec bins |
 |
 |
| Module-wise count rates for Quadrant D Data is divided into 100 sec bins |
 |
 |
| Parameter | Plot |
|---|---|
| CZT HV Monitor |  |
| D_VDD | 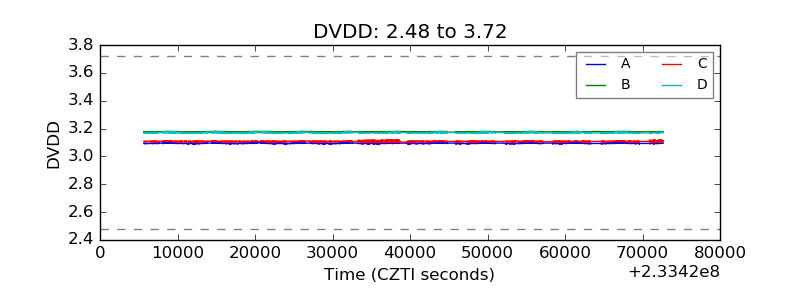 |
| Temperature 1 |  |
| Veto HV Monitor |  |
| Veto LLD |  |
| Alpha Counter |  |
| _CPM_Rate |  |
| CZT Counter |  |
| +2.5 Volts monitor |  |
| +5 Volts monitor |  |
| _ROLL_ROT |  |
| _Roll_DEC |  |
| _Roll_RA |  |
| Veto Counter |  |