| Param | Original file | Final file |
|---|---|---|
| Filename | modeM0/AS1G07_019T01_9000001244_08965cztM0_level2.evt | modeM0/AS1G07_019T01_9000001244_08965cztM0_level2_quad_clean.evt |
| Size (bytes) | 623,560,320 | 106,306,560 |
| Size | 594.7 MB | 101.4 MB |
| Events in quadrant A | 4,136,967 | 687,719 |
| Events in quadrant B | 4,558,370 | 677,885 |
| Events in quadrant C | 4,209,912 | 673,602 |
| Events in quadrant D | 5,455,557 | 642,342 |
| Mode M0 | |||
|---|---|---|---|
| Quadrant | BADHDUFLAG | Total packets | Discarded packets |
| A | 0 | 17586 | 3 |
| B | 0 | 18927 | 2 |
| C | 0 | 18183 | 2 |
| D | 0 | 21345 | 2 |
| Mode M9 | |||
|---|---|---|---|
| Quadrant | BADHDUFLAG | Total packets | Discarded packets |
| A | 0 | 7 | 0 |
| B | 0 | 7 | 0 |
| C | 0 | 7 | 0 |
| D | 0 | 7 | 0 |
| Mode SS | |||
|---|---|---|---|
| Quadrant | BADHDUFLAG | Total packets | Discarded packets |
| A | 0 | 158 | 0 |
| B | 0 | 158 | 0 |
| C | 0 | 158 | 0 |
| D | 0 | 158 | 0 |
| Quadrant | Total seconds | Saturated seconds | Saturation percentage |
|---|---|---|---|
| A | 7730 | 87 | 1.125485% |
| B | 7730 | 371 | 4.799483% |
| C | 7730 | 258 | 3.337646% |
| D | 7730 | 466 | 6.028461% |
Noise dominated data is calculated using 1-second bins in cleaned event files. If a bin has >2000 counts, and if more than 50% of those come from <1% of pixels, then it is considered to be noise-dominated and hence unusable.
| Quadrant | # 1 sec bins | Bins with >0 counts | Bins with >2000 counts | High rate bins dominated by noise | Noise dominated (total time) | Noise dominated (detector-on time) | Marked lightcurve |
|---|---|---|---|---|---|---|---|
| A | 8435 | 7732 | 19 | 19 | 0.23% | 0.25% | 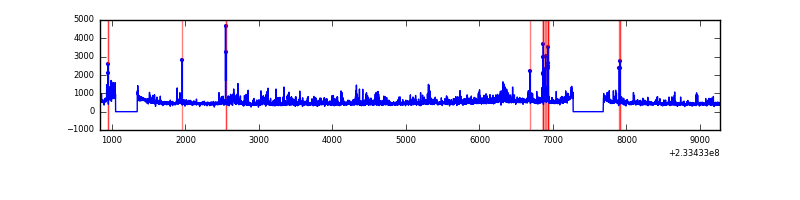 |
| B | 8435 | 7732 | 266 | 266 | 3.15% | 3.44% | 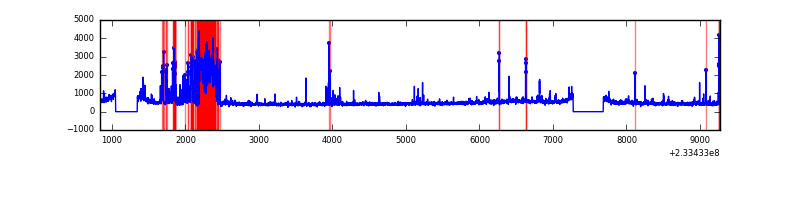 |
| C | 8435 | 7732 | 163 | 163 | 1.93% | 2.11% | 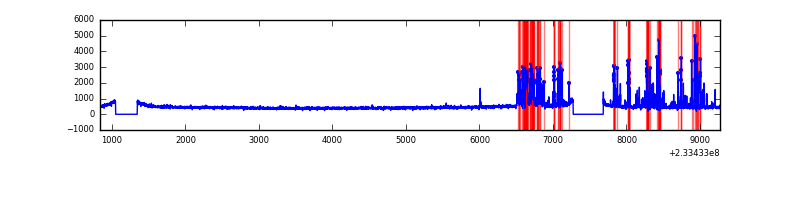 |
| D | 8435 | 7732 | 357 | 357 | 4.23% | 4.62% | 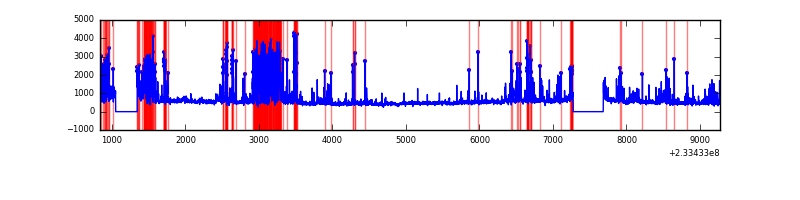 |
Top three noisy pixels from each quadrant. If the there are fewer than three noisy pixels in the level2.evt file, extra rows are filled as -1
| Pixel properties | Quadrant properties | ||||||
|---|---|---|---|---|---|---|---|
| Quadrant | DetID | PixID | Counts | Sigma | Mean | Median | Sigma |
| A | 8 | 5 | 562574 | 3015.06 | 896 | 874 | 186.3 |
| A | 5 | 16 | 66070 | 349.96 | 896 | 874 | 186.3 |
| A | 15 | 174 | 31415 | 163.94 | 896 | 874 | 186.3 |
| B | 10 | 252 | 847852 | 4983.87 | 892 | 870 | 169.9 |
| B | 10 | 16 | 87789 | 511.45 | 892 | 870 | 169.9 |
| B | 0 | 219 | 24393 | 138.42 | 892 | 870 | 169.9 |
| C | 4 | 254 | 812517 | 4004.05 | 867 | 869 | 202.7 |
| C | 14 | 234 | 7510 | 32.76 | 867 | 869 | 202.7 |
| C | 13 | 61 | 6524 | 27.9 | 867 | 869 | 202.7 |
| D | 13 | 104 | 606596 | 2833.29 | 863 | 835 | 213.8 |
| D | 13 | 29 | 600885 | 2806.58 | 863 | 835 | 213.8 |
| D | 8 | 195 | 451700 | 2108.8 | 863 | 835 | 213.8 |
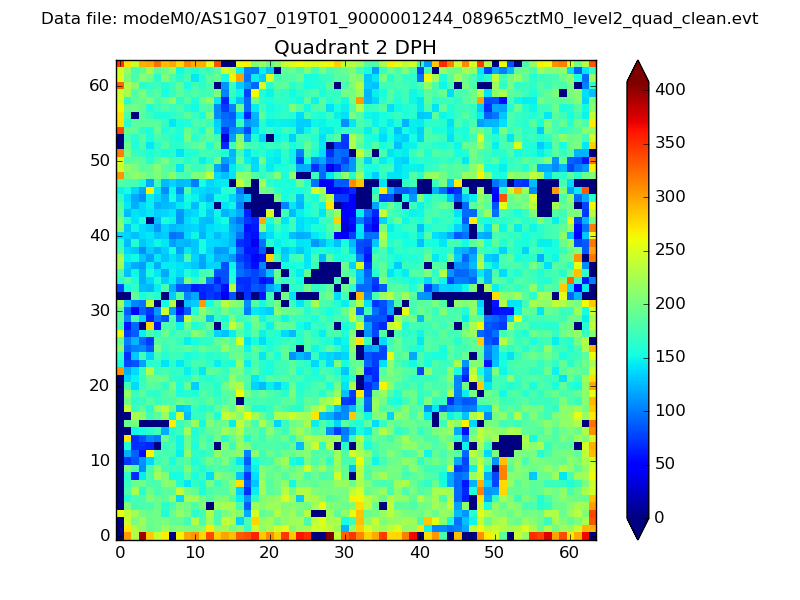
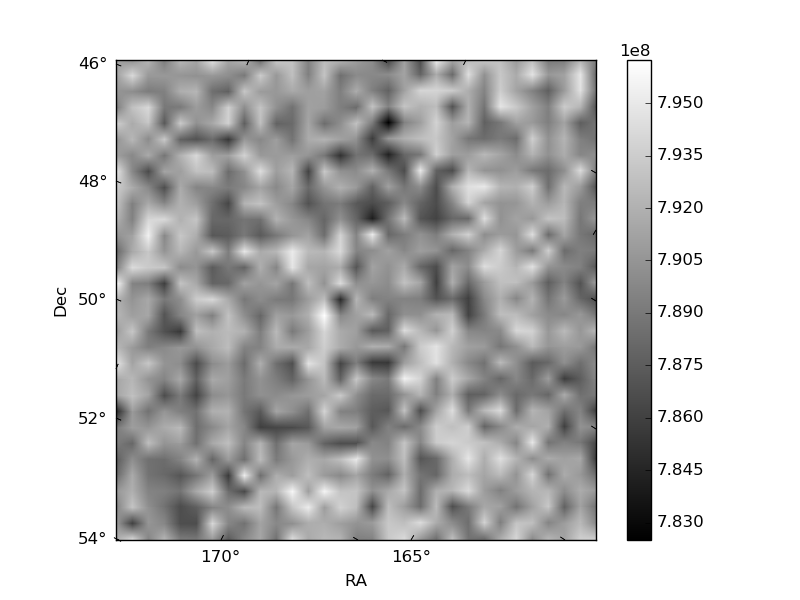
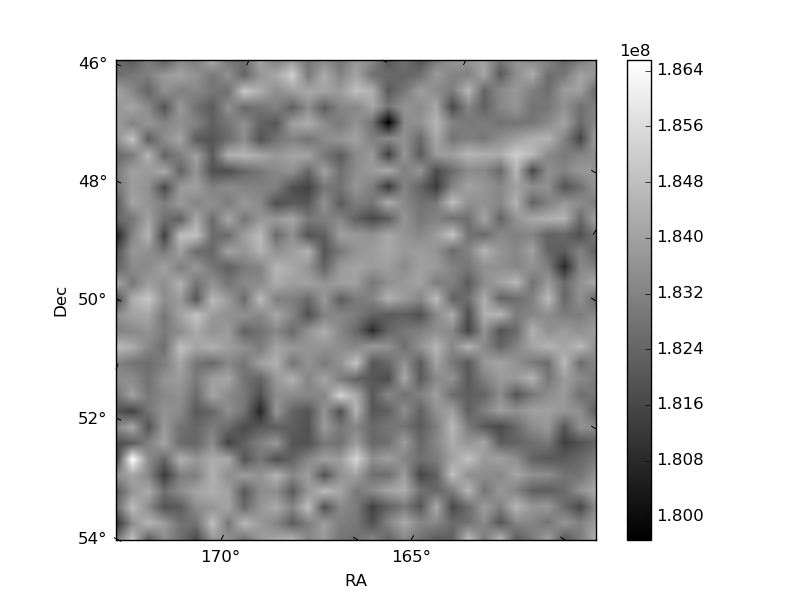
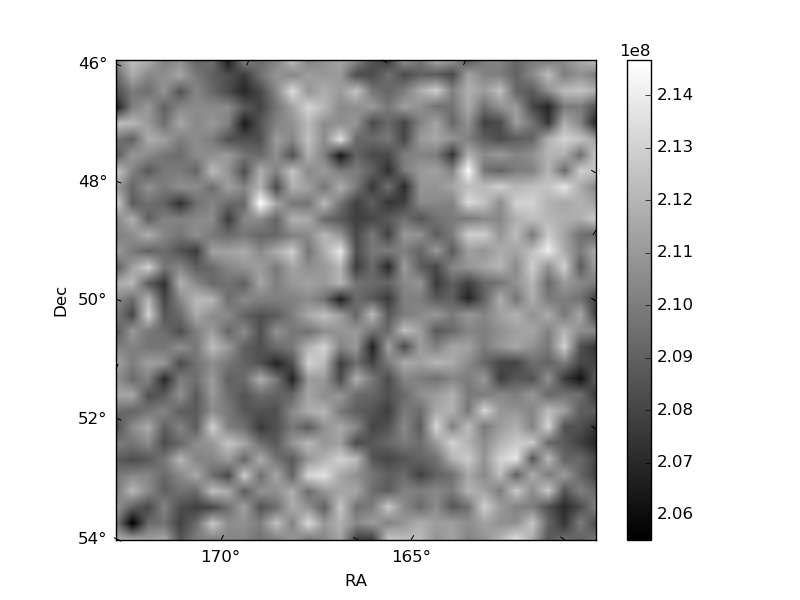
Histogram calculated using DETX and DETY for each event in the final _common_clean file
| Quadrant A | 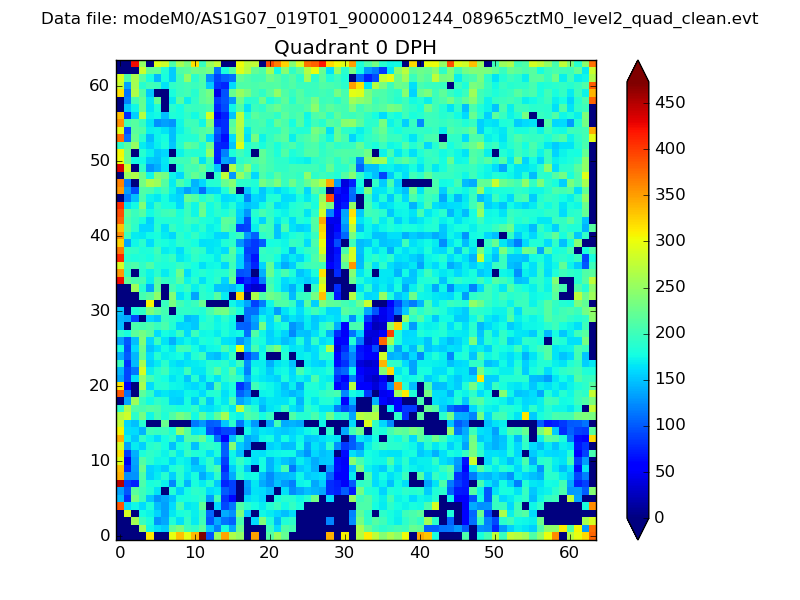 |
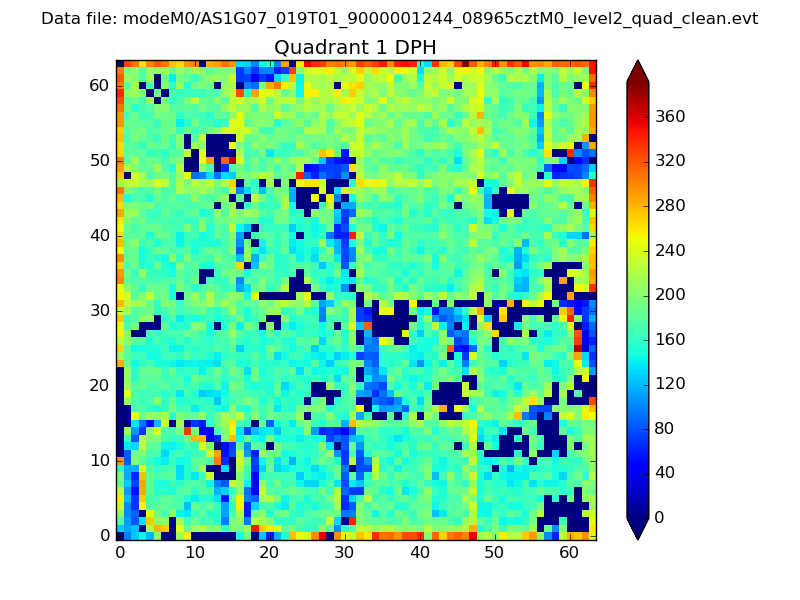 |
Quadrant B |
|---|---|---|---|
| Quadrant D | 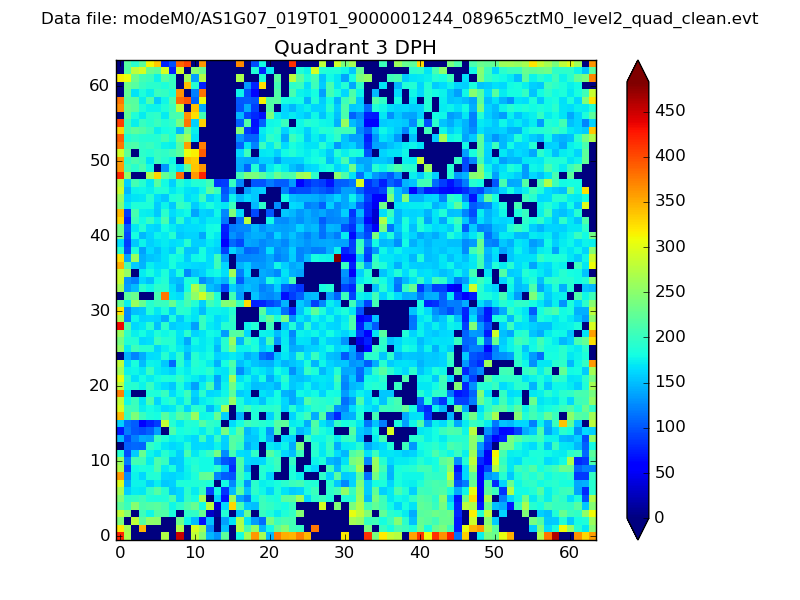 |
 |
Quadrant C |
| Plot type | Count rate plots | Images |
|---|---|---|
| Comparison with Poisson distribution Blue bars denote a histogram of data divided into 1 sec bins. Red curve is a Poisson curve with rate = median count rate of data. |
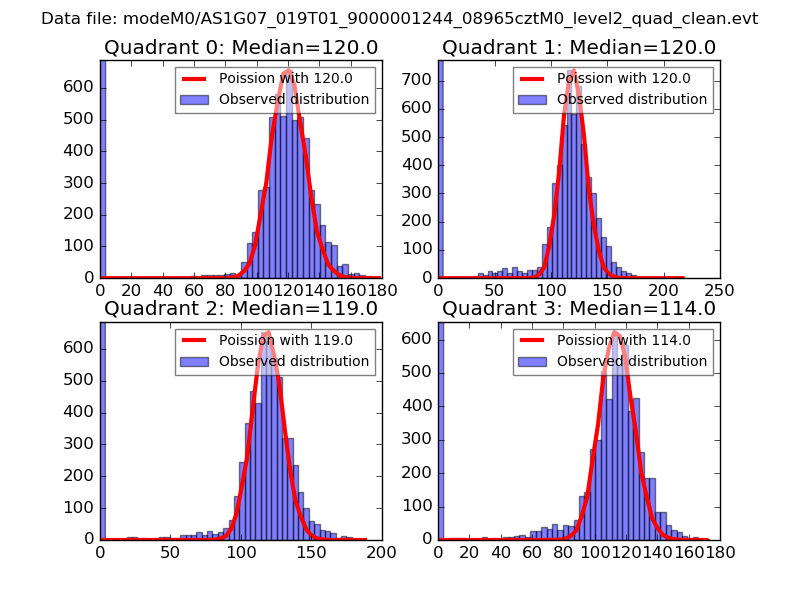 |
 |
| Quadrant-wise count rates Data is divided into 100 sec bins |
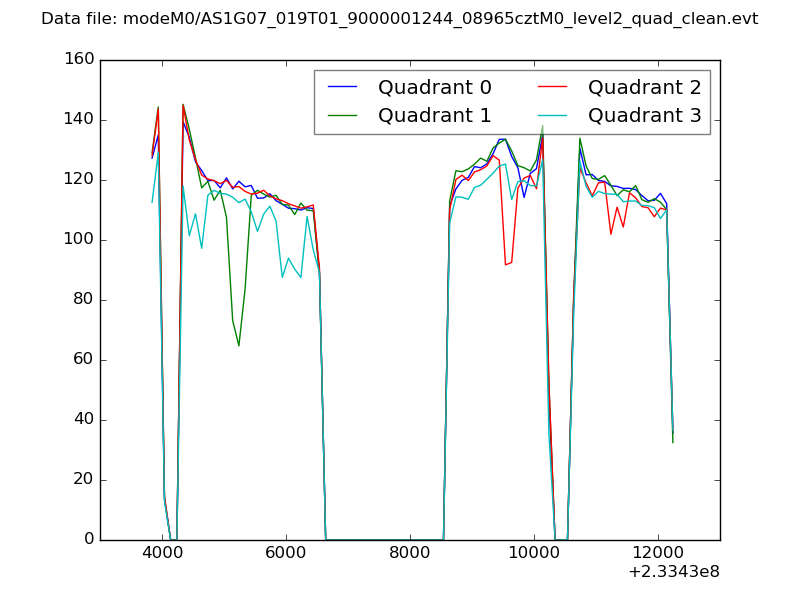 |
|
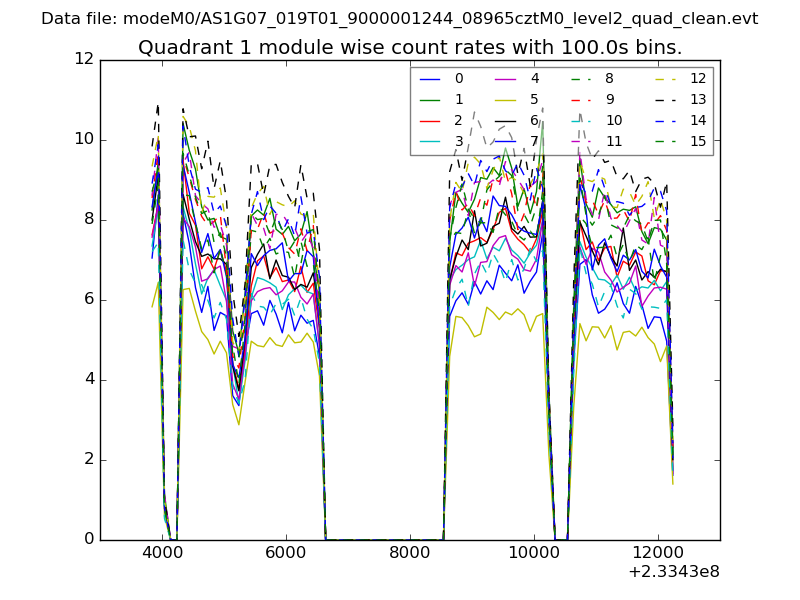
| Module-wise count rates for Quadrant A Data is divided into 100 sec bins |
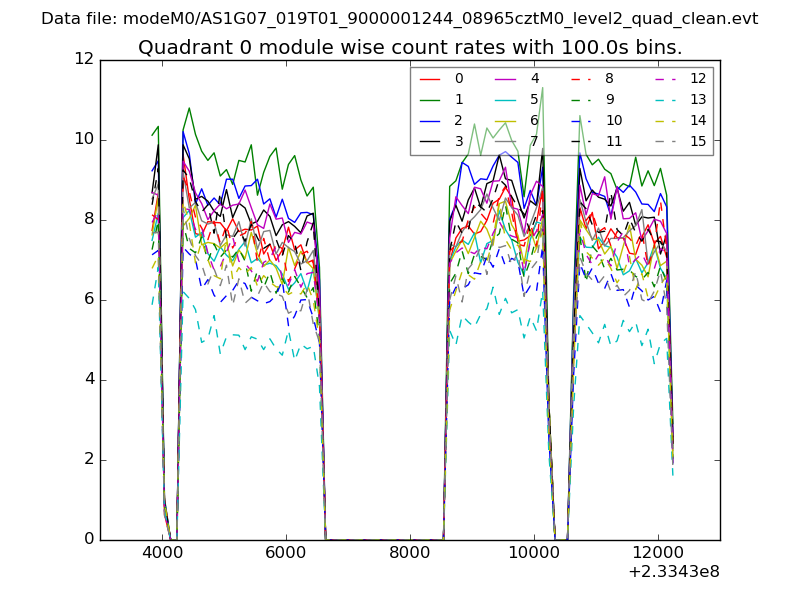 |
 |
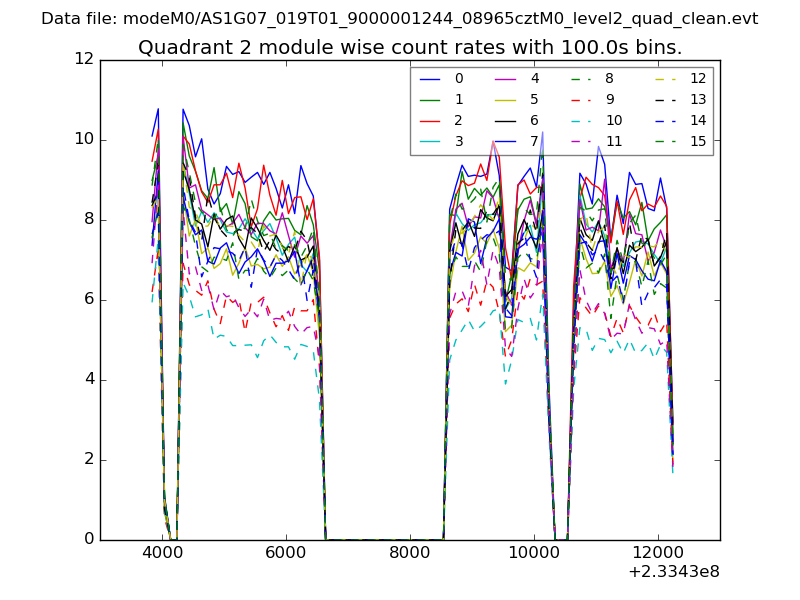
| Module-wise count rates for Quadrant B Data is divided into 100 sec bins |
 |
 |
| Module-wise count rates for Quadrant C Data is divided into 100 sec bins |
 |
 |
| Module-wise count rates for Quadrant D Data is divided into 100 sec bins |
 |
 |
| Parameter | Plot |
|---|---|
| CZT HV Monitor | 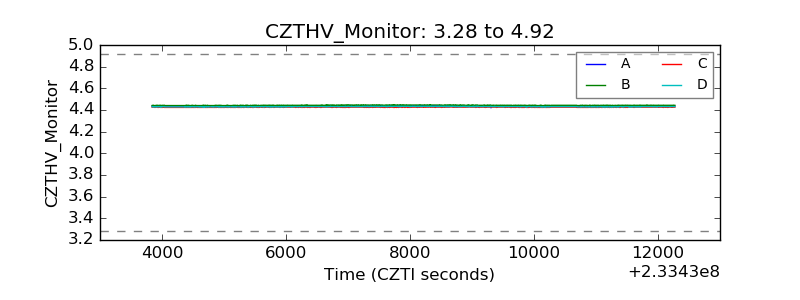 |
| D_VDD | 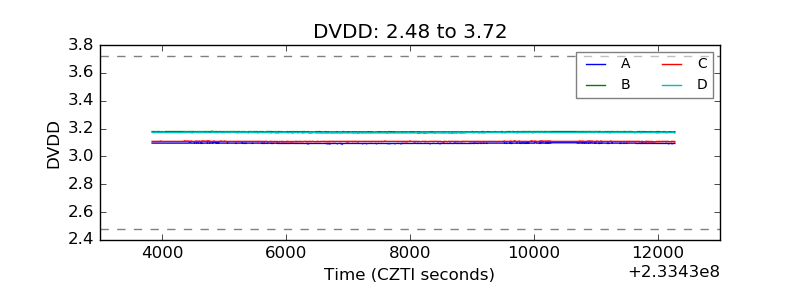 |
| Temperature 1 |  |
| Veto HV Monitor | 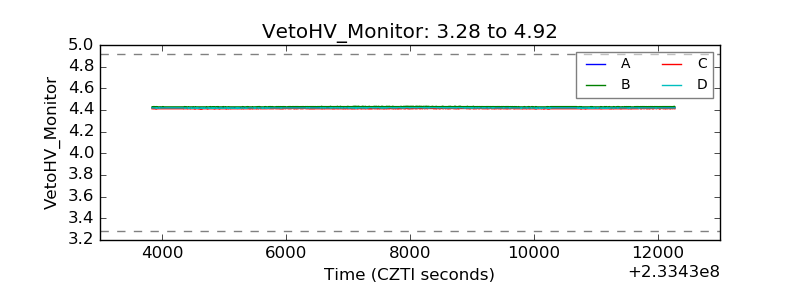 |
| Veto LLD | 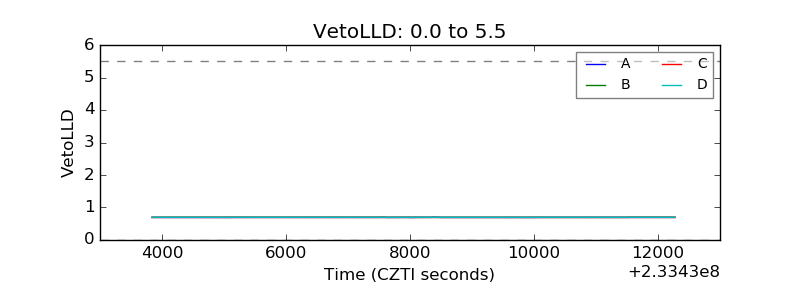 |
| Alpha Counter | 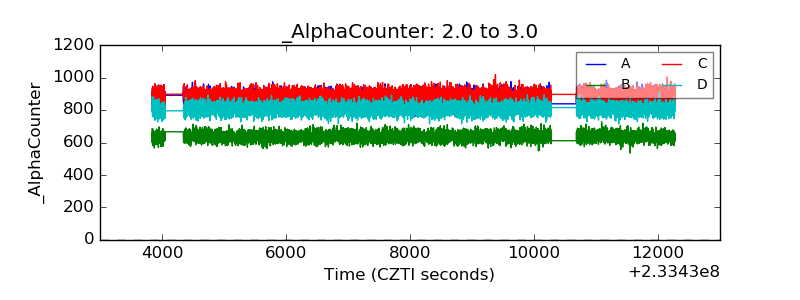 |
| _CPM_Rate | 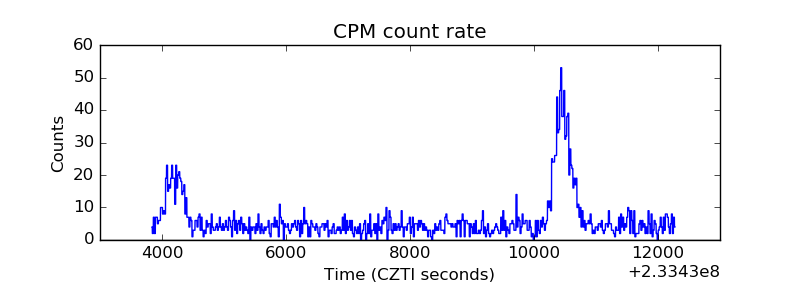 |
| CZT Counter | 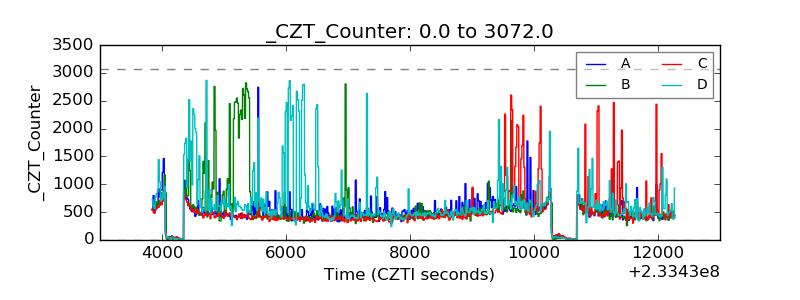 |
| +2.5 Volts monitor |  |
| +5 Volts monitor | 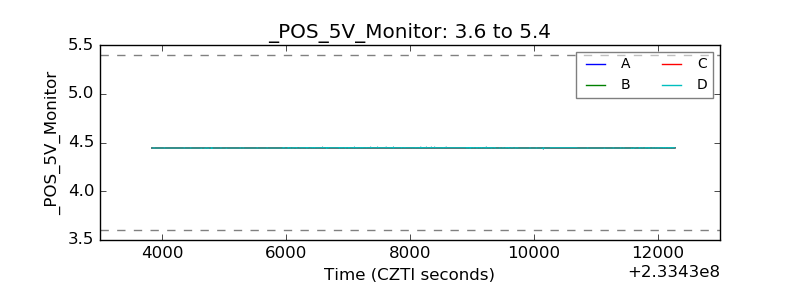 |
| _ROLL_ROT | 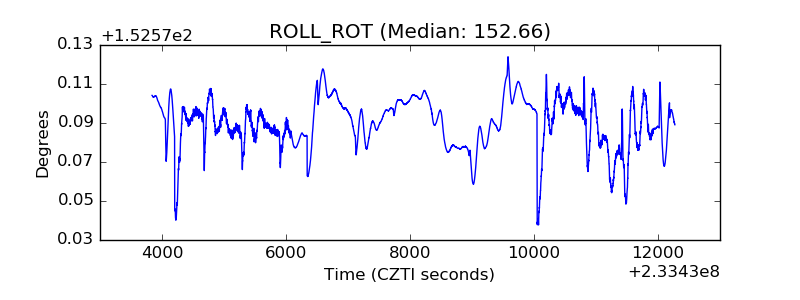 |
| _Roll_DEC |  |
| _Roll_RA | 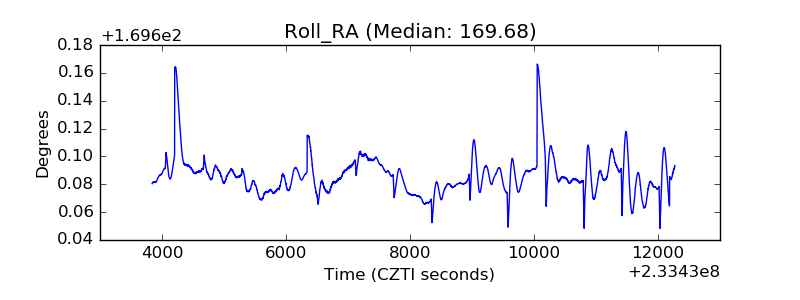 |
| Veto Counter | 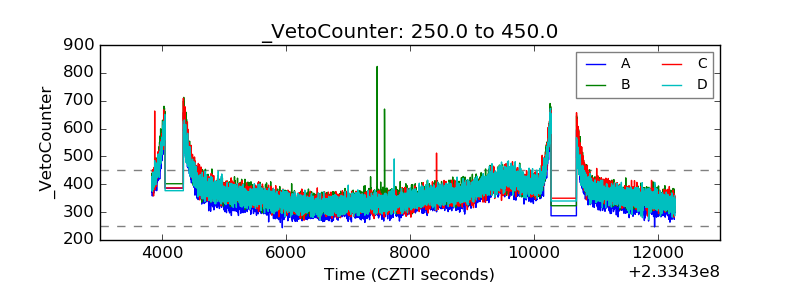 |