| Param | Original file | Final file |
|---|---|---|
| Filename | modeM0/AS1G07_019T01_9000001244_08967cztM0_level2.evt | modeM0/AS1G07_019T01_9000001244_08967cztM0_level2_quad_clean.evt |
| Size (bytes) | 1,009,376,640 | 158,964,480 |
| Size | 962.6 MB | 151.6 MB |
| Events in quadrant A | 6,590,496 | 997,958 |
| Events in quadrant B | 8,213,264 | 981,186 |
| Events in quadrant C | 6,378,506 | 987,923 |
| Events in quadrant D | 8,508,592 | 949,634 |
| Mode M0 | |||
|---|---|---|---|
| Quadrant | BADHDUFLAG | Total packets | Discarded packets |
| A | 0 | 28480 | 3 |
| B | 0 | 33267 | 2 |
| C | 0 | 28147 | 2 |
| D | 0 | 34186 | 2 |
| Mode M9 | |||
|---|---|---|---|
| Quadrant | BADHDUFLAG | Total packets | Discarded packets |
| A | 0 | 18 | 0 |
| B | 0 | 18 | 0 |
| C | 0 | 18 | 0 |
| D | 0 | 18 | 0 |
| Mode SS | |||
|---|---|---|---|
| Quadrant | BADHDUFLAG | Total packets | Discarded packets |
| A | 0 | 266 | 0 |
| B | 0 | 266 | 0 |
| C | 0 | 266 | 0 |
| D | 0 | 266 | 0 |
| Quadrant | Total seconds | Saturated seconds | Saturation percentage |
|---|---|---|---|
| A | 12995 | 93 | 0.715660% |
| B | 12995 | 754 | 5.802232% |
| C | 12995 | 161 | 1.238938% |
| D | 12995 | 525 | 4.040015% |
Noise dominated data is calculated using 1-second bins in cleaned event files. If a bin has >2000 counts, and if more than 50% of those come from <1% of pixels, then it is considered to be noise-dominated and hence unusable.
| Quadrant | # 1 sec bins | Bins with >0 counts | Bins with >2000 counts | High rate bins dominated by noise | Noise dominated (total time) | Noise dominated (detector-on time) | Marked lightcurve |
|---|---|---|---|---|---|---|---|
| A | 14705 | 12999 | 30 | 30 | 0.20% | 0.23% | 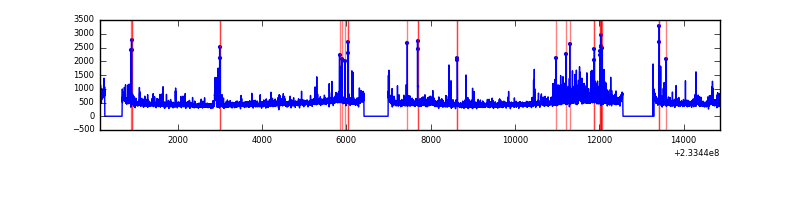 |
| B | 14705 | 12997 | 493 | 493 | 3.35% | 3.79% | 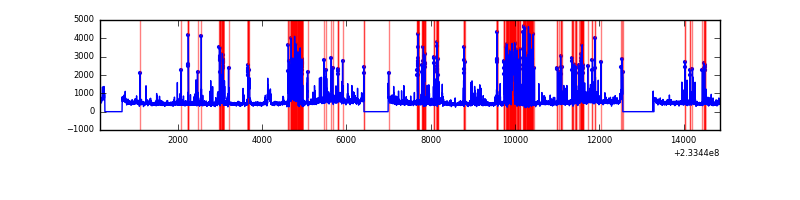 |
| C | 14705 | 12999 | 92 | 92 | 0.63% | 0.71% | 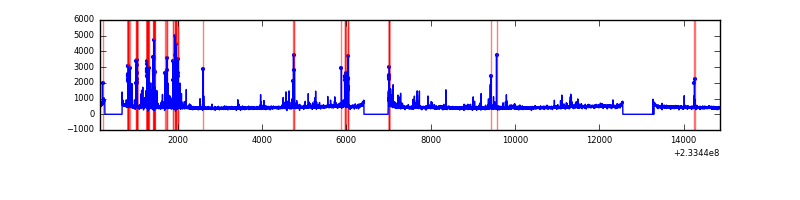 |
| D | 14705 | 12999 | 640 | 640 | 4.35% | 4.92% | 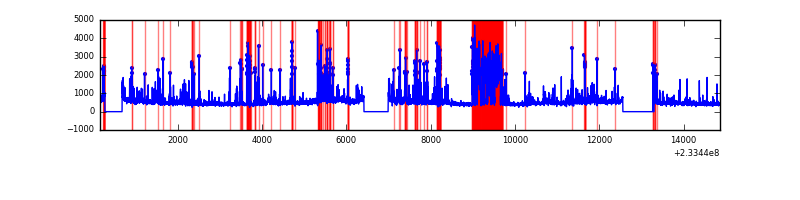 |
Top three noisy pixels from each quadrant. If the there are fewer than three noisy pixels in the level2.evt file, extra rows are filled as -1
| Pixel properties | Quadrant properties | ||||||
|---|---|---|---|---|---|---|---|
| Quadrant | DetID | PixID | Counts | Sigma | Mean | Median | Sigma |
| A | 8 | 5 | 754936 | 2479.6 | 1486 | 1451 | 303.9 |
| A | 15 | 174 | 62788 | 201.85 | 1486 | 1451 | 303.9 |
| A | 5 | 16 | 30122 | 94.35 | 1486 | 1451 | 303.9 |
| B | 10 | 16 | 2235682 | 8007.07 | 1463 | 1423 | 279.0 |
| B | 0 | 214 | 65209 | 228.59 | 1463 | 1423 | 279.0 |
| B | 4 | 173 | 54173 | 189.04 | 1463 | 1423 | 279.0 |
| C | 4 | 254 | 688739 | 2029.74 | 1453 | 1459 | 338.6 |
| C | 14 | 234 | 14512 | 38.55 | 1453 | 1459 | 338.6 |
| C | 13 | 61 | 11125 | 28.55 | 1453 | 1459 | 338.6 |
| D | 1 | 52 | 1165900 | 3295.14 | 1440 | 1392 | 353.4 |
| D | 8 | 195 | 417681 | 1177.95 | 1440 | 1392 | 353.4 |
| D | 13 | 104 | 378271 | 1066.43 | 1440 | 1392 | 353.4 |
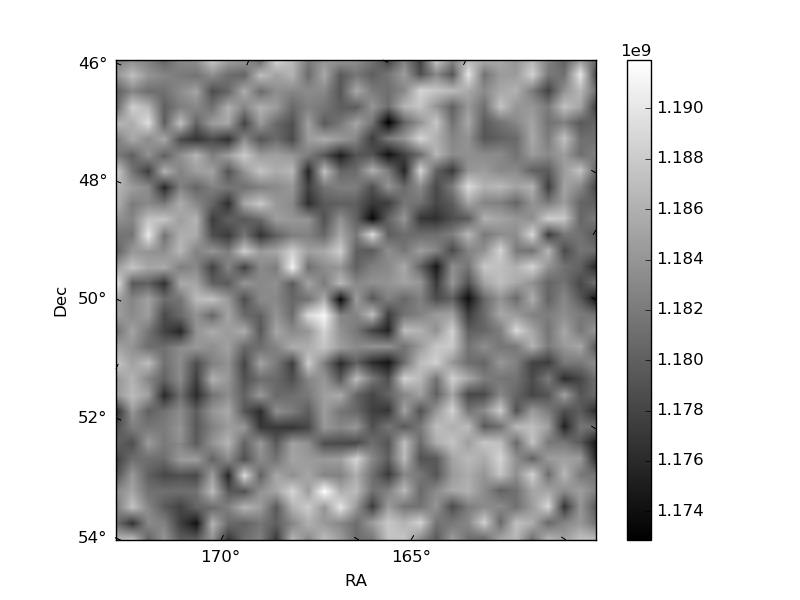
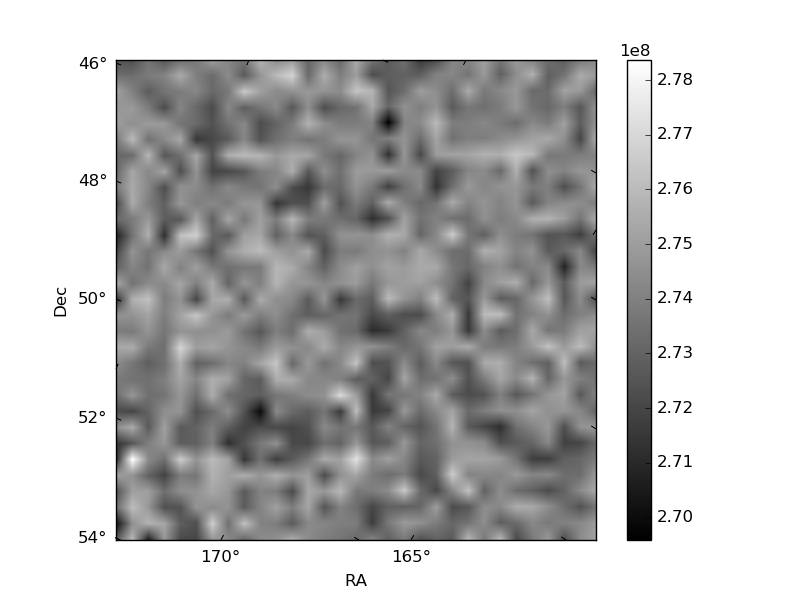
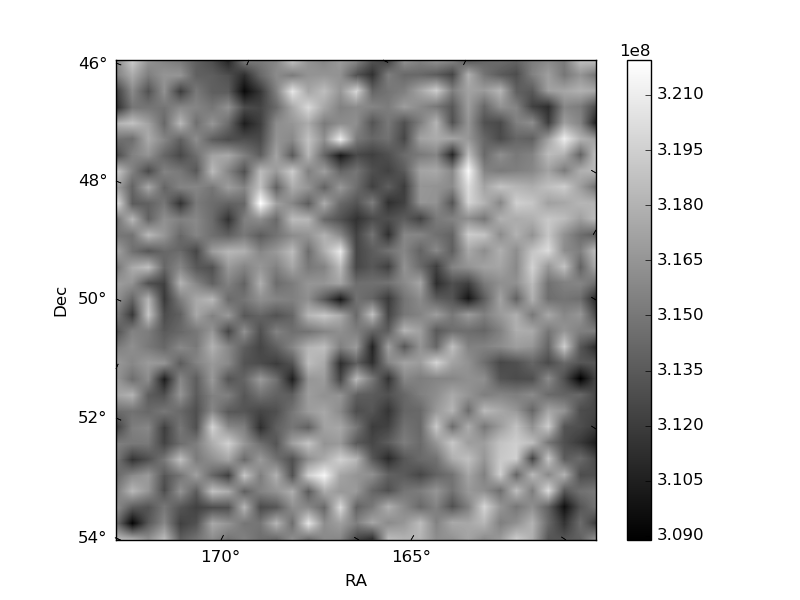
Histogram calculated using DETX and DETY for each event in the final _common_clean file
| Quadrant A | 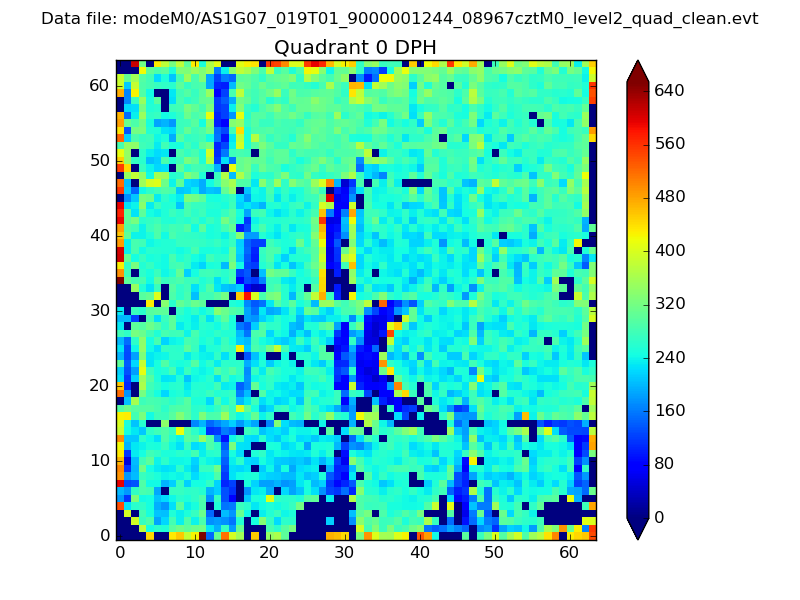 |
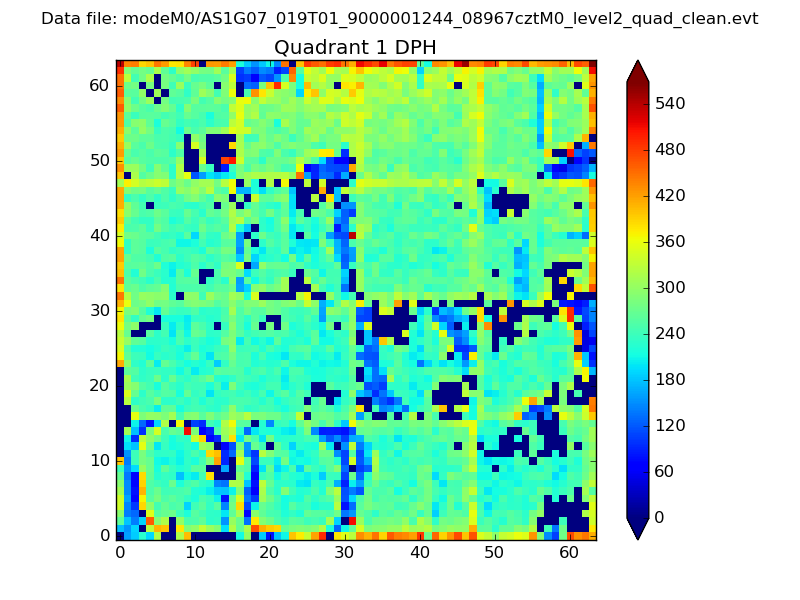 |
Quadrant B |
|---|---|---|---|
| Quadrant D | 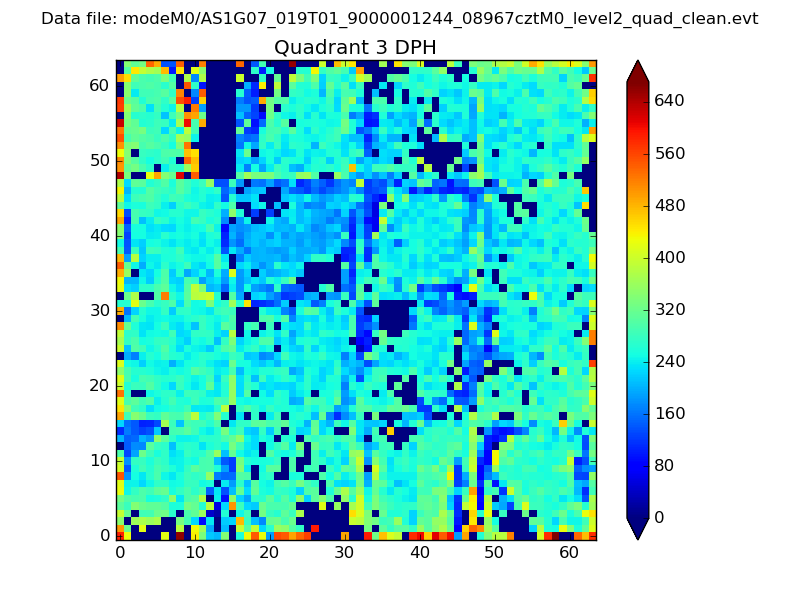 |
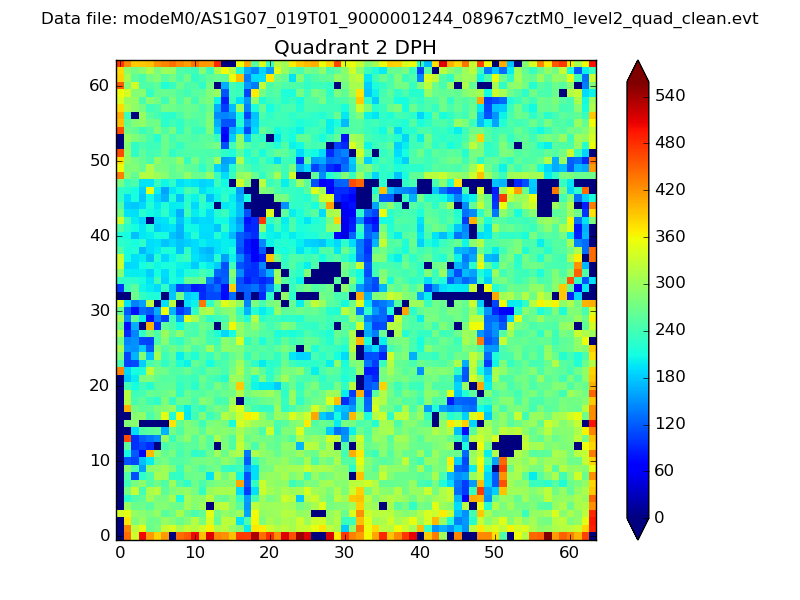 |
Quadrant C |
| Plot type | Count rate plots | Images |
|---|---|---|
| Comparison with Poisson distribution Blue bars denote a histogram of data divided into 1 sec bins. Red curve is a Poisson curve with rate = median count rate of data. |
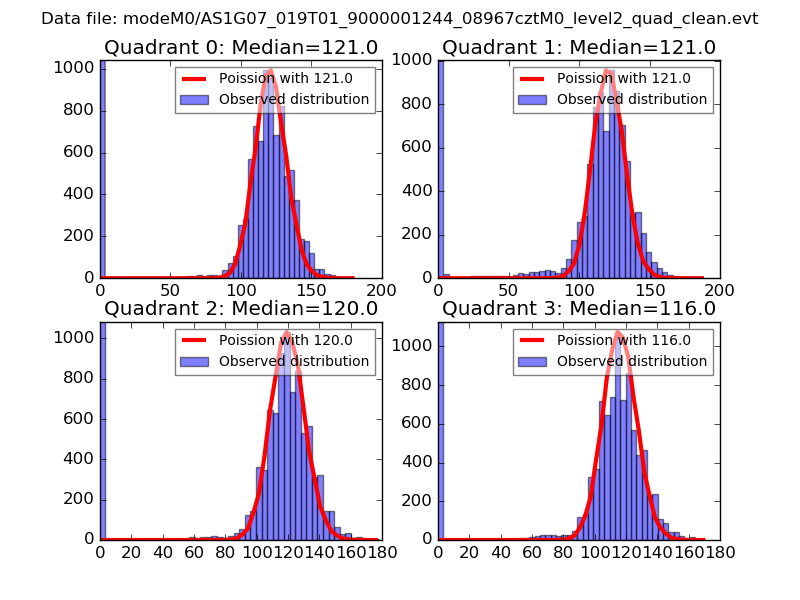 |
 |
| Quadrant-wise count rates Data is divided into 100 sec bins |
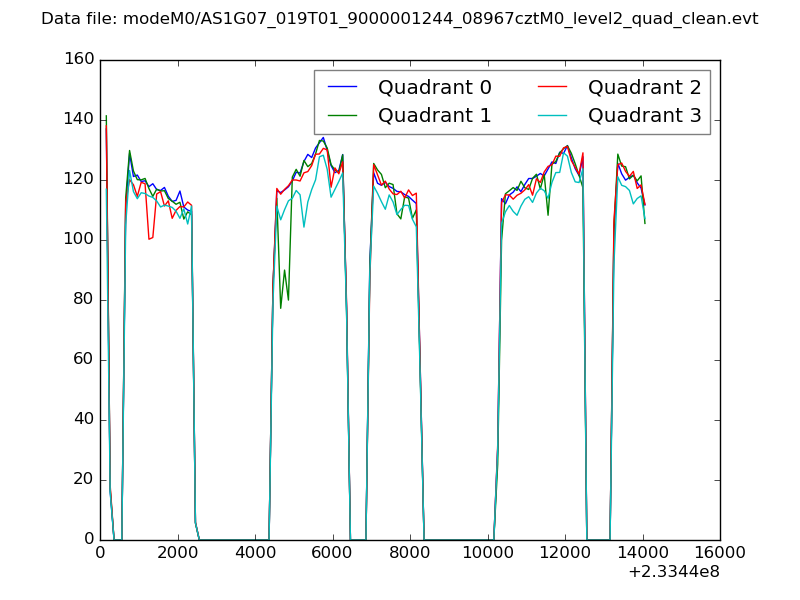 |
|
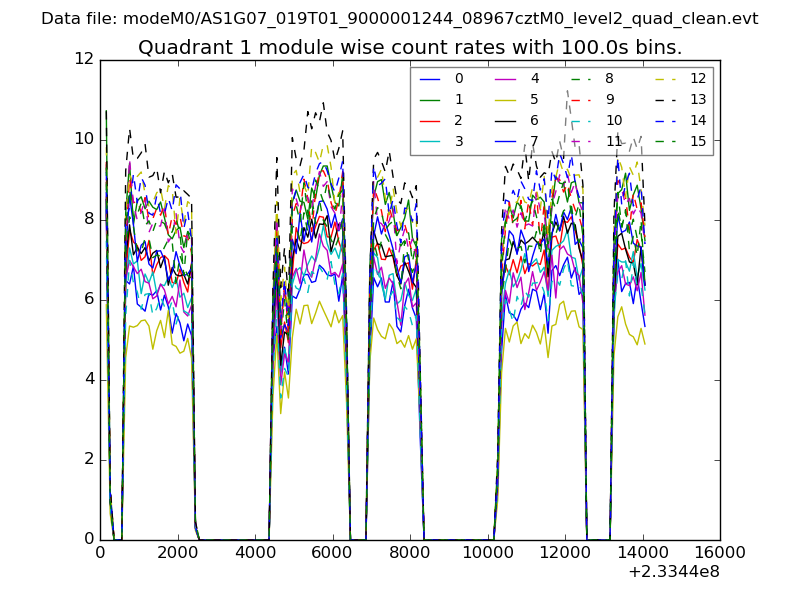
| Module-wise count rates for Quadrant A Data is divided into 100 sec bins |
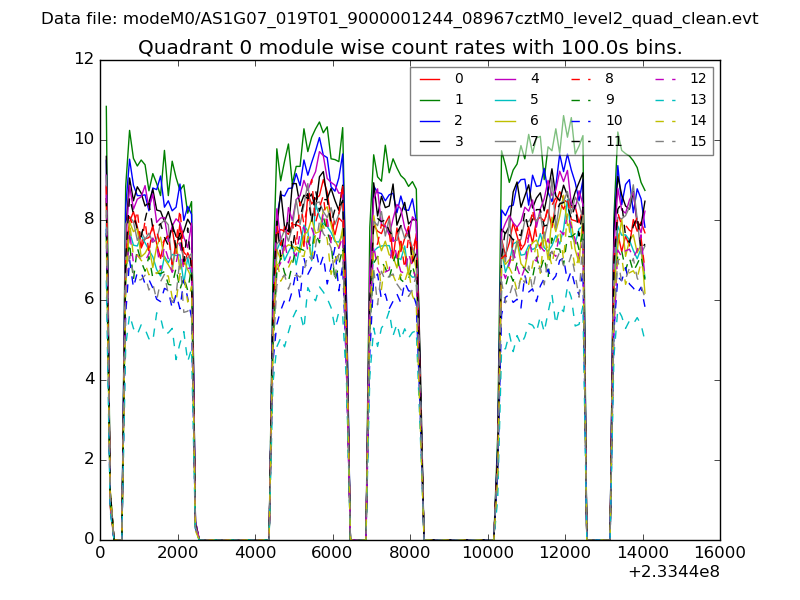 |
 |
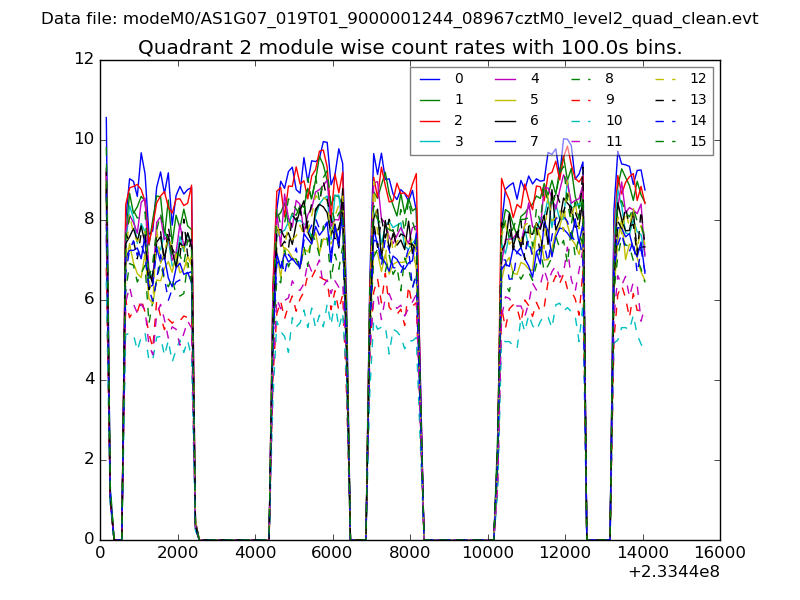
| Module-wise count rates for Quadrant B Data is divided into 100 sec bins |
 |
 |
| Module-wise count rates for Quadrant C Data is divided into 100 sec bins |
 |
 |
| Module-wise count rates for Quadrant D Data is divided into 100 sec bins |
 |
 |
| Parameter | Plot |
|---|---|
| CZT HV Monitor | 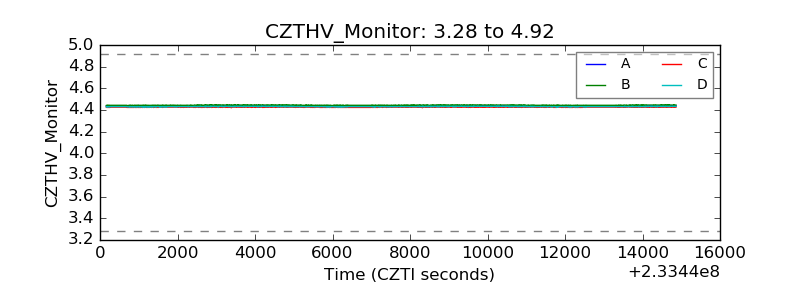 |
| D_VDD | 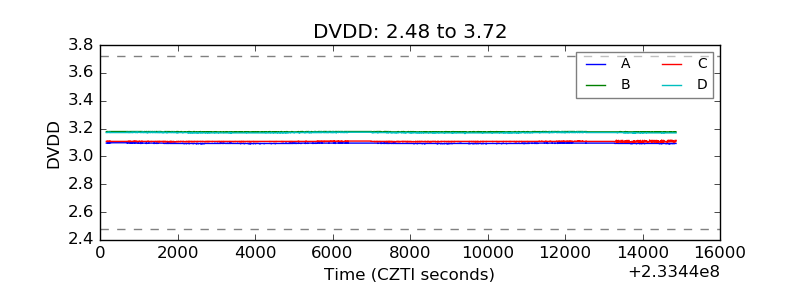 |
| Temperature 1 | 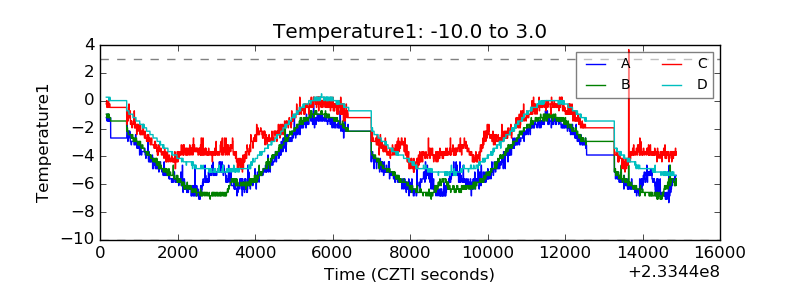 |
| Veto HV Monitor | 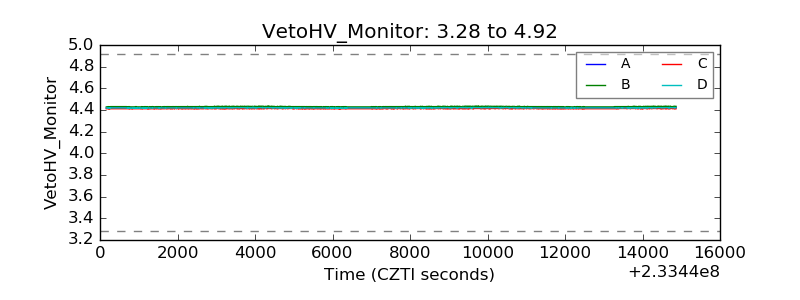 |
| Veto LLD | 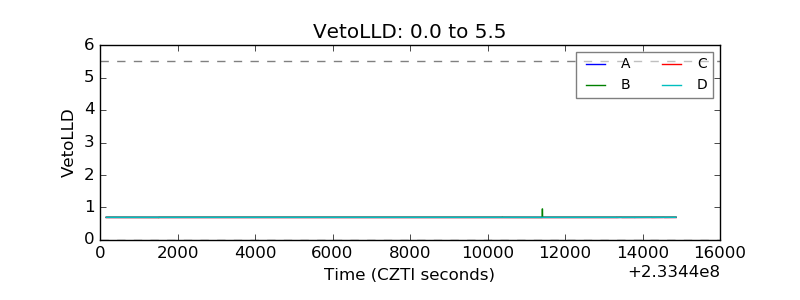 |
| Alpha Counter | 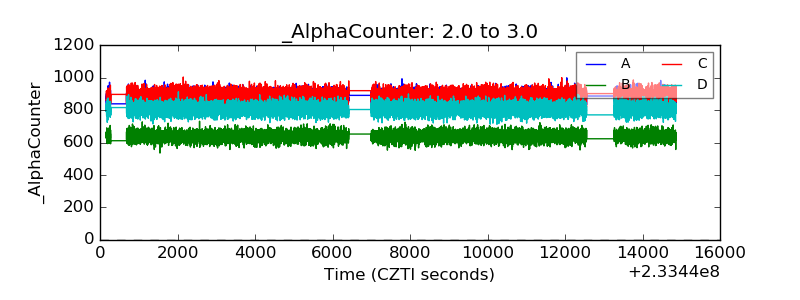 |
| _CPM_Rate | 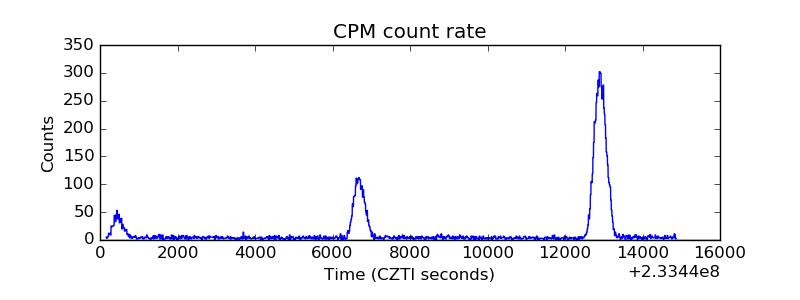 |
| CZT Counter | 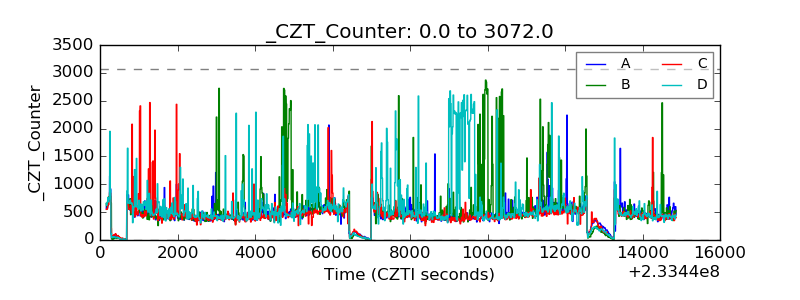 |
| +2.5 Volts monitor |  |
| +5 Volts monitor |  |
| _ROLL_ROT | 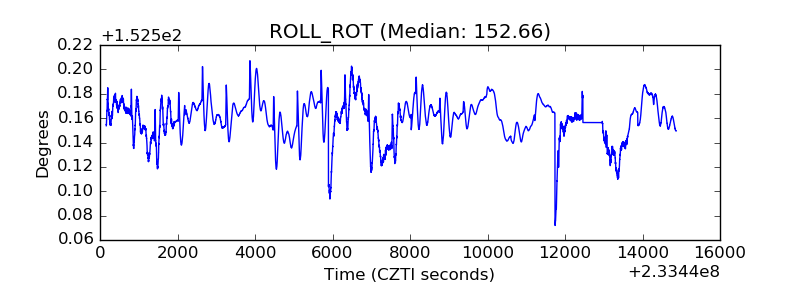 |
| _Roll_DEC |  |
| _Roll_RA | 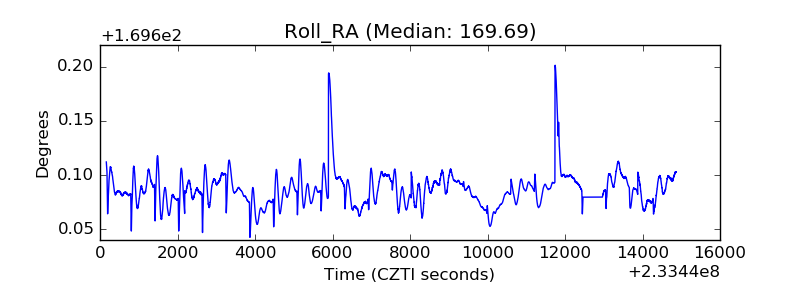 |
| Veto Counter |  |