| Param | Original file | Final file |
|---|---|---|
| Filename | modeM0/AS1G07_019T01_9000001244_08968cztM0_level2.evt | modeM0/AS1G07_019T01_9000001244_08968cztM0_level2_quad_clean.evt |
| Size (bytes) | 520,372,800 | 81,694,080 |
| Size | 496.3 MB | 77.9 MB |
| Events in quadrant A | 4,093,490 | 500,200 |
| Events in quadrant B | 4,317,475 | 491,651 |
| Events in quadrant C | 3,244,315 | 502,880 |
| Events in quadrant D | 3,620,304 | 482,333 |
| Mode M0 | |||
|---|---|---|---|
| Quadrant | BADHDUFLAG | Total packets | Discarded packets |
| A | 0 | 16865 | 3 |
| B | 0 | 17590 | 1 |
| C | 0 | 14602 | 1 |
| D | 0 | 15639 | 1 |
| Mode M9 | |||
|---|---|---|---|
| Quadrant | BADHDUFLAG | Total packets | Discarded packets |
| A | 0 | 17 | 0 |
| B | 0 | 17 | 0 |
| C | 0 | 17 | 0 |
| D | 0 | 17 | 0 |
| Mode SS | |||
|---|---|---|---|
| Quadrant | BADHDUFLAG | Total packets | Discarded packets |
| A | 0 | 148 | 0 |
| B | 0 | 148 | 0 |
| C | 0 | 148 | 0 |
| D | 0 | 148 | 0 |
| Quadrant | Total seconds | Saturated seconds | Saturation percentage |
|---|---|---|---|
| A | 7133 | 65 | 0.911258% |
| B | 7133 | 341 | 4.780597% |
| C | 7133 | 36 | 0.504696% |
| D | 7133 | 63 | 0.883219% |
Noise dominated data is calculated using 1-second bins in cleaned event files. If a bin has >2000 counts, and if more than 50% of those come from <1% of pixels, then it is considered to be noise-dominated and hence unusable.
| Quadrant | # 1 sec bins | Bins with >0 counts | Bins with >2000 counts | High rate bins dominated by noise | Noise dominated (total time) | Noise dominated (detector-on time) | Marked lightcurve |
|---|---|---|---|---|---|---|---|
| A | 8749 | 7137 | 6 | 6 | 0.07% | 0.08% | 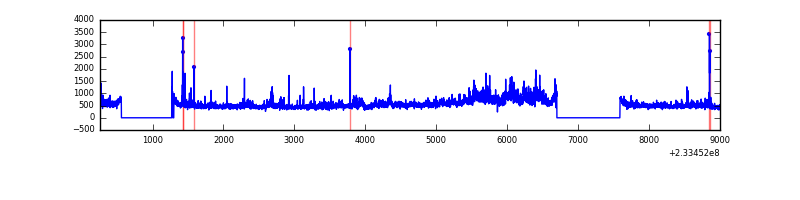 |
| B | 8749 | 7136 | 219 | 219 | 2.50% | 3.07% | 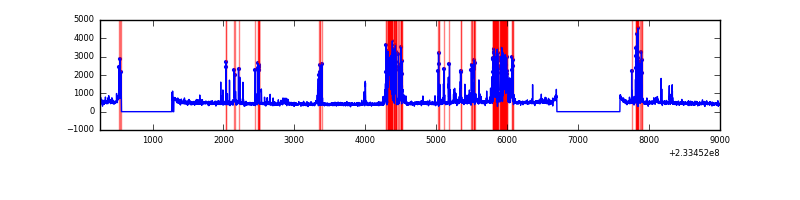 |
| C | 8749 | 7137 | 4 | 4 | 0.05% | 0.06% | 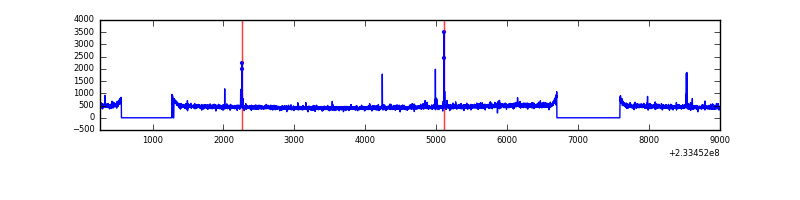 |
| D | 8749 | 7137 | 29 | 29 | 0.33% | 0.41% | 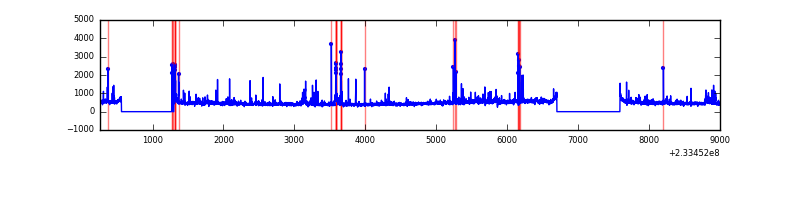 |
Top three noisy pixels from each quadrant. If the there are fewer than three noisy pixels in the level2.evt file, extra rows are filled as -1
| Pixel properties | Quadrant properties | ||||||
|---|---|---|---|---|---|---|---|
| Quadrant | DetID | PixID | Counts | Sigma | Mean | Median | Sigma |
| A | 8 | 5 | 872648 | 5130.76 | 826 | 805 | 169.9 |
| A | 5 | 16 | 20984 | 118.75 | 826 | 805 | 169.9 |
| A | 13 | 248 | 9893 | 53.48 | 826 | 805 | 169.9 |
| B | 10 | 16 | 1005108 | 6398.13 | 822 | 802 | 157.0 |
| B | 0 | 214 | 34979 | 217.73 | 822 | 802 | 157.0 |
| B | 0 | 168 | 17024 | 103.35 | 822 | 802 | 157.0 |
| C | 4 | 254 | 37435 | 193.46 | 811 | 815 | 189.3 |
| C | 14 | 234 | 13460 | 66.8 | 811 | 815 | 189.3 |
| C | 8 | 128 | 11115 | 54.41 | 811 | 815 | 189.3 |
| D | 8 | 195 | 156143 | 788.99 | 806 | 782 | 196.9 |
| D | 2 | 14 | 97001 | 488.64 | 806 | 782 | 196.9 |
| D | 7 | 71 | 91860 | 462.53 | 806 | 782 | 196.9 |
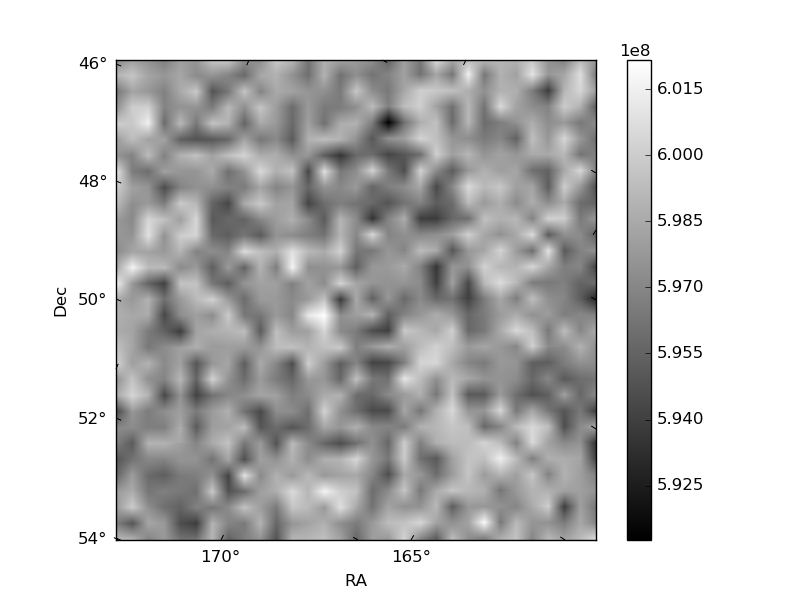
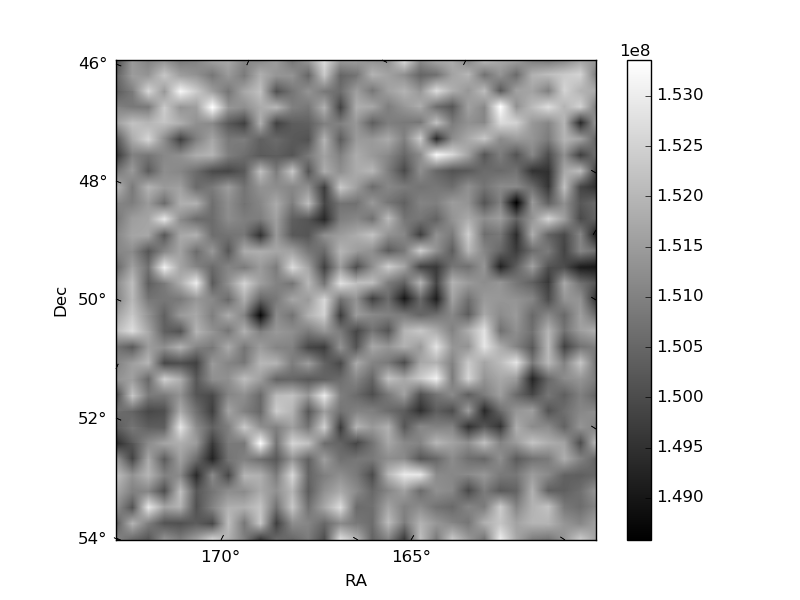
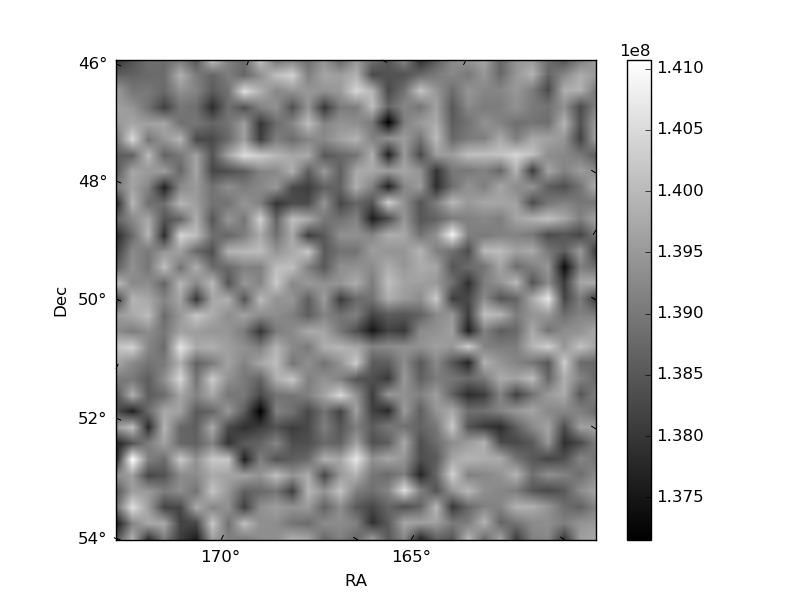
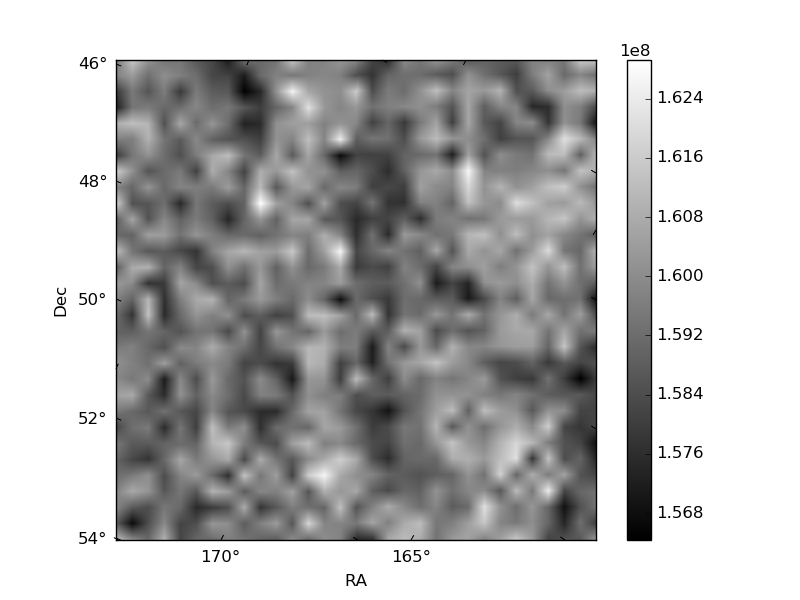
Histogram calculated using DETX and DETY for each event in the final _common_clean file
| Quadrant A | 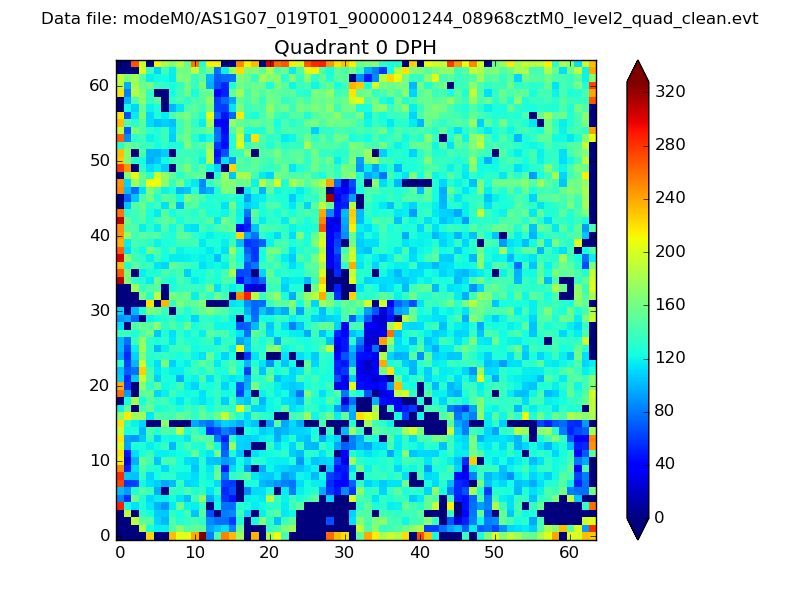 |
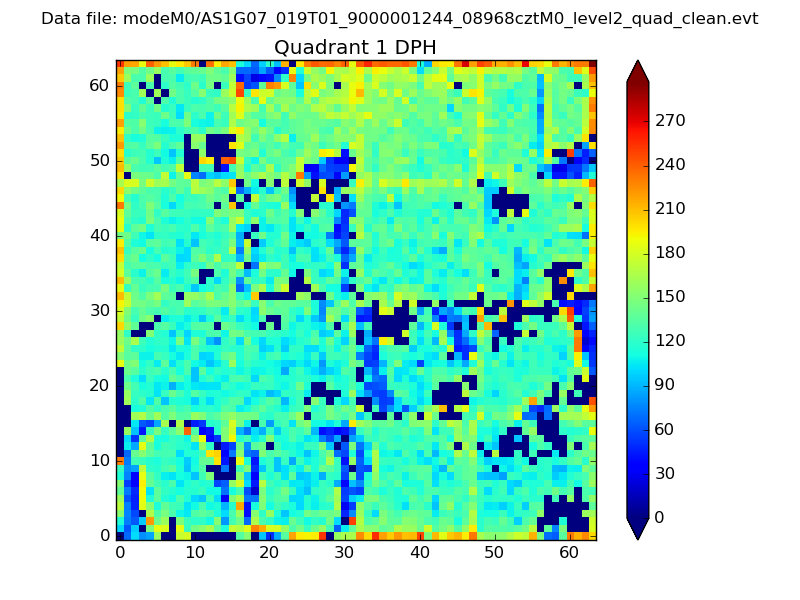 |
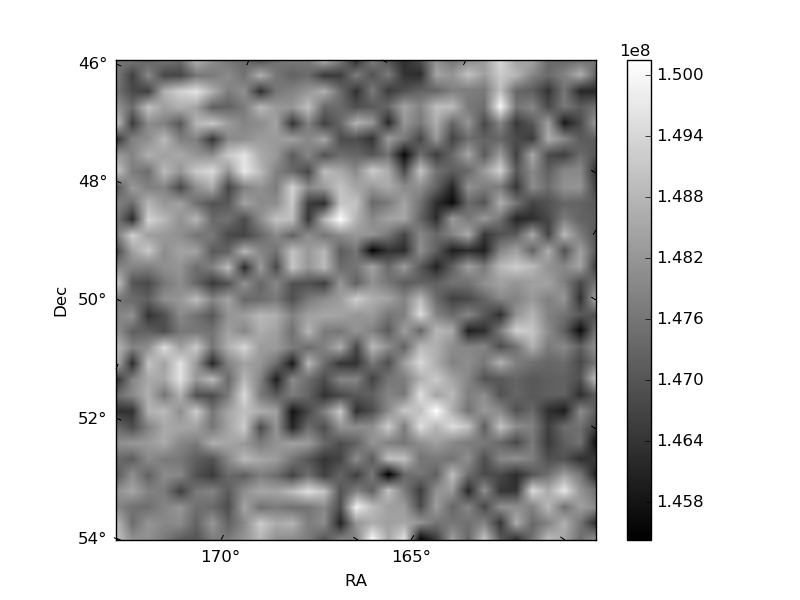
Quadrant B |
|---|---|---|---|
| Quadrant D | 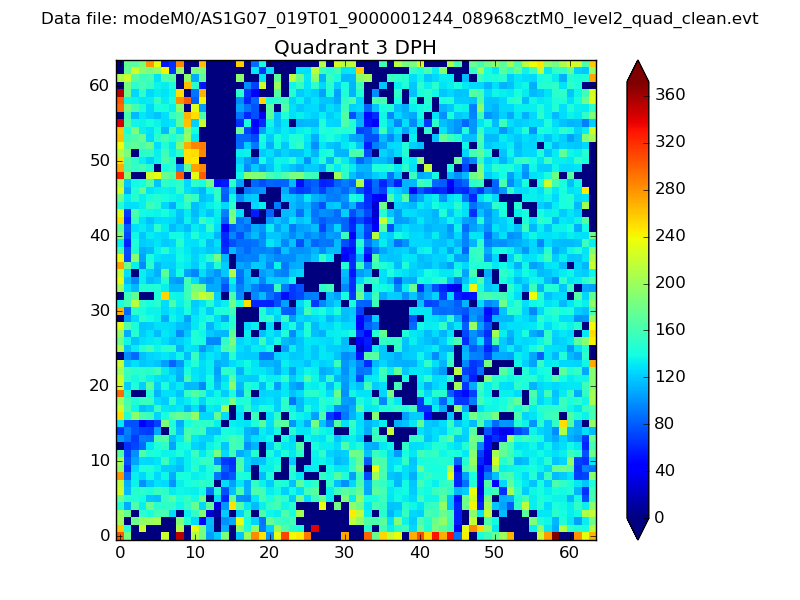 |
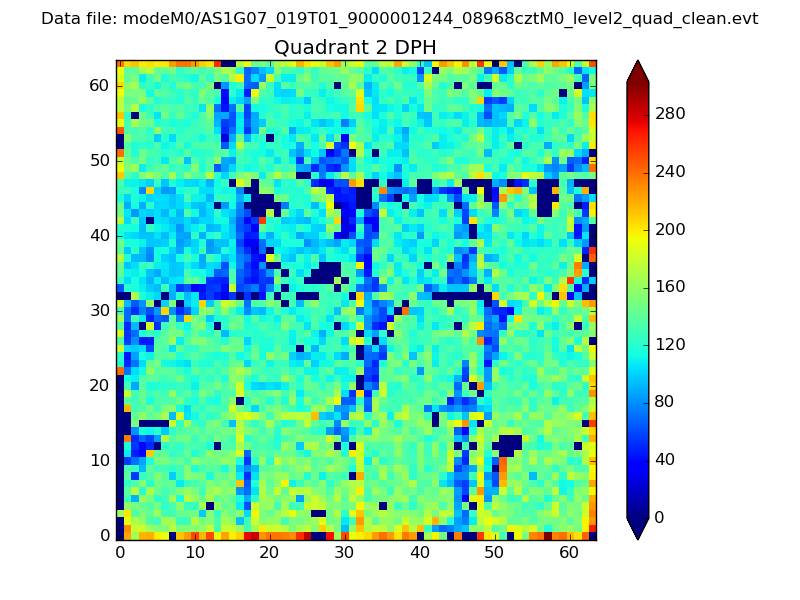 |
Quadrant C |
| Plot type | Count rate plots | Images |
|---|---|---|
| Comparison with Poisson distribution Blue bars denote a histogram of data divided into 1 sec bins. Red curve is a Poisson curve with rate = median count rate of data. |
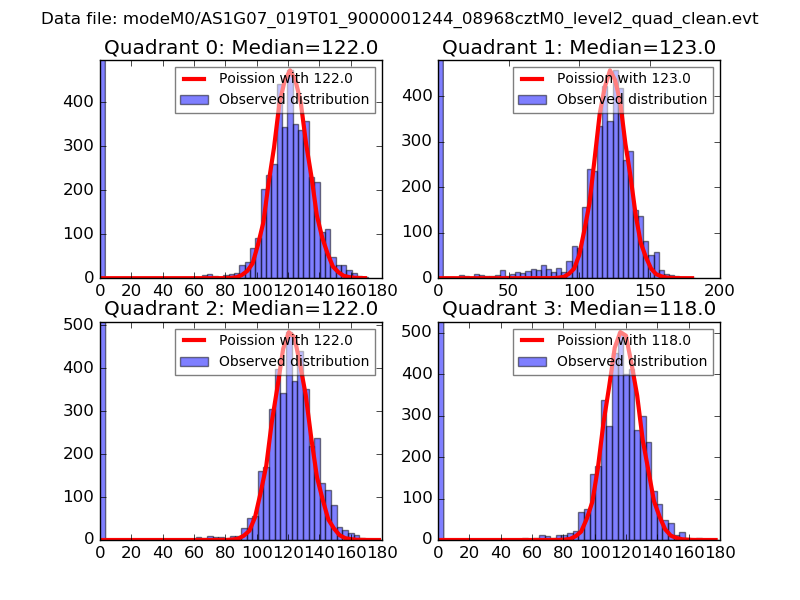 |
 |
| Quadrant-wise count rates Data is divided into 100 sec bins |
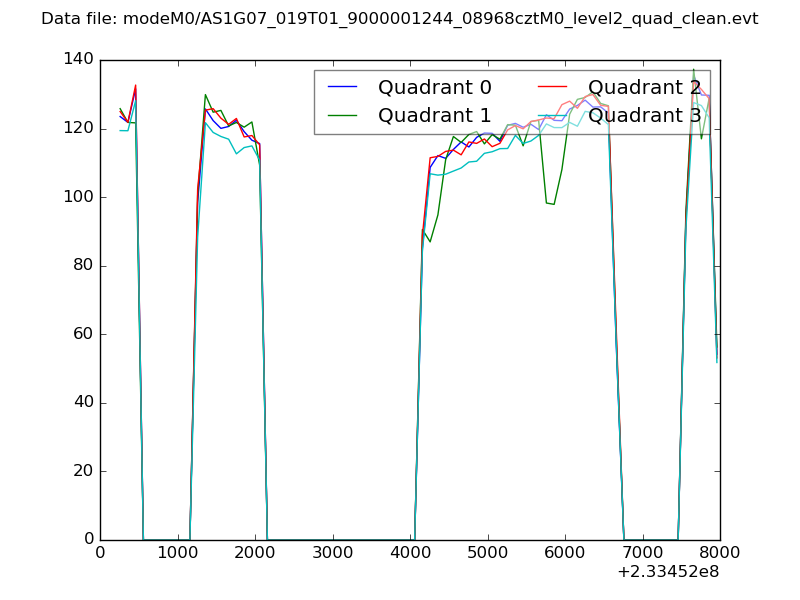 |
|
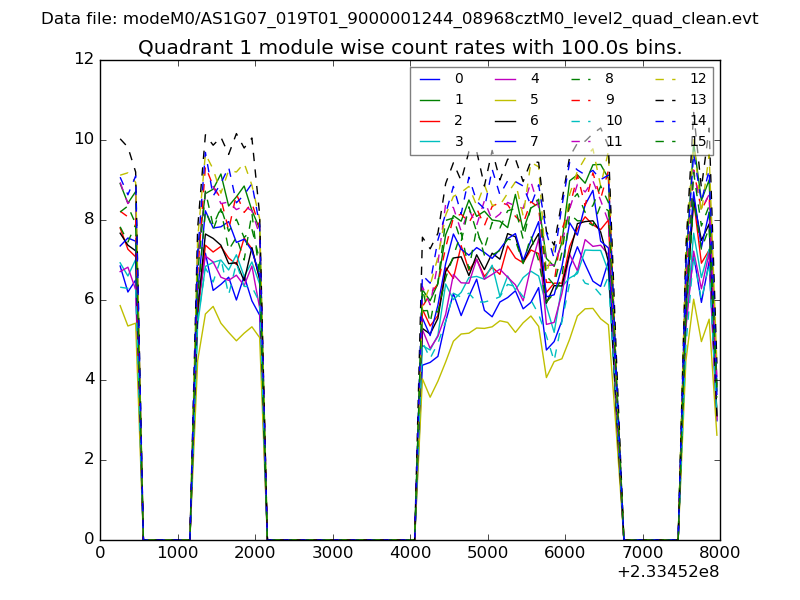
| Module-wise count rates for Quadrant A Data is divided into 100 sec bins |
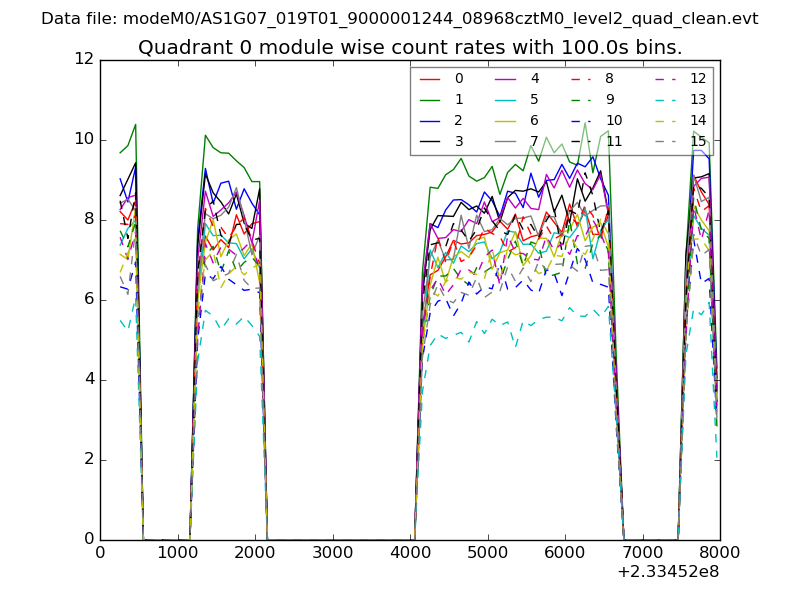 |
 |
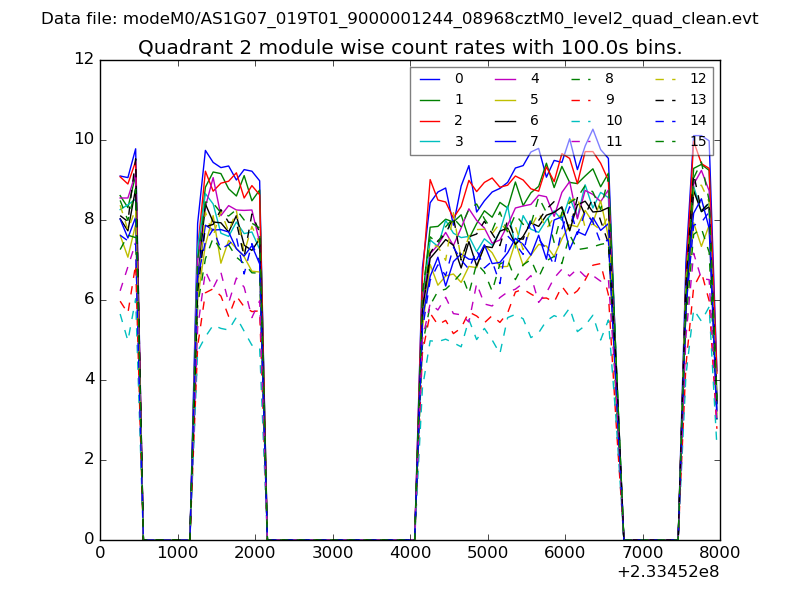
| Module-wise count rates for Quadrant B Data is divided into 100 sec bins |
 |
 |
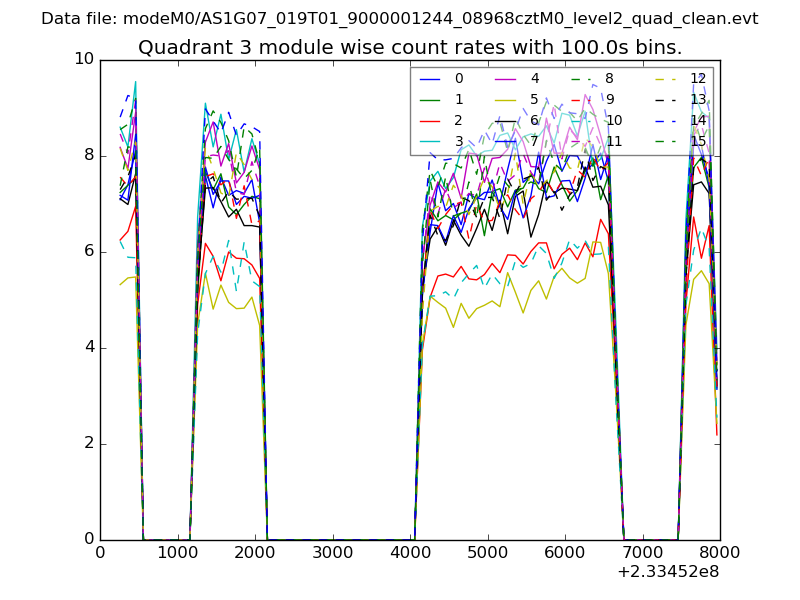
| Module-wise count rates for Quadrant C Data is divided into 100 sec bins |
 |
 |
| Module-wise count rates for Quadrant D Data is divided into 100 sec bins |
 |
 |
| Parameter | Plot |
|---|---|
| CZT HV Monitor | 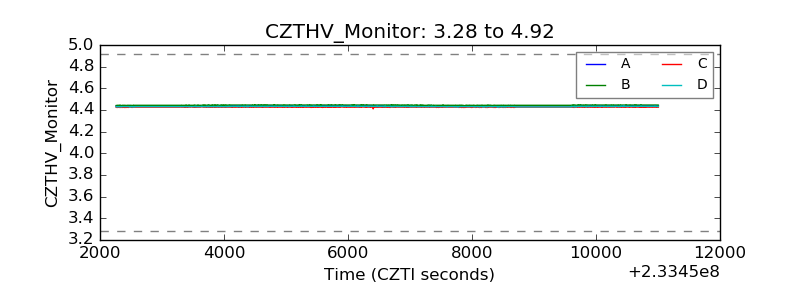 |
| D_VDD | 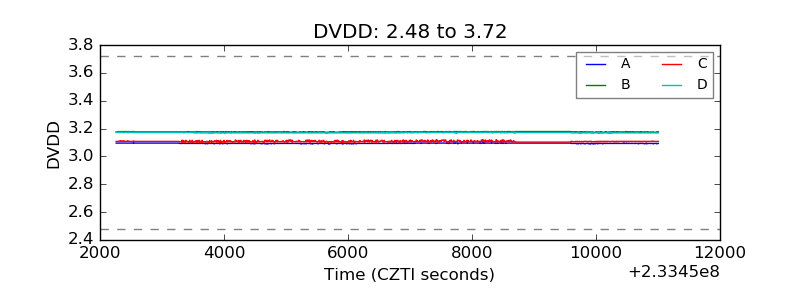 |
| Temperature 1 | 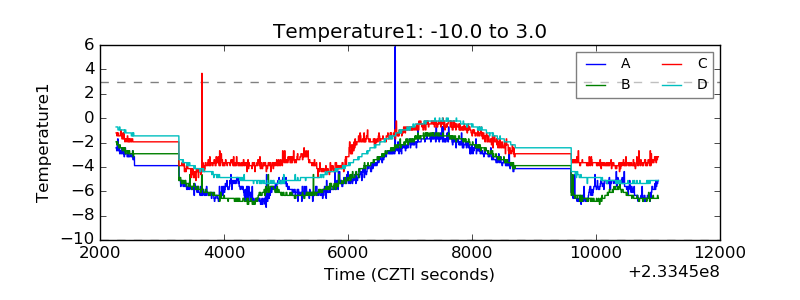 |
| Veto HV Monitor | 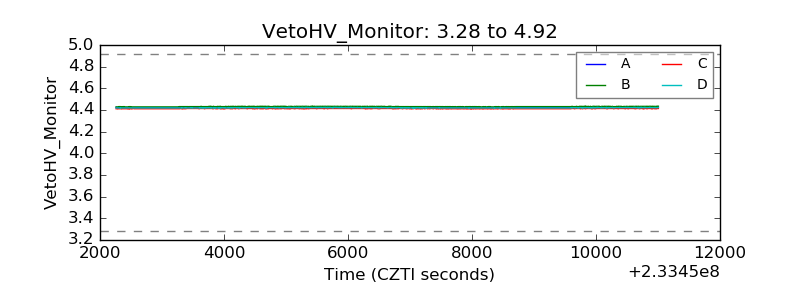 |
| Veto LLD | 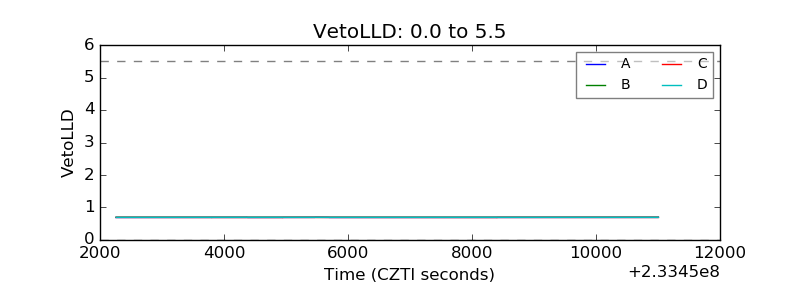 |
| Alpha Counter | 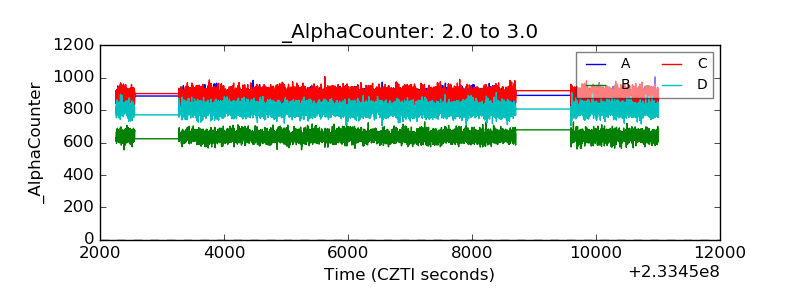 |
| _CPM_Rate | 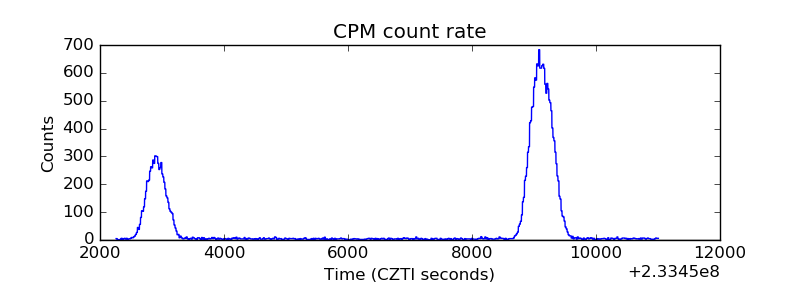 |
| CZT Counter | 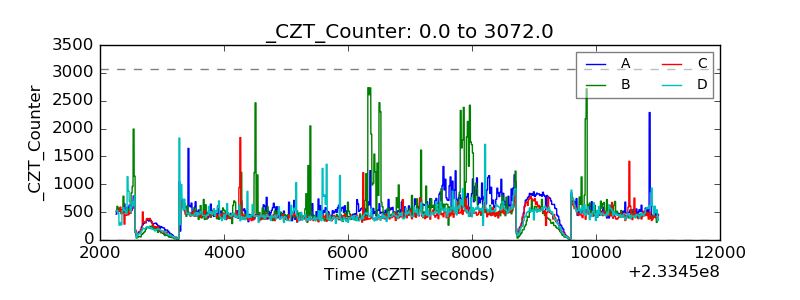 |
| +2.5 Volts monitor | 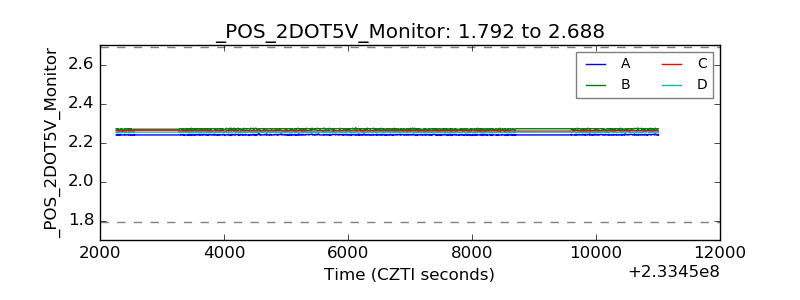 |
| +5 Volts monitor | 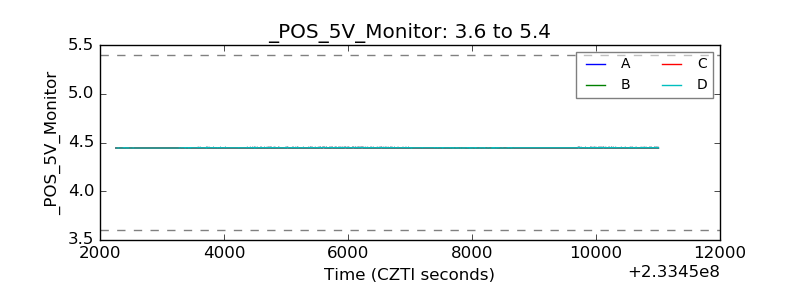 |
| _ROLL_ROT | 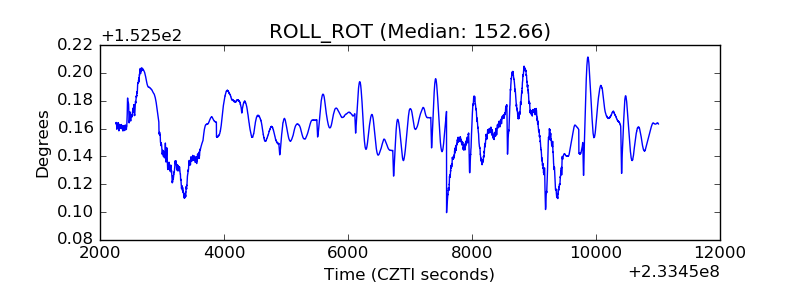 |
| _Roll_DEC | 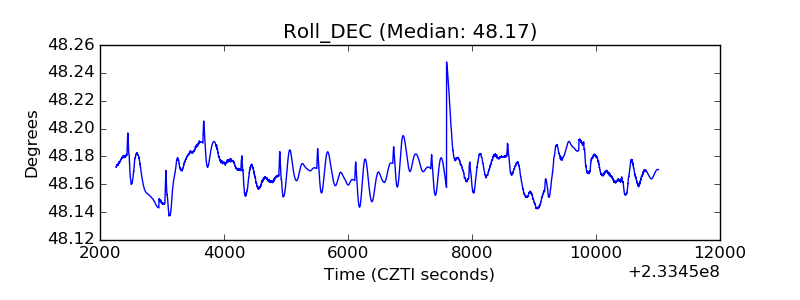 |
| _Roll_RA | 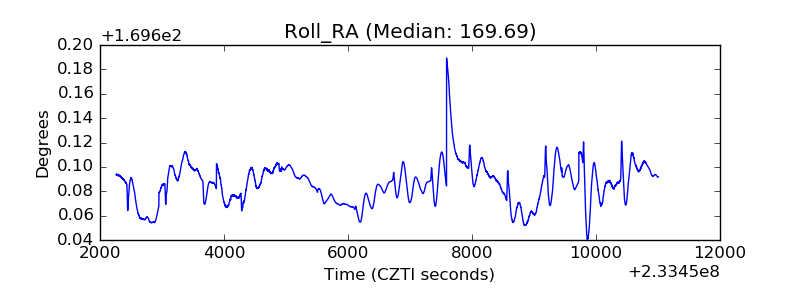 |
| Veto Counter | 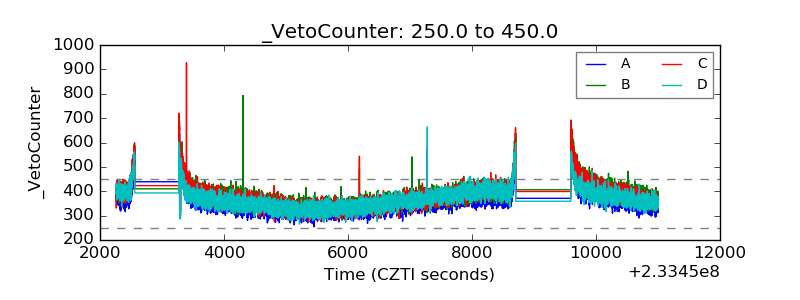 |