| Param | Original file | Final file |
|---|---|---|
| Filename | modeM0/AS1G07_019T01_9000001244_08972cztM0_level2.evt | modeM0/AS1G07_019T01_9000001244_08972cztM0_level2_quad_clean.evt |
| Size (bytes) | 539,104,320 | 77,535,360 |
| Size | 514.1 MB | 73.9 MB |
| Events in quadrant A | 4,558,721 | 476,458 |
| Events in quadrant B | 3,619,365 | 489,739 |
| Events in quadrant C | 3,278,638 | 478,744 |
| Events in quadrant D | 4,426,102 | 445,958 |
| Mode M0 | |||
|---|---|---|---|
| Quadrant | BADHDUFLAG | Total packets | Discarded packets |
| A | 0 | 17790 | 3 |
| B | 0 | 14819 | 2 |
| C | 0 | 13885 | 2 |
| D | 0 | 17337 | 2 |
| Mode M9 | |||
|---|---|---|---|
| Quadrant | BADHDUFLAG | Total packets | Discarded packets |
| A | 0 | 23 | 0 |
| B | 0 | 23 | 0 |
| C | 0 | 23 | 0 |
| D | 0 | 23 | 0 |
| Mode SS | |||
|---|---|---|---|
| Quadrant | BADHDUFLAG | Total packets | Discarded packets |
| A | 0 | 136 | 0 |
| B | 0 | 136 | 0 |
| C | 0 | 136 | 0 |
| D | 0 | 136 | 0 |
| Quadrant | Total seconds | Saturated seconds | Saturation percentage |
|---|---|---|---|
| A | 6545 | 248 | 3.789152% |
| B | 6545 | 220 | 3.361345% |
| C | 6545 | 86 | 1.313980% |
| D | 6545 | 373 | 5.699007% |
Noise dominated data is calculated using 1-second bins in cleaned event files. If a bin has >2000 counts, and if more than 50% of those come from <1% of pixels, then it is considered to be noise-dominated and hence unusable.
| Quadrant | # 1 sec bins | Bins with >0 counts | Bins with >2000 counts | High rate bins dominated by noise | Noise dominated (total time) | Noise dominated (detector-on time) | Marked lightcurve |
|---|---|---|---|---|---|---|---|
| A | 8895 | 6546 | 118 | 118 | 1.33% | 1.80% | 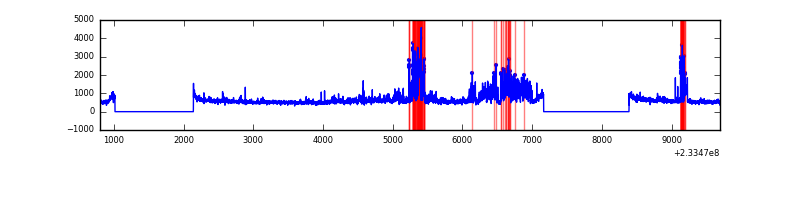 |
| B | 8895 | 6546 | 36 | 36 | 0.40% | 0.55% | 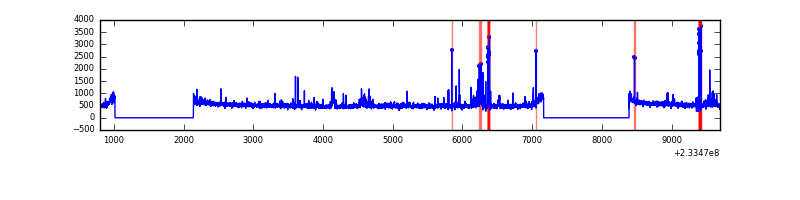 |
| C | 8895 | 6547 | 8 | 8 | 0.09% | 0.12% | 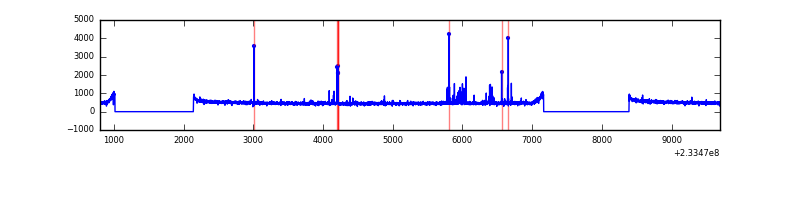 |
| D | 8895 | 6545 | 282 | 282 | 3.17% | 4.31% | 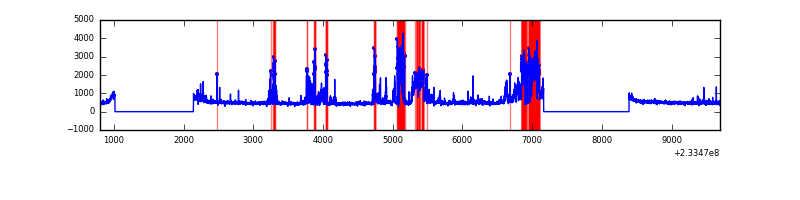 |
Top three noisy pixels from each quadrant. If the there are fewer than three noisy pixels in the level2.evt file, extra rows are filled as -1
| Pixel properties | Quadrant properties | ||||||
|---|---|---|---|---|---|---|---|
| Quadrant | DetID | PixID | Counts | Sigma | Mean | Median | Sigma |
| A | 8 | 5 | 941345 | 5572.92 | 838 | 819 | 168.8 |
| A | 5 | 16 | 268769 | 1587.69 | 838 | 819 | 168.8 |
| A | 15 | 174 | 111022 | 652.99 | 838 | 819 | 168.8 |
| B | 10 | 16 | 282978 | 1796.66 | 836 | 817 | 157.0 |
| B | 0 | 219 | 28990 | 179.39 | 836 | 817 | 157.0 |
| B | 0 | 214 | 26926 | 166.25 | 836 | 817 | 157.0 |
| C | 4 | 254 | 123404 | 663.97 | 805 | 811 | 184.6 |
| C | 14 | 67 | 17015 | 87.76 | 805 | 811 | 184.6 |
| C | 13 | 61 | 6304 | 29.75 | 805 | 811 | 184.6 |
| D | 1 | 52 | 850069 | 4044.51 | 792 | 773 | 210.0 |
| D | 13 | 29 | 358546 | 1703.78 | 792 | 773 | 210.0 |
| D | 6 | 225 | 62595 | 294.41 | 792 | 773 | 210.0 |
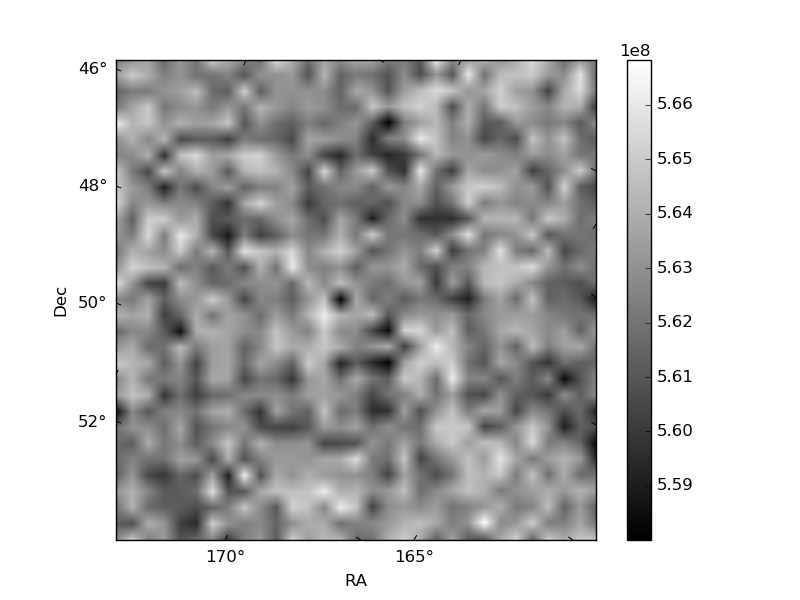
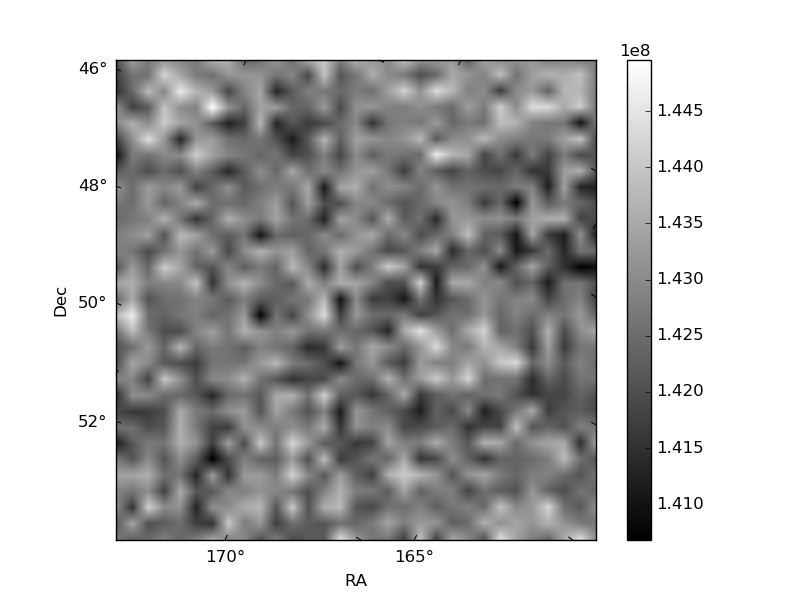
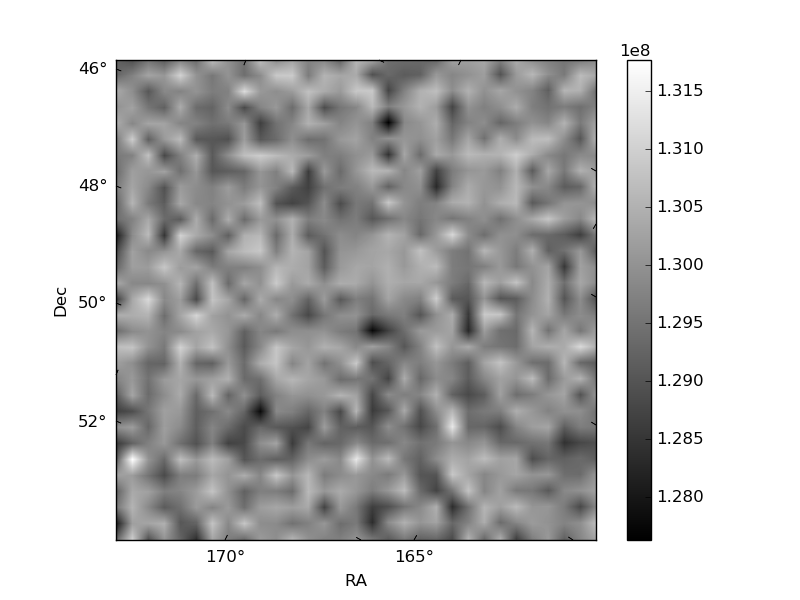
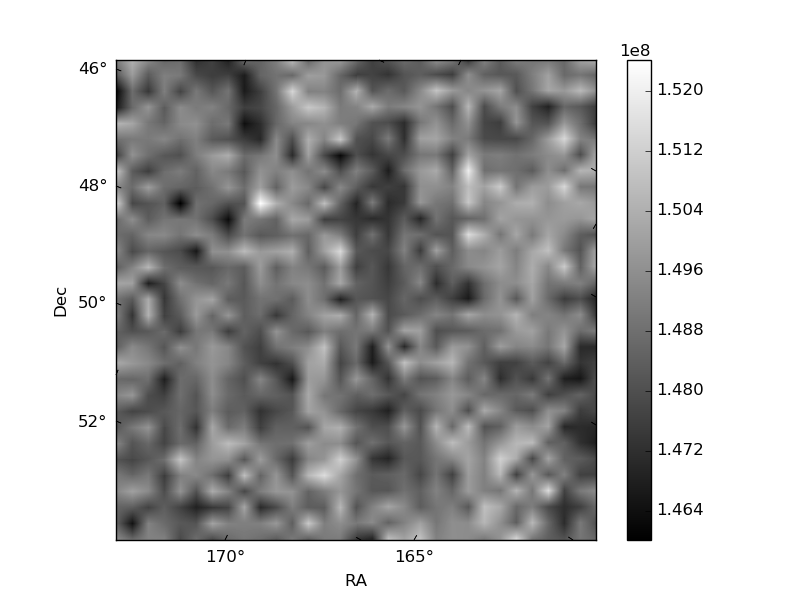
Histogram calculated using DETX and DETY for each event in the final _common_clean file
| Quadrant A | 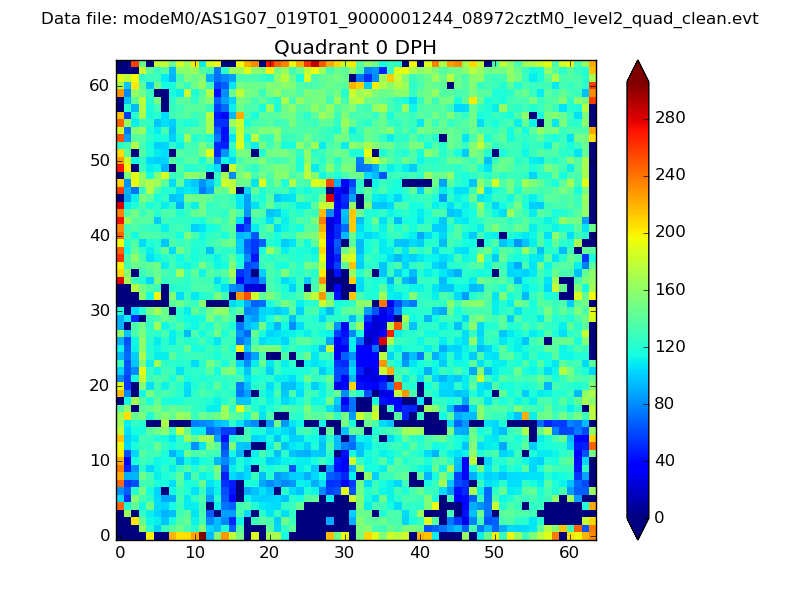 |
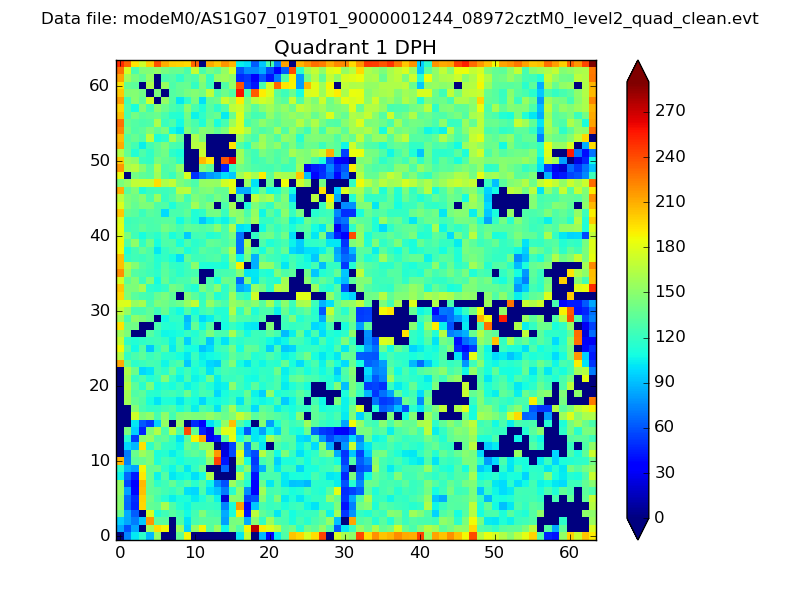 |
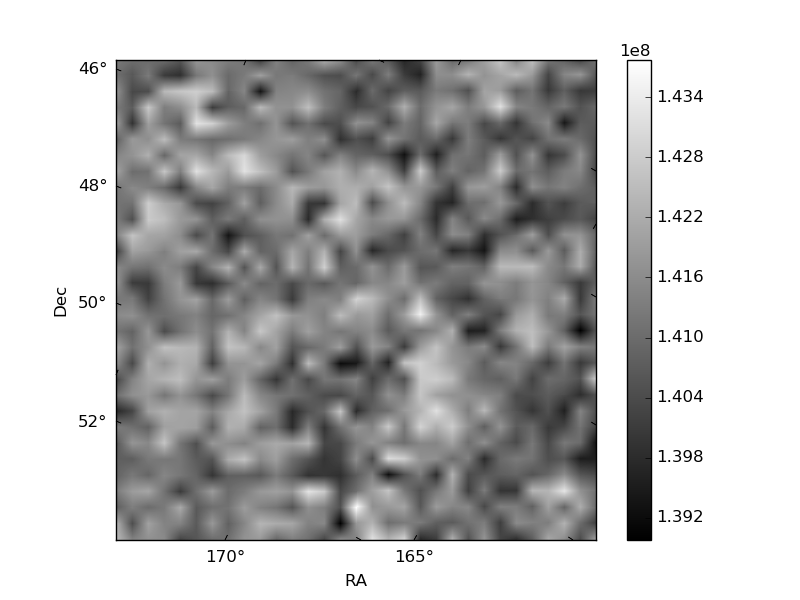
Quadrant B |
|---|---|---|---|
| Quadrant D | 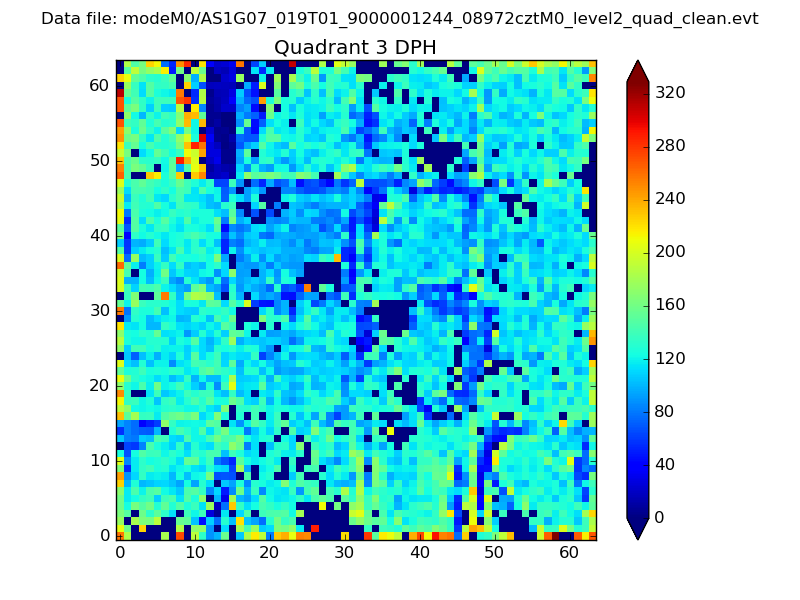 |
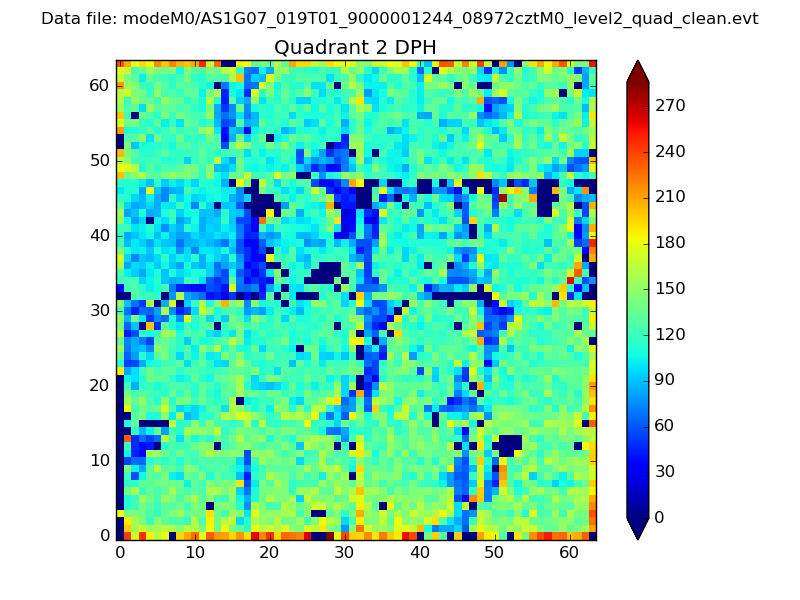 |
Quadrant C |
| Plot type | Count rate plots | Images |
|---|---|---|
| Comparison with Poisson distribution Blue bars denote a histogram of data divided into 1 sec bins. Red curve is a Poisson curve with rate = median count rate of data. |
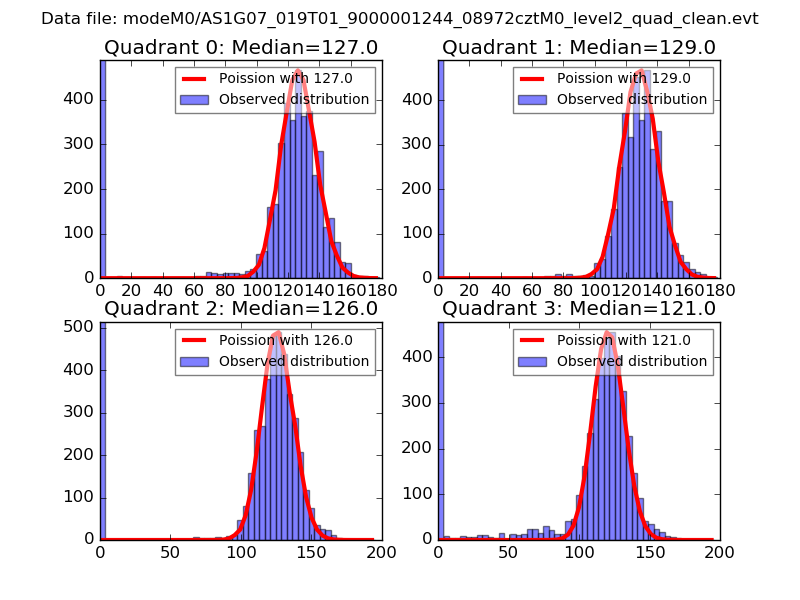 |
 |
| Quadrant-wise count rates Data is divided into 100 sec bins |
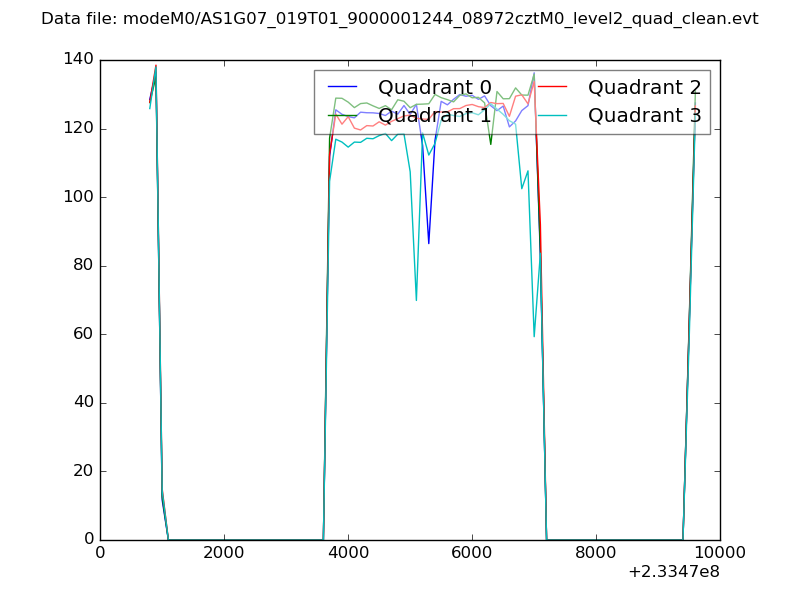 |
|
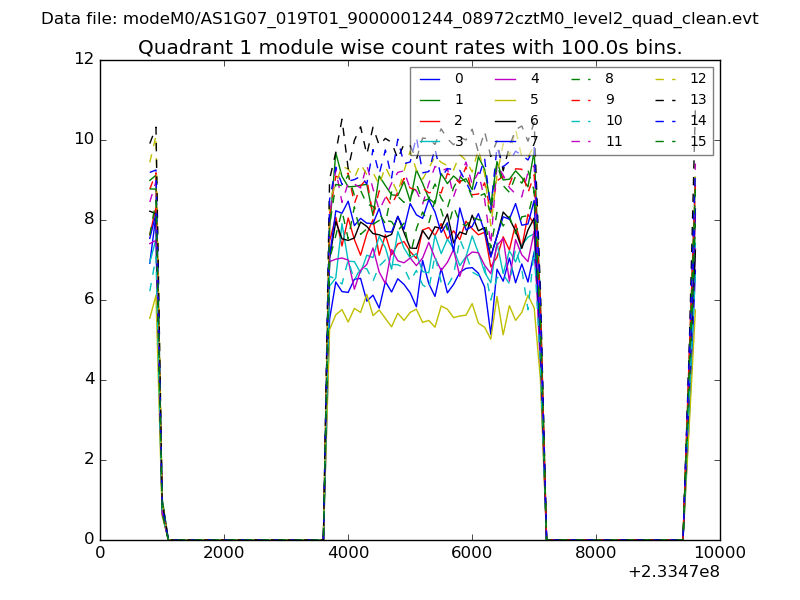
| Module-wise count rates for Quadrant A Data is divided into 100 sec bins |
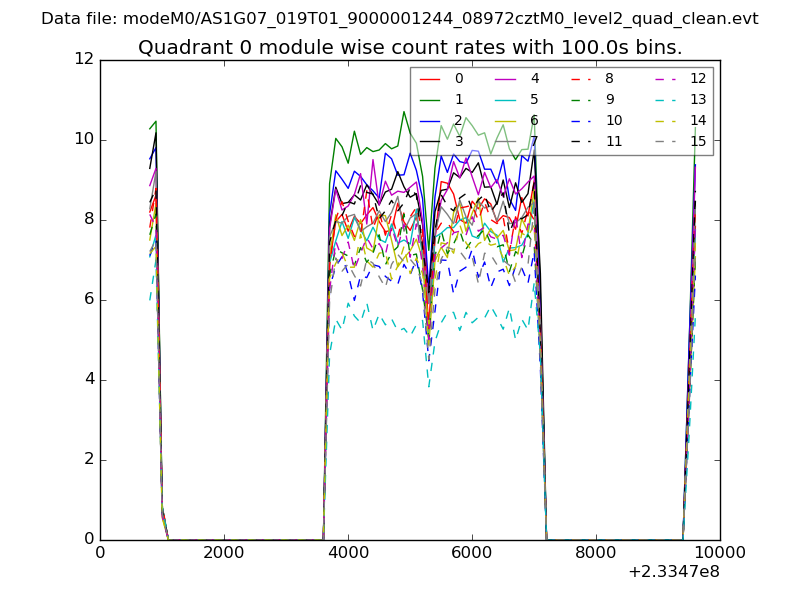 |
 |
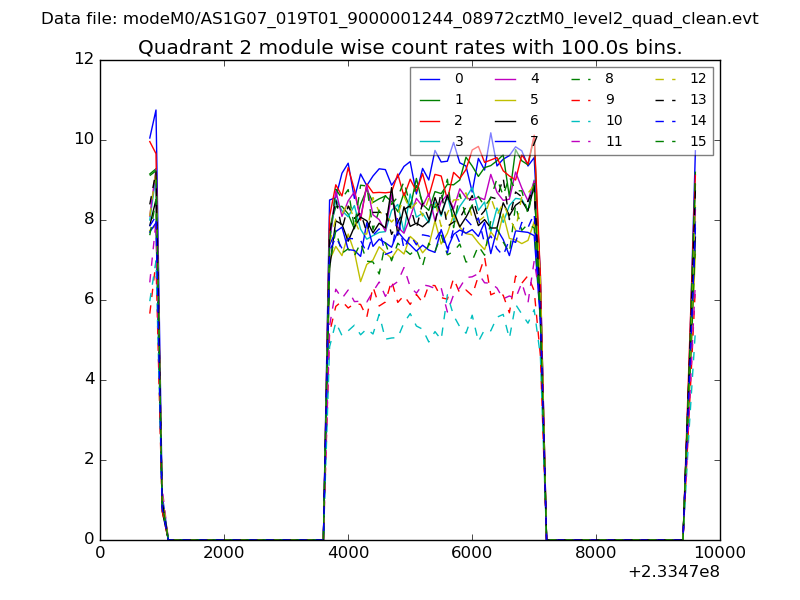
| Module-wise count rates for Quadrant B Data is divided into 100 sec bins |
 |
 |
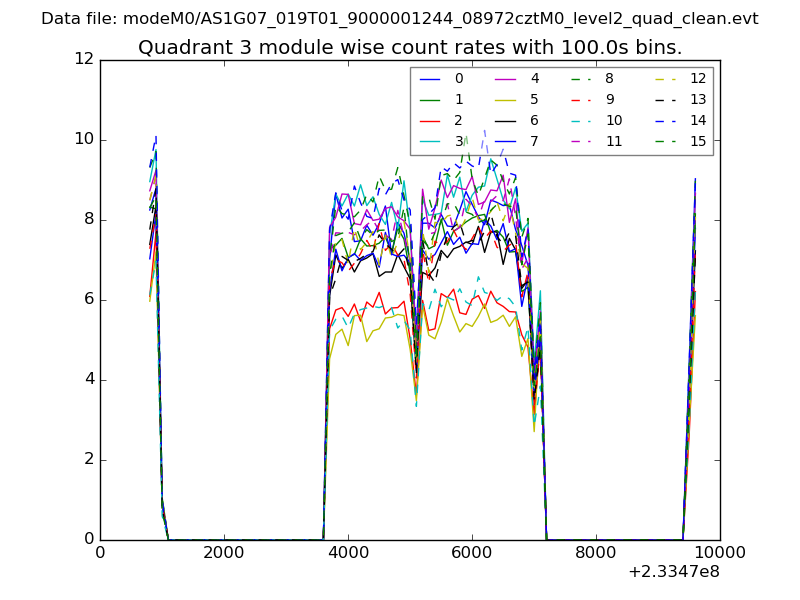
| Module-wise count rates for Quadrant C Data is divided into 100 sec bins |
 |
 |
| Module-wise count rates for Quadrant D Data is divided into 100 sec bins |
 |
 |
| Parameter | Plot |
|---|---|
| CZT HV Monitor | 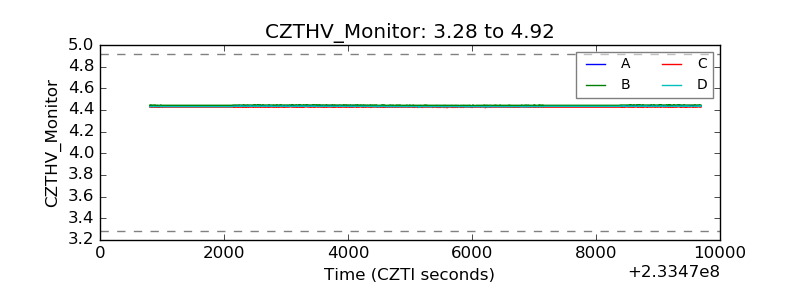 |
| D_VDD | 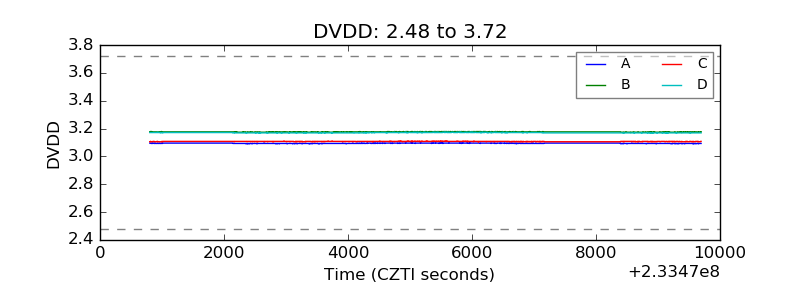 |
| Temperature 1 | 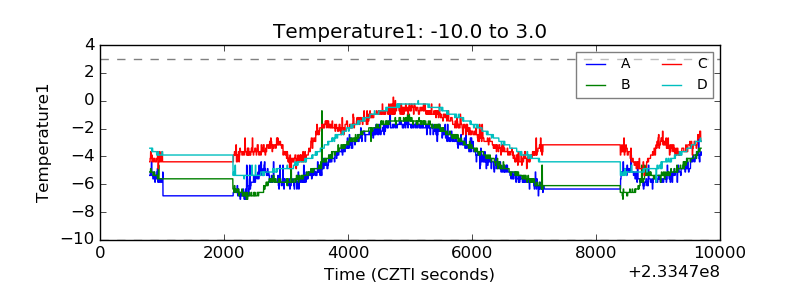 |
| Veto HV Monitor | 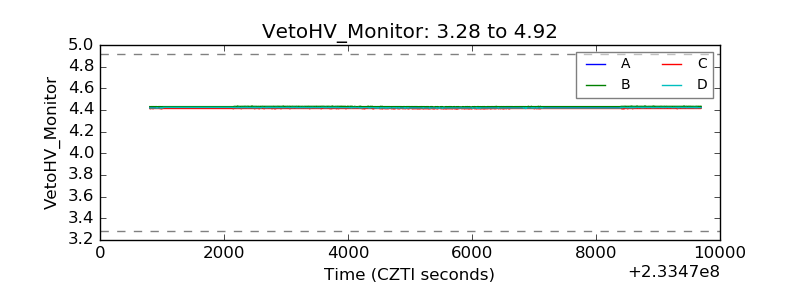 |
| Veto LLD | 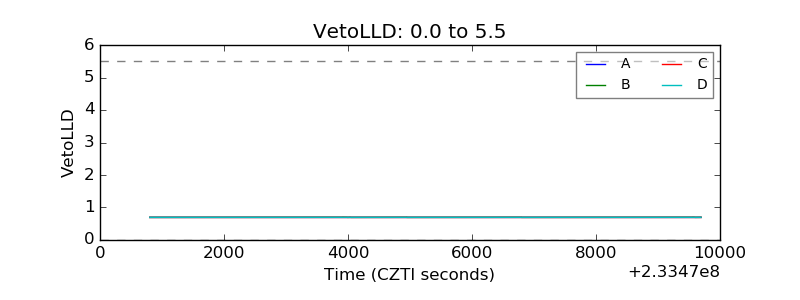 |
| Alpha Counter | 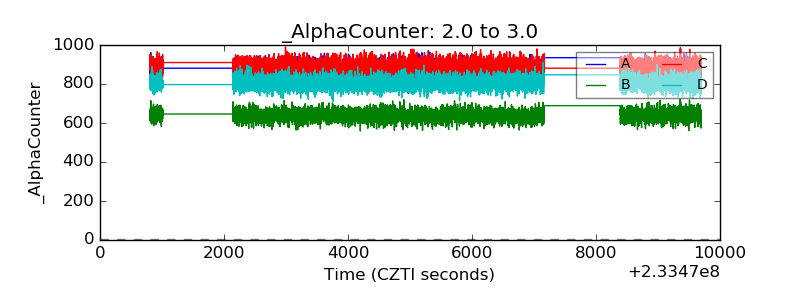 |
| _CPM_Rate | 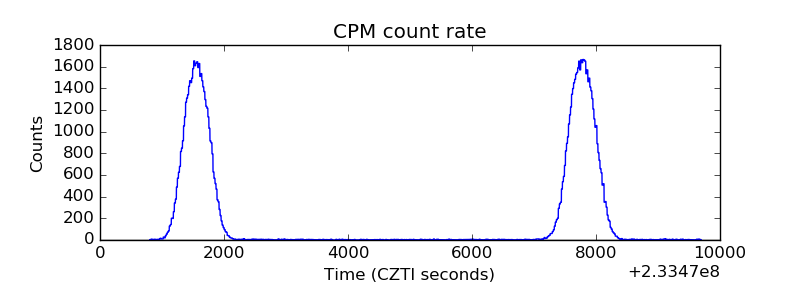 |
| CZT Counter | 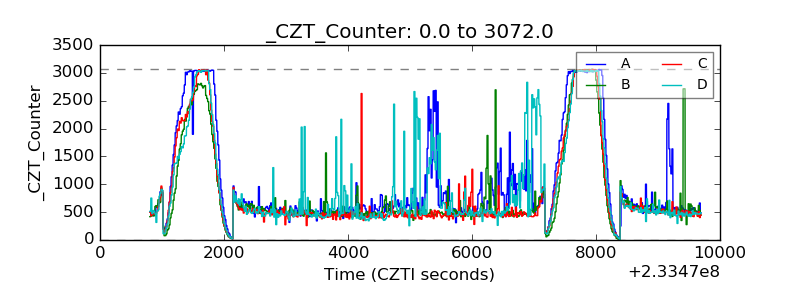 |
| +2.5 Volts monitor |  |
| +5 Volts monitor |  |
| _ROLL_ROT | 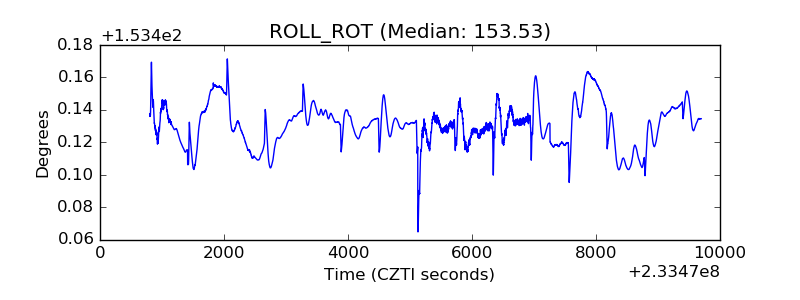 |
| _Roll_DEC | 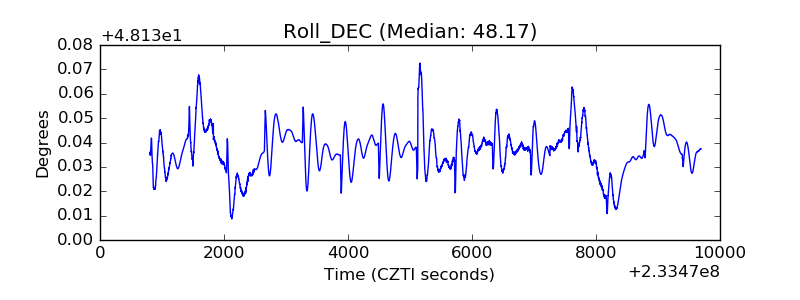 |
| _Roll_RA | 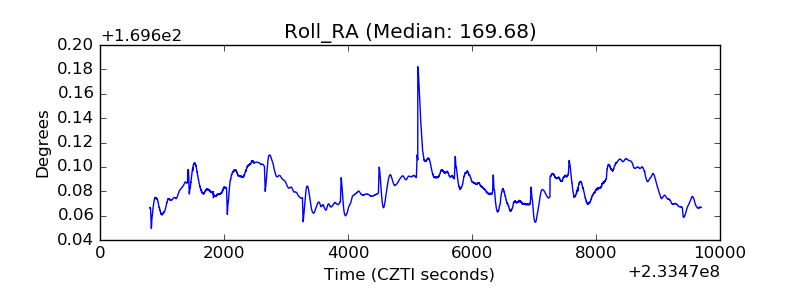 |
| Veto Counter | 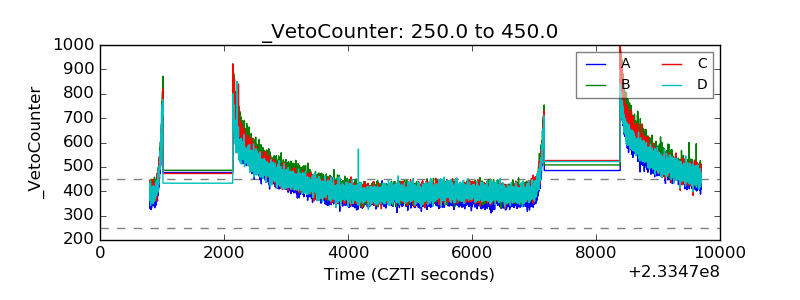 |