| Param | Original file | Final file |
|---|---|---|
| Filename | modeM0/AS1G07_019T01_9000001244_08973cztM0_level2.evt | modeM0/AS1G07_019T01_9000001244_08973cztM0_level2_quad_clean.evt |
| Size (bytes) | 472,919,040 | 90,383,040 |
| Size | 451.0 MB | 86.2 MB |
| Events in quadrant A | 3,955,257 | 578,469 |
| Events in quadrant B | 3,610,710 | 586,287 |
| Events in quadrant C | 3,155,940 | 571,502 |
| Events in quadrant D | 3,171,562 | 559,971 |
| Mode M0 | |||
|---|---|---|---|
| Quadrant | BADHDUFLAG | Total packets | Discarded packets |
| A | 0 | 15870 | 3 |
| B | 0 | 14537 | 2 |
| C | 0 | 13373 | 2 |
| D | 0 | 13421 | 2 |
| Mode M9 | |||
|---|---|---|---|
| Quadrant | BADHDUFLAG | Total packets | Discarded packets |
| A | 0 | 19 | 0 |
| B | 0 | 19 | 0 |
| C | 0 | 19 | 0 |
| D | 0 | 20 | 0 |
| Mode SS | |||
|---|---|---|---|
| Quadrant | BADHDUFLAG | Total packets | Discarded packets |
| A | 0 | 128 | 0 |
| B | 0 | 128 | 0 |
| C | 0 | 128 | 0 |
| D | 0 | 128 | 0 |
| Quadrant | Total seconds | Saturated seconds | Saturation percentage |
|---|---|---|---|
| A | 6317 | 265 | 4.195029% |
| B | 6317 | 239 | 3.783442% |
| C | 6317 | 95 | 1.503878% |
| D | 6317 | 98 | 1.551369% |
Noise dominated data is calculated using 1-second bins in cleaned event files. If a bin has >2000 counts, and if more than 50% of those come from <1% of pixels, then it is considered to be noise-dominated and hence unusable.
| Quadrant | # 1 sec bins | Bins with >0 counts | Bins with >2000 counts | High rate bins dominated by noise | Noise dominated (total time) | Noise dominated (detector-on time) | Marked lightcurve |
|---|---|---|---|---|---|---|---|
| A | 7557 | 6317 | 90 | 90 | 1.19% | 1.42% | 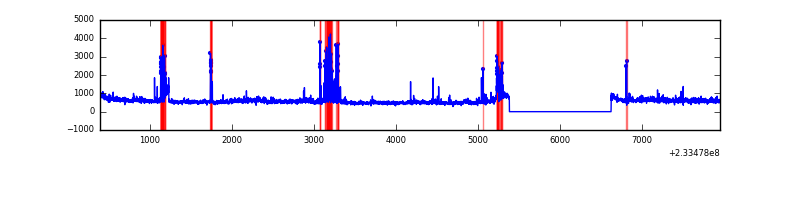 |
| B | 7557 | 6317 | 71 | 71 | 0.94% | 1.12% | 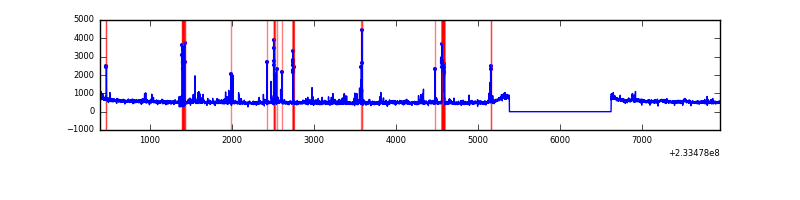 |
| C | 7557 | 6317 | 6 | 6 | 0.08% | 0.09% | 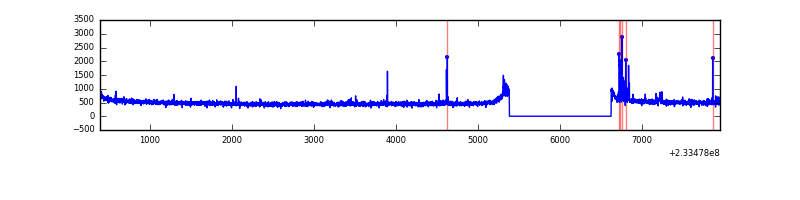 |
| D | 7557 | 6317 | 5 | 5 | 0.07% | 0.08% | 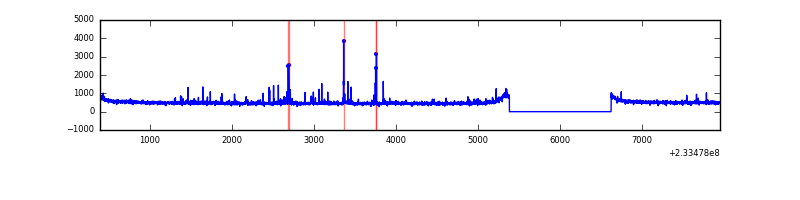 |
Top three noisy pixels from each quadrant. If the there are fewer than three noisy pixels in the level2.evt file, extra rows are filled as -1
| Pixel properties | Quadrant properties | ||||||
|---|---|---|---|---|---|---|---|
| Quadrant | DetID | PixID | Counts | Sigma | Mean | Median | Sigma |
| A | 8 | 5 | 366859 | 2233.31 | 822 | 806 | 163.9 |
| A | 15 | 174 | 229750 | 1396.8 | 822 | 806 | 163.9 |
| A | 5 | 16 | 186614 | 1133.62 | 822 | 806 | 163.9 |
| B | 10 | 16 | 299793 | 1952.26 | 817 | 797 | 153.2 |
| B | 0 | 213 | 33536 | 213.77 | 817 | 797 | 153.2 |
| B | 0 | 214 | 32555 | 207.36 | 817 | 797 | 153.2 |
| C | 4 | 254 | 79254 | 436.26 | 788 | 793 | 179.8 |
| C | 13 | 61 | 6059 | 29.28 | 788 | 793 | 179.8 |
| C | 3 | 202 | 1943 | 6.39 | 788 | 793 | 179.8 |
| D | 7 | 71 | 50373 | 241.17 | 794 | 774 | 205.7 |
| D | 13 | 29 | 32848 | 155.95 | 794 | 774 | 205.7 |
| D | 2 | 234 | 23229 | 109.18 | 794 | 774 | 205.7 |
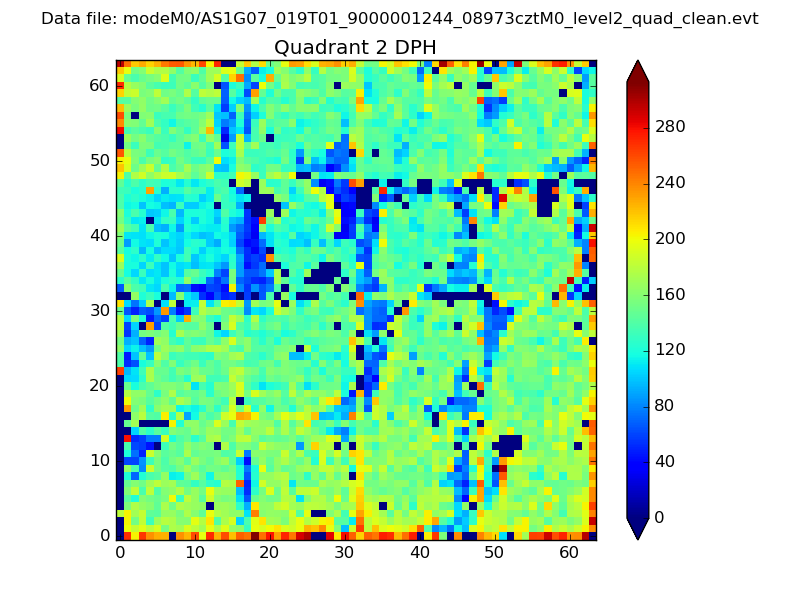
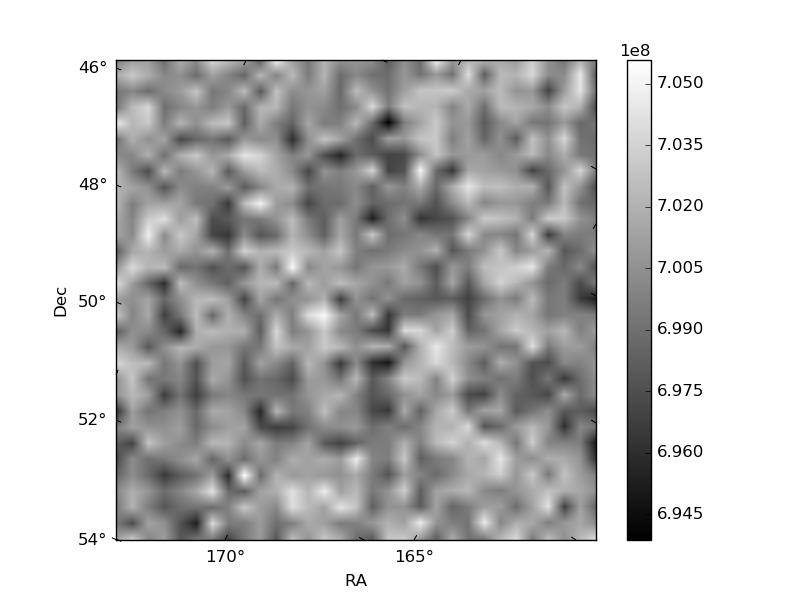
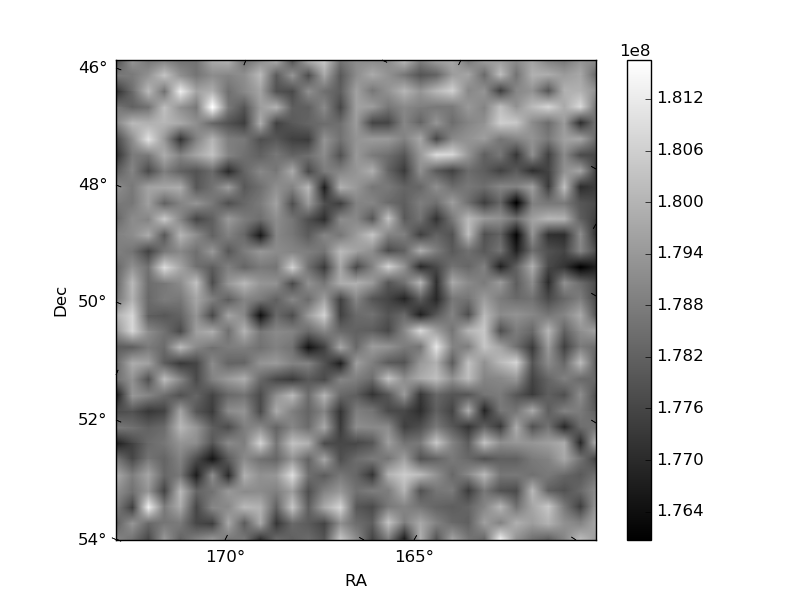
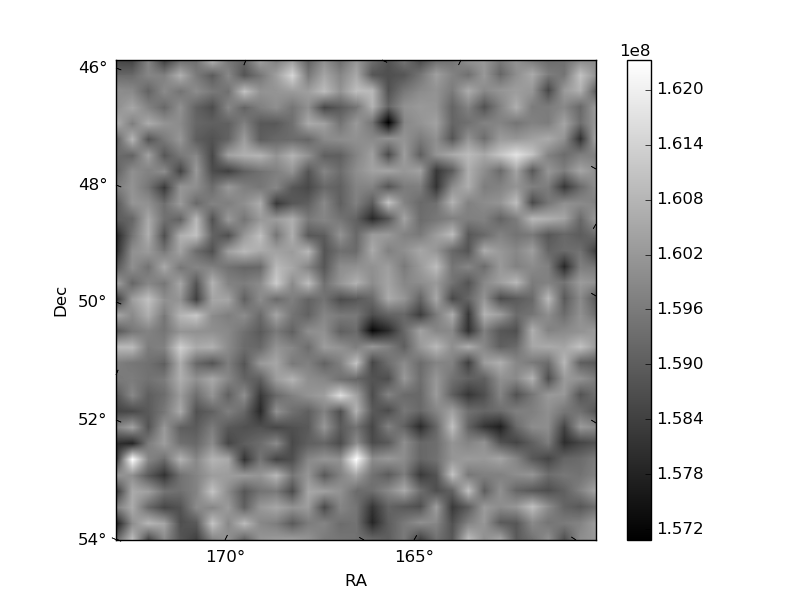
Histogram calculated using DETX and DETY for each event in the final _common_clean file
| Quadrant A | 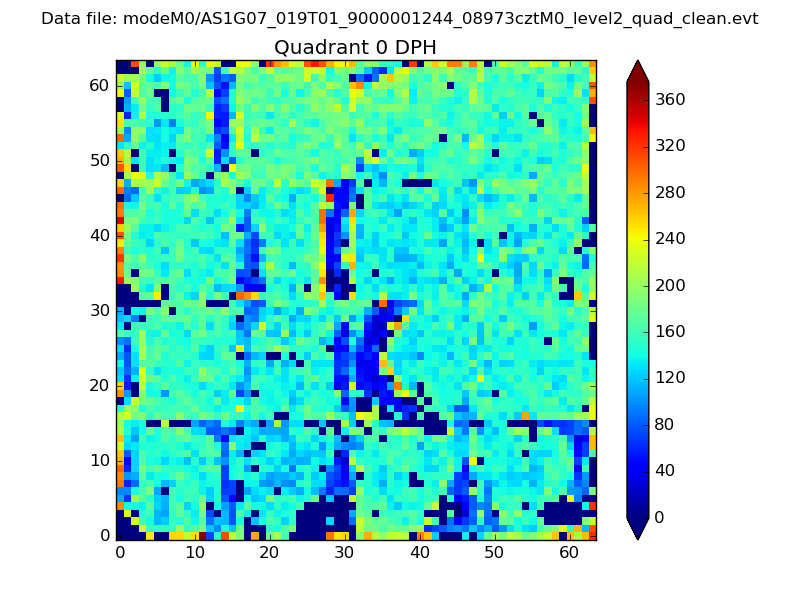 |
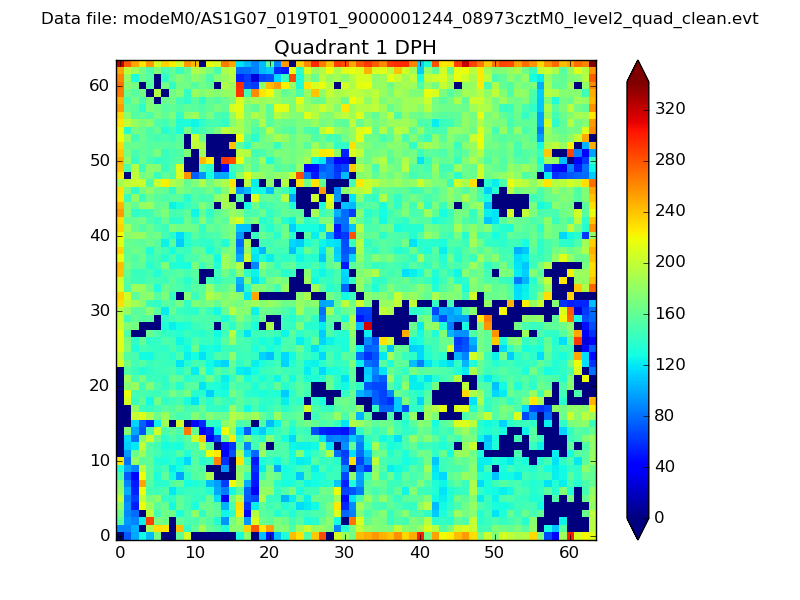 |
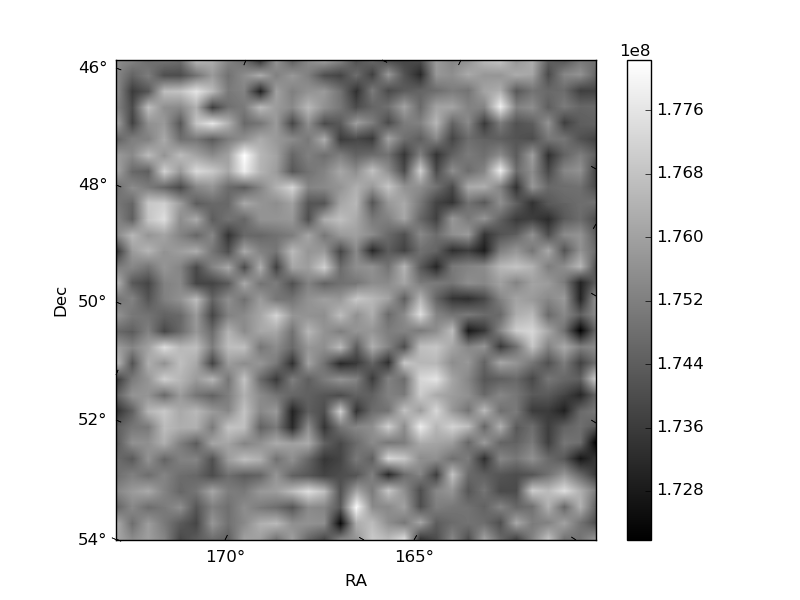
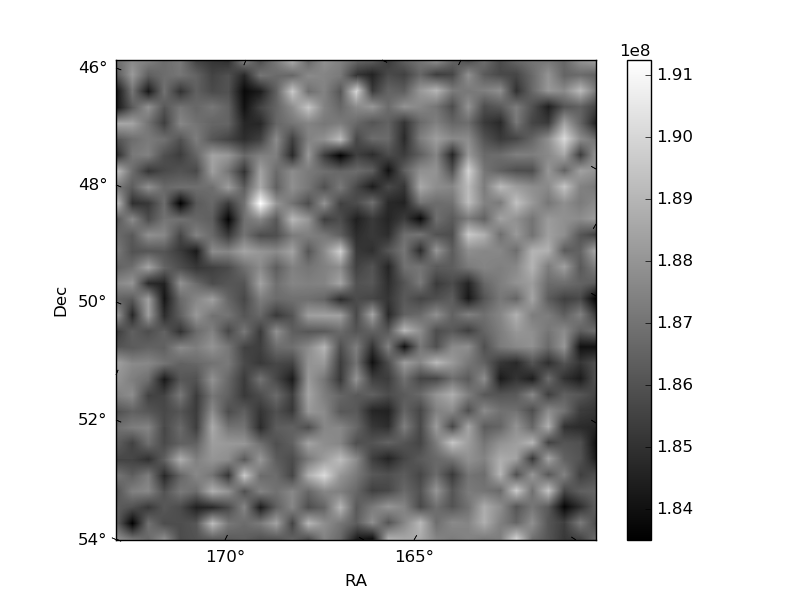
Quadrant B |
|---|---|---|---|
| Quadrant D | 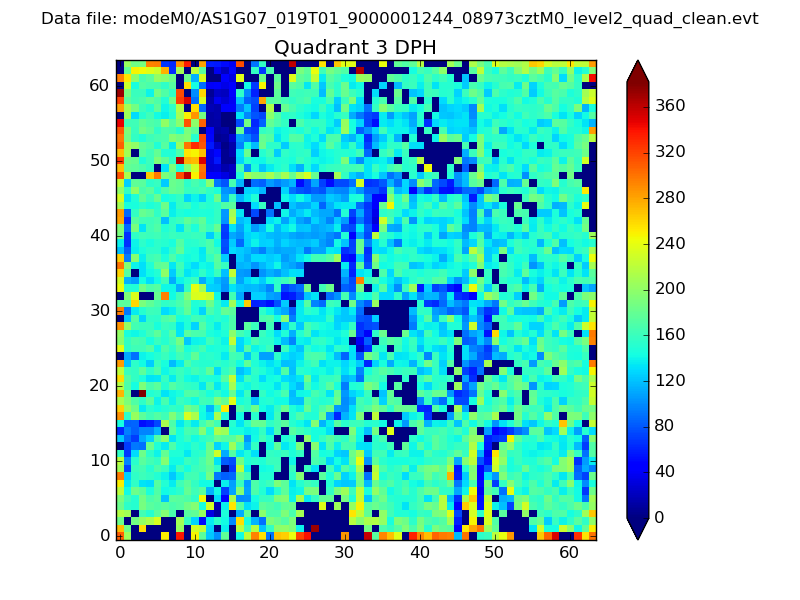 |
 |
Quadrant C |
| Plot type | Count rate plots | Images |
|---|---|---|
| Comparison with Poisson distribution Blue bars denote a histogram of data divided into 1 sec bins. Red curve is a Poisson curve with rate = median count rate of data. |
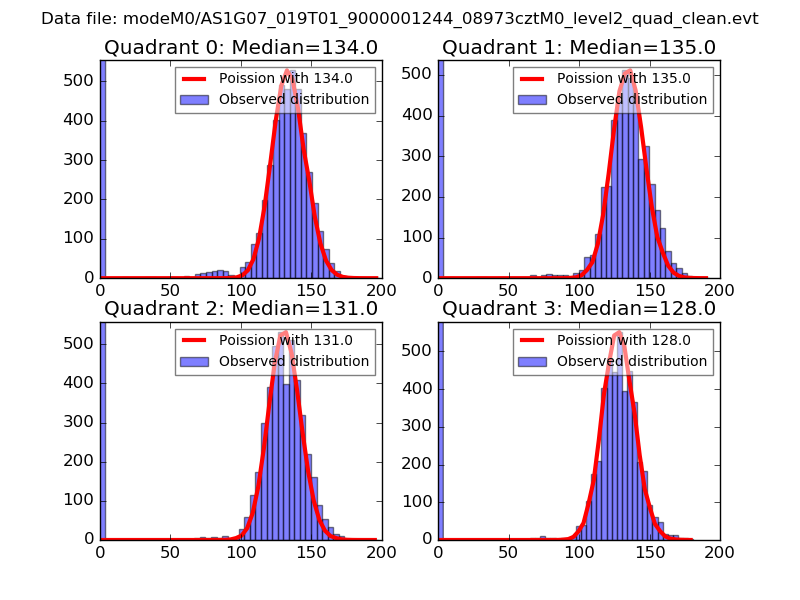 |
 |
| Quadrant-wise count rates Data is divided into 100 sec bins |
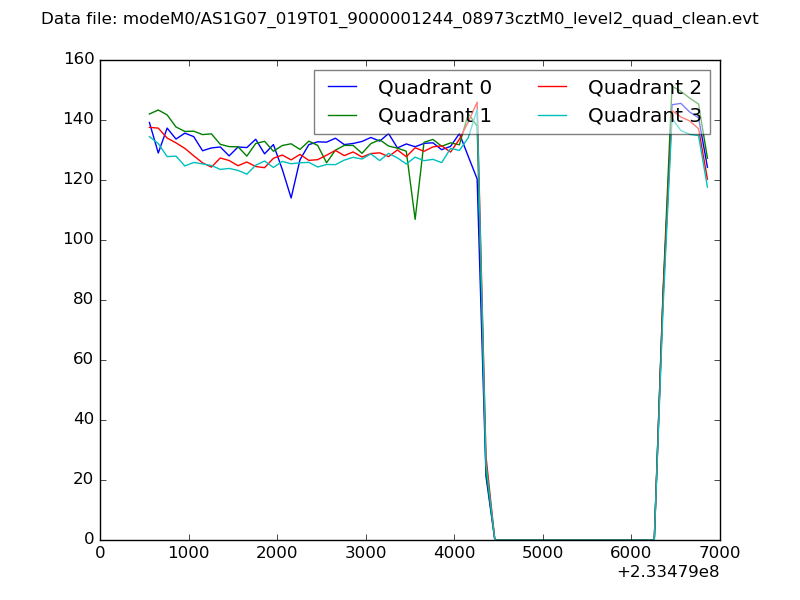 |
|
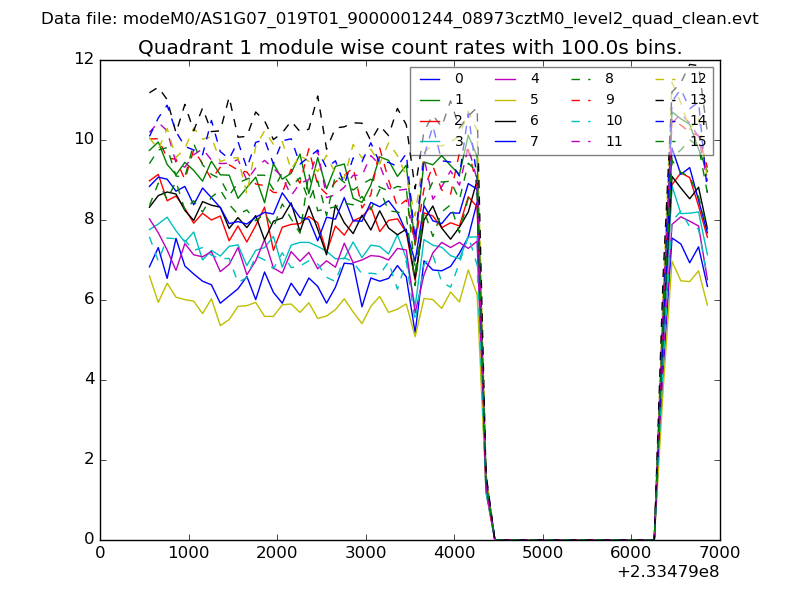
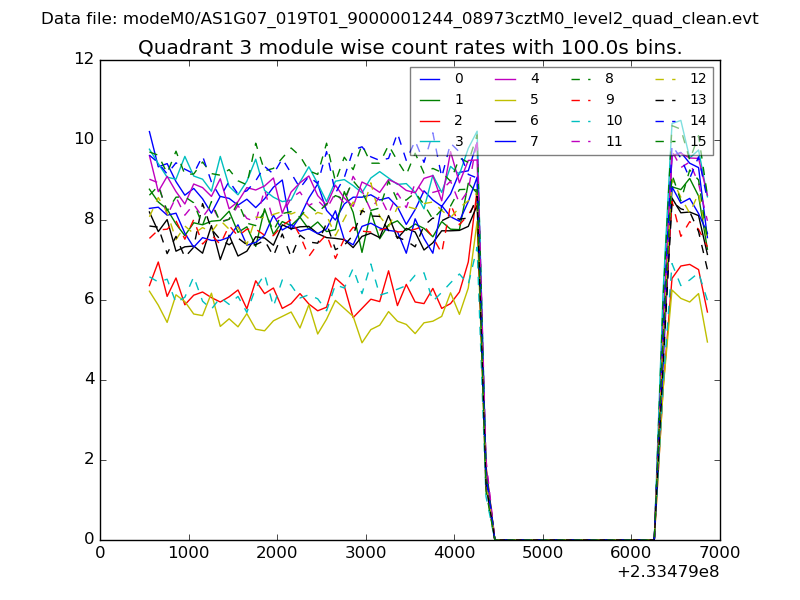
| Module-wise count rates for Quadrant A Data is divided into 100 sec bins |
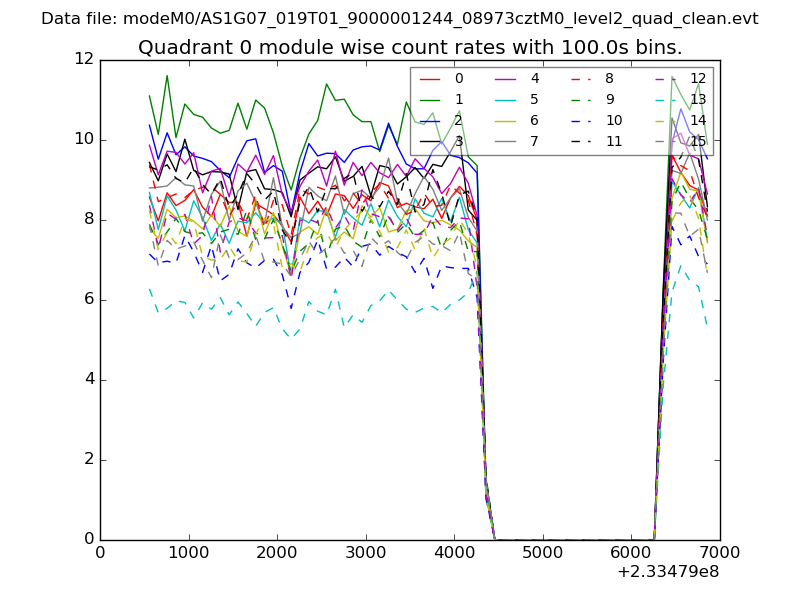 |
 |
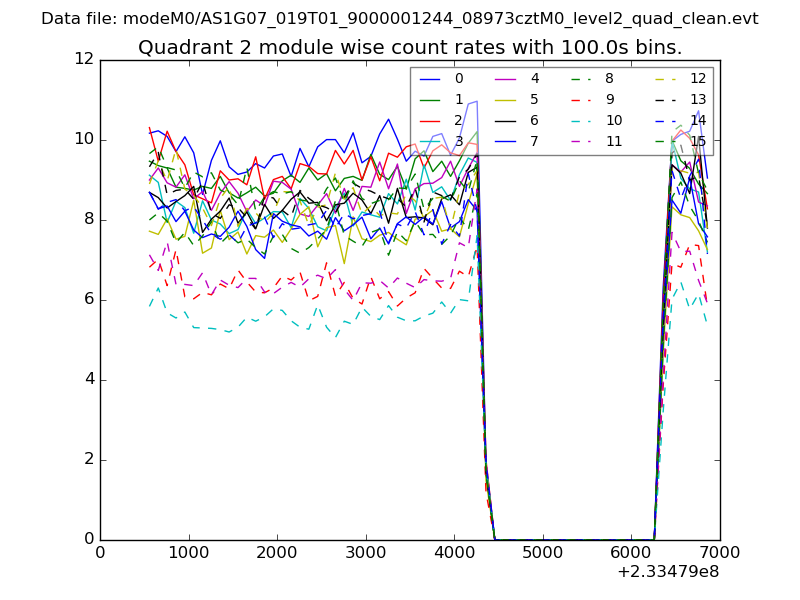
| Module-wise count rates for Quadrant B Data is divided into 100 sec bins |
 |
 |
| Module-wise count rates for Quadrant C Data is divided into 100 sec bins |
 |
 |
| Module-wise count rates for Quadrant D Data is divided into 100 sec bins |
 |
 |
| Parameter | Plot |
|---|---|
| CZT HV Monitor | 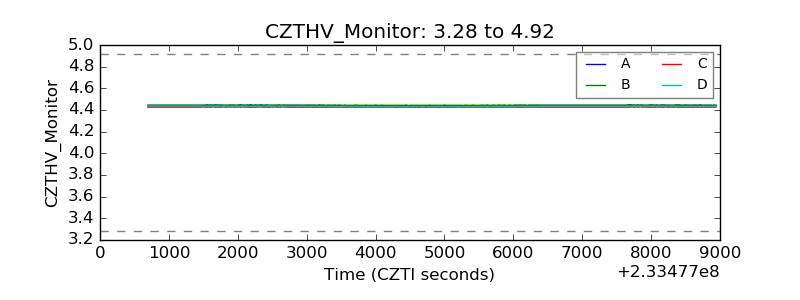 |
| D_VDD | 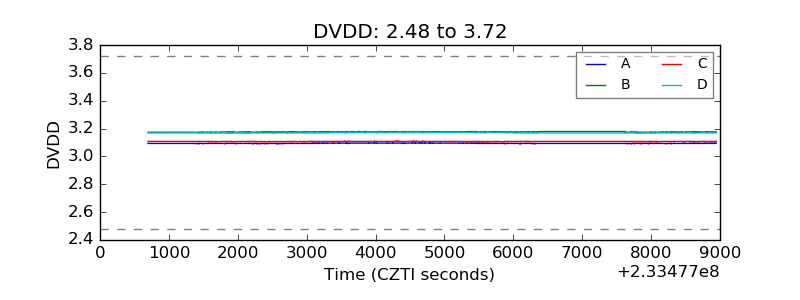 |
| Temperature 1 | 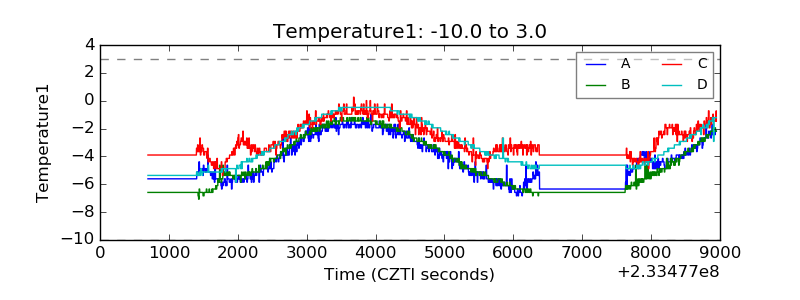 |
| Veto HV Monitor | 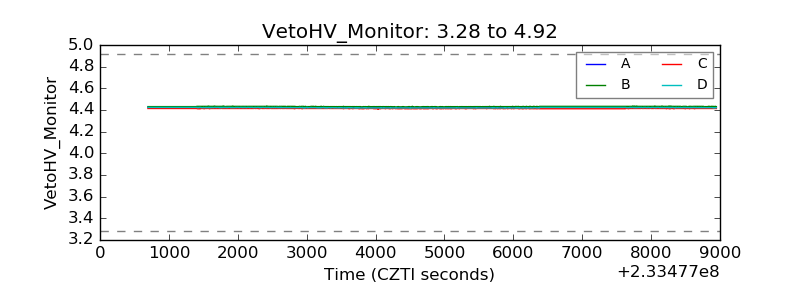 |
| Veto LLD | 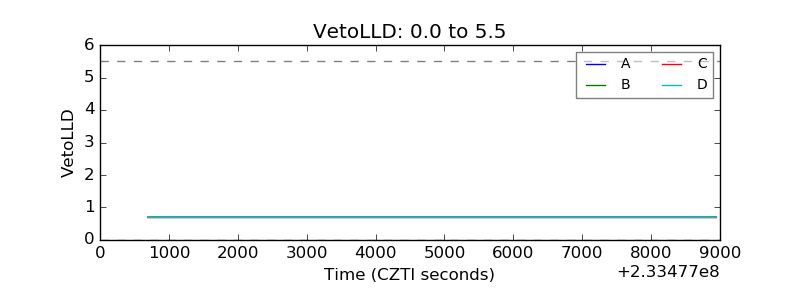 |
| Alpha Counter | 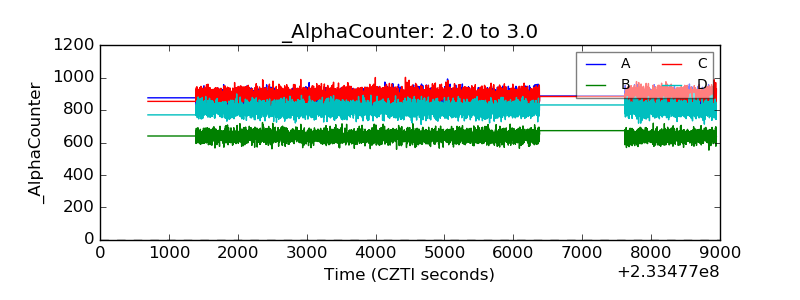 |
| _CPM_Rate | 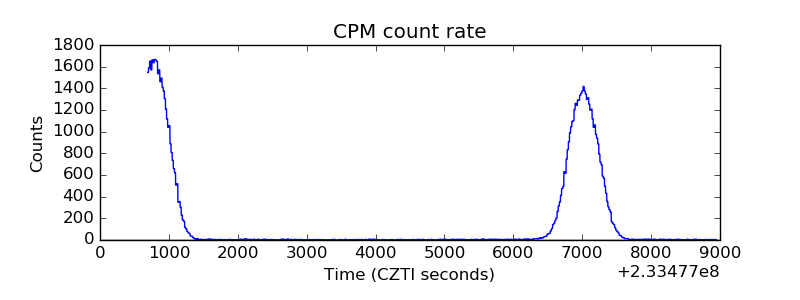 |
| CZT Counter | 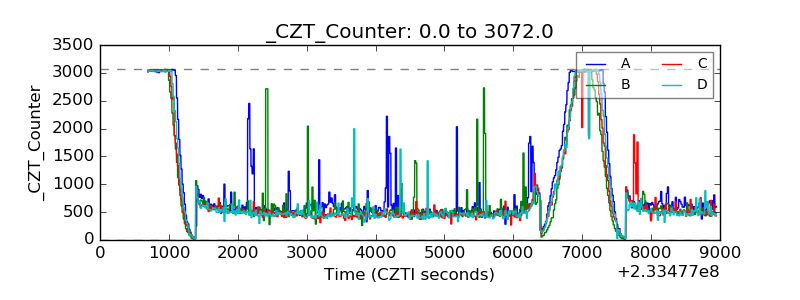 |
| +2.5 Volts monitor |  |
| +5 Volts monitor |  |
| _ROLL_ROT | 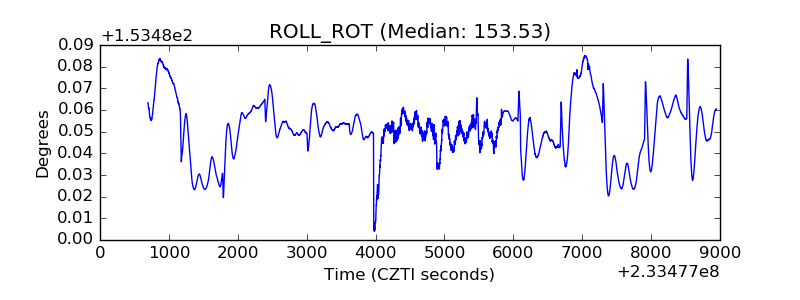 |
| _Roll_DEC | 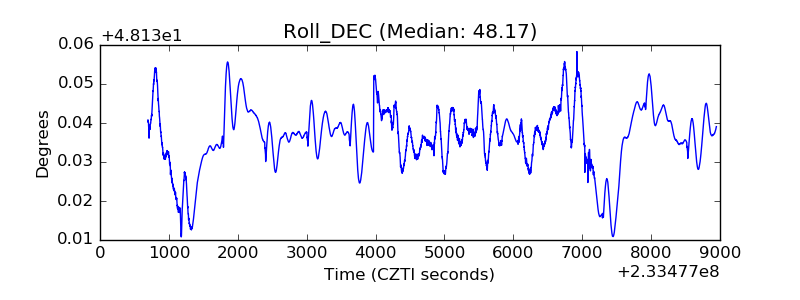 |
| _Roll_RA | 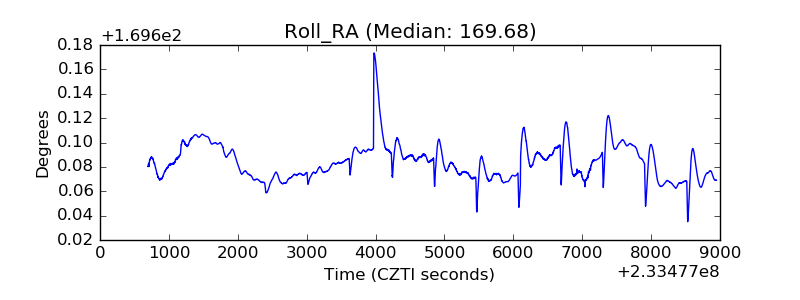 |
| Veto Counter | 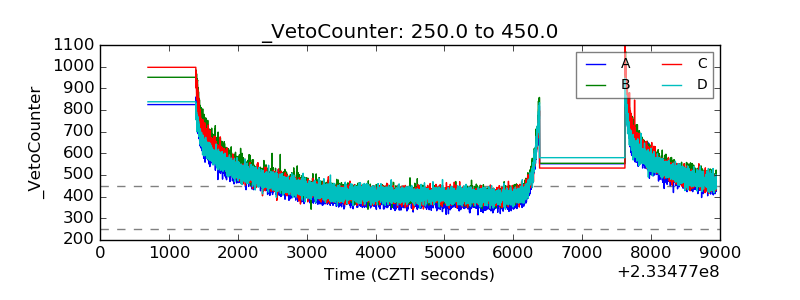 |