| Param | Original file | Final file |
|---|---|---|
| Filename | modeM0/AS1G07_019T01_9000001244_08974cztM0_level2.evt | modeM0/AS1G07_019T01_9000001244_08974cztM0_level2_quad_clean.evt |
| Size (bytes) | 581,287,680 | 94,072,320 |
| Size | 554.4 MB | 89.7 MB |
| Events in quadrant A | 4,320,099 | 636,995 |
| Events in quadrant B | 4,723,001 | 617,624 |
| Events in quadrant C | 3,299,820 | 624,892 |
| Events in quadrant D | 4,841,854 | 536,807 |
| Mode M0 | |||
|---|---|---|---|
| Quadrant | BADHDUFLAG | Total packets | Discarded packets |
| A | 0 | 17062 | 37 |
| B | 0 | 17810 | 16 |
| C | 0 | 13727 | 17 |
| D | 0 | 18271 | 16 |
| Mode M9 | |||
|---|---|---|---|
| Quadrant | BADHDUFLAG | Total packets | Discarded packets |
| A | 0 | 12 | 0 |
| B | 0 | 12 | 0 |
| C | 0 | 12 | 0 |
| D | 0 | 12 | 0 |
| Mode SS | |||
|---|---|---|---|
| Quadrant | BADHDUFLAG | Total packets | Discarded packets |
| A | 0 | 128 | 0 |
| B | 0 | 128 | 0 |
| C | 0 | 128 | 0 |
| D | 0 | 128 | 0 |
| Quadrant | Total seconds | Saturated seconds | Saturation percentage |
|---|---|---|---|
| A | 6179 | 264 | 4.272536% |
| B | 6185 | 505 | 8.164915% |
| C | 6183 | 128 | 2.070192% |
| D | 6184 | 925 | 14.957956% |
Noise dominated data is calculated using 1-second bins in cleaned event files. If a bin has >2000 counts, and if more than 50% of those come from <1% of pixels, then it is considered to be noise-dominated and hence unusable.
| Quadrant | # 1 sec bins | Bins with >0 counts | Bins with >2000 counts | High rate bins dominated by noise | Noise dominated (total time) | Noise dominated (detector-on time) | Marked lightcurve |
|---|---|---|---|---|---|---|---|
| A | 7431 | 6191 | 97 | 97 | 1.31% | 1.57% | 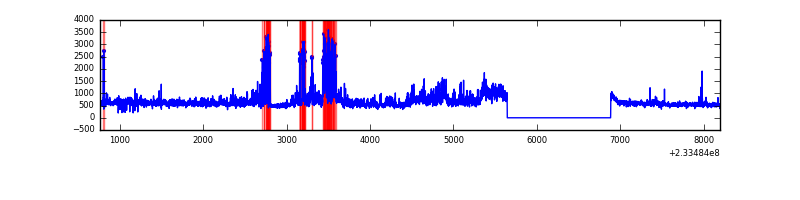 |
| B | 7431 | 6191 | 365 | 365 | 4.91% | 5.90% | 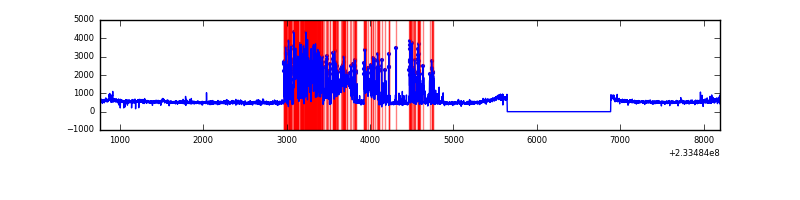 |
| C | 7431 | 6191 | 35 | 35 | 0.47% | 0.57% | 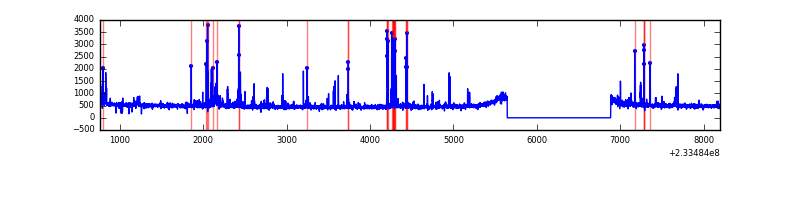 |
| D | 7431 | 6191 | 755 | 755 | 10.16% | 12.20% |  |
Top three noisy pixels from each quadrant. If the there are fewer than three noisy pixels in the level2.evt file, extra rows are filled as -1
| Pixel properties | Quadrant properties | ||||||
|---|---|---|---|---|---|---|---|
| Quadrant | DetID | PixID | Counts | Sigma | Mean | Median | Sigma |
| A | 8 | 5 | 866373 | 5494.14 | 788 | 771 | 157.6 |
| A | 15 | 174 | 261973 | 1657.9 | 788 | 771 | 157.6 |
| A | 5 | 16 | 115476 | 728.05 | 788 | 771 | 157.6 |
| B | 0 | 85 | 1630697 | 11250.79 | 768 | 752 | 144.9 |
| B | 0 | 214 | 37094 | 250.85 | 768 | 752 | 144.9 |
| B | 0 | 246 | 16651 | 109.74 | 768 | 752 | 144.9 |
| C | 4 | 254 | 342517 | 1978.43 | 756 | 758 | 172.7 |
| C | 13 | 61 | 5695 | 28.58 | 756 | 758 | 172.7 |
| C | 8 | 128 | 4652 | 22.54 | 756 | 758 | 172.7 |
| D | 13 | 29 | 1835565 | 9994.13 | 692 | 674 | 183.6 |
| D | 1 | 52 | 281624 | 1530.26 | 692 | 674 | 183.6 |
| D | 7 | 71 | 34848 | 186.14 | 692 | 674 | 183.6 |
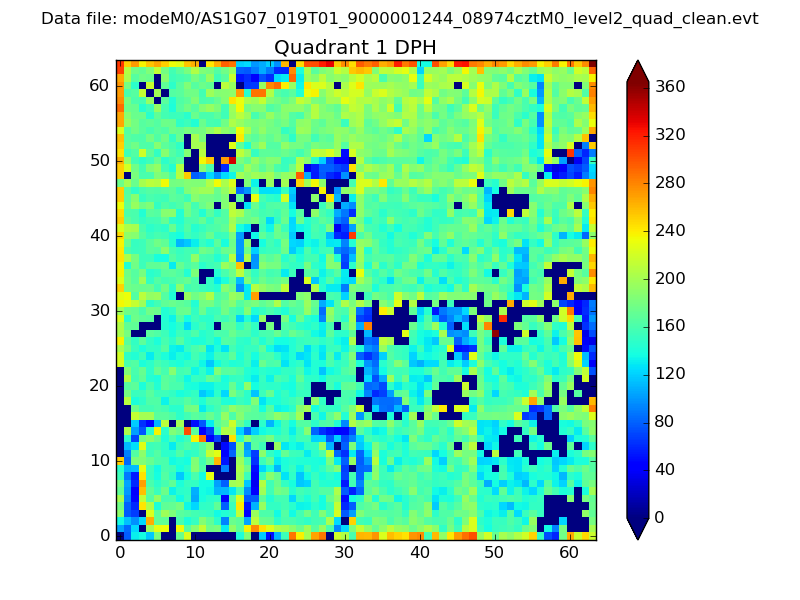
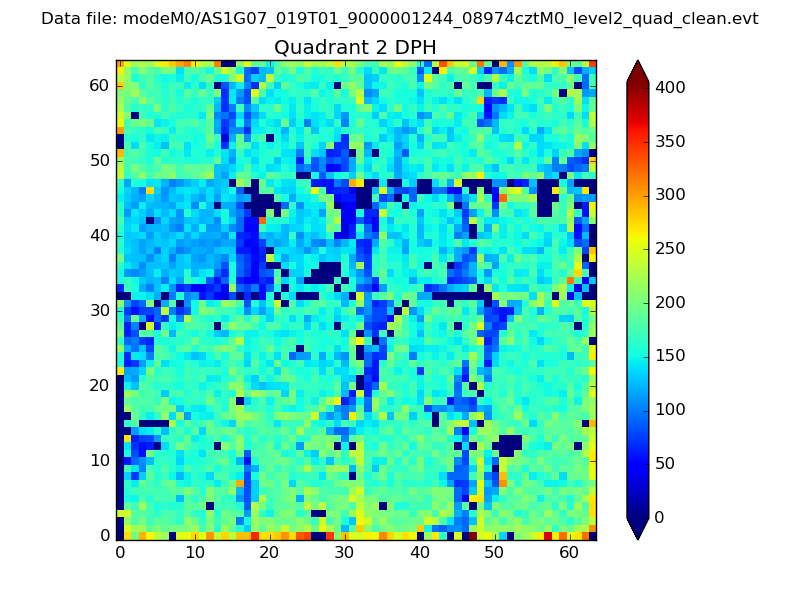
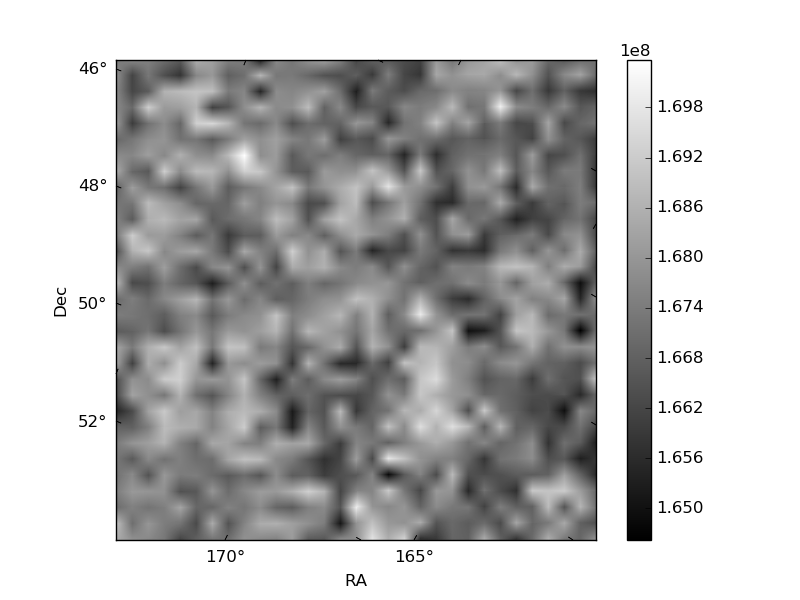
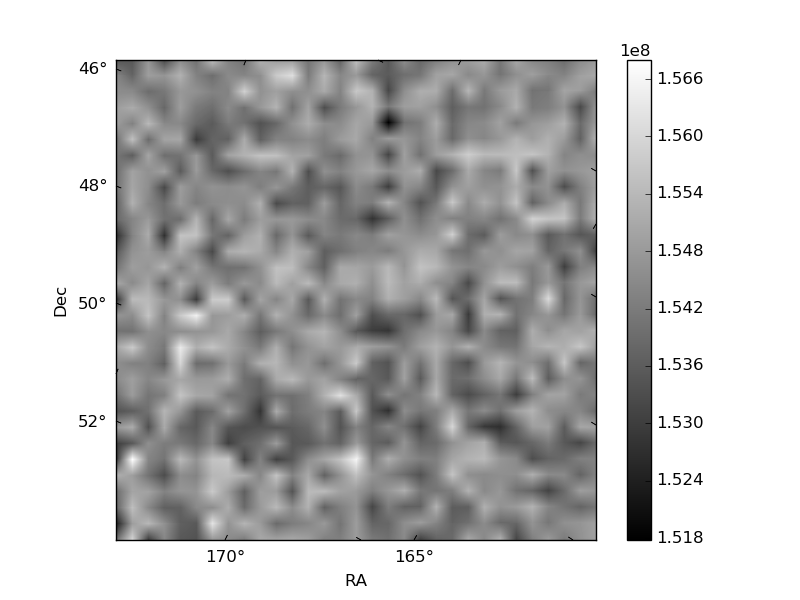
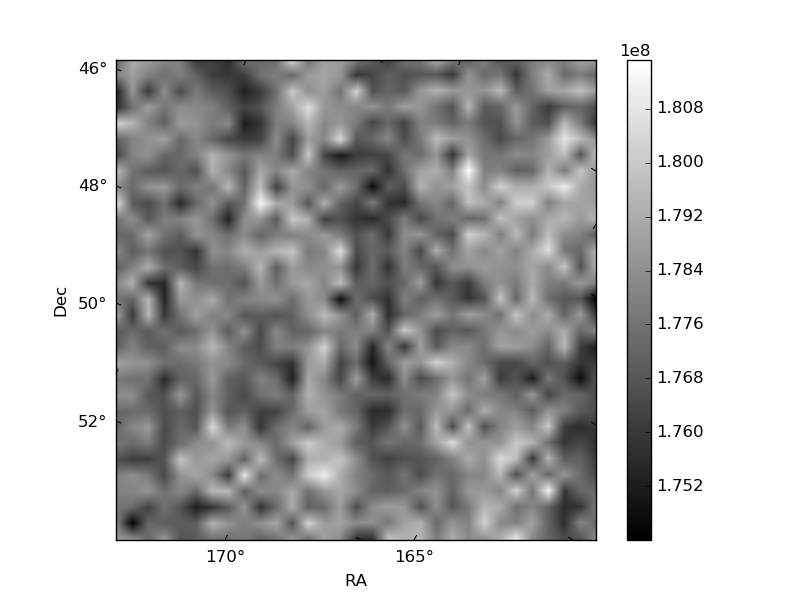
Histogram calculated using DETX and DETY for each event in the final _common_clean file
| Quadrant A | 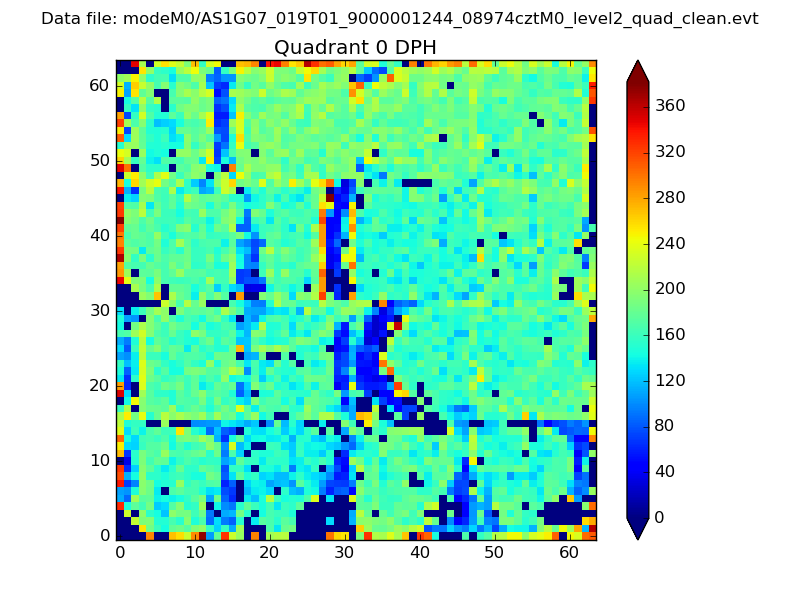 |
 |
Quadrant B |
|---|---|---|---|
| Quadrant D | 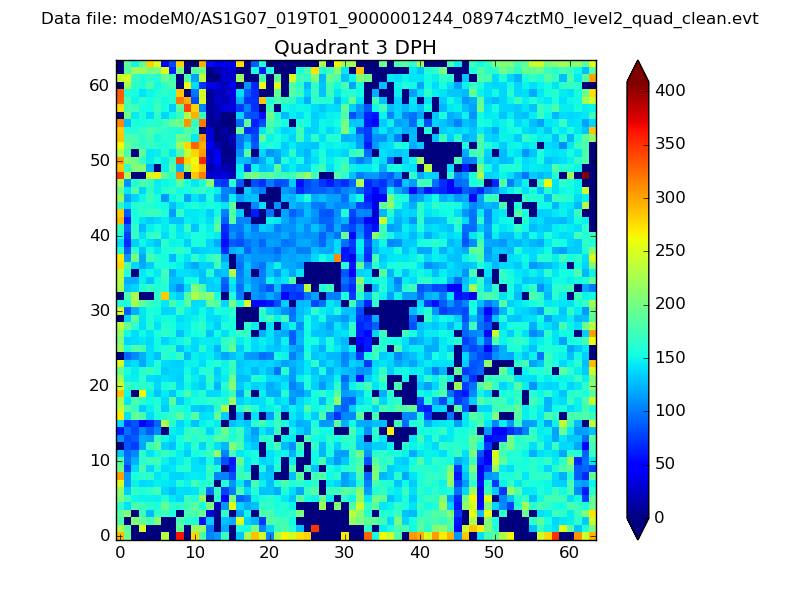 |
 |
Quadrant C |
| Plot type | Count rate plots | Images |
|---|---|---|
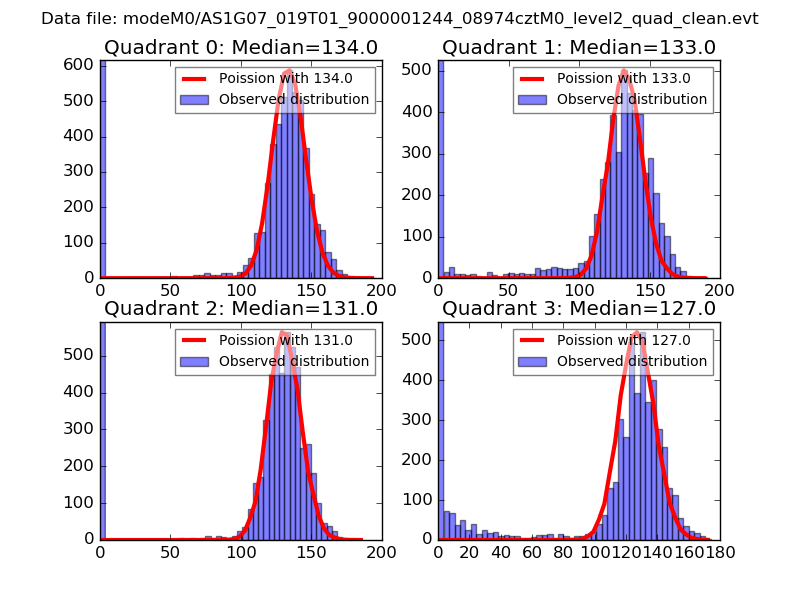
| Comparison with Poisson distribution Blue bars denote a histogram of data divided into 1 sec bins. Red curve is a Poisson curve with rate = median count rate of data. |
 |
 |
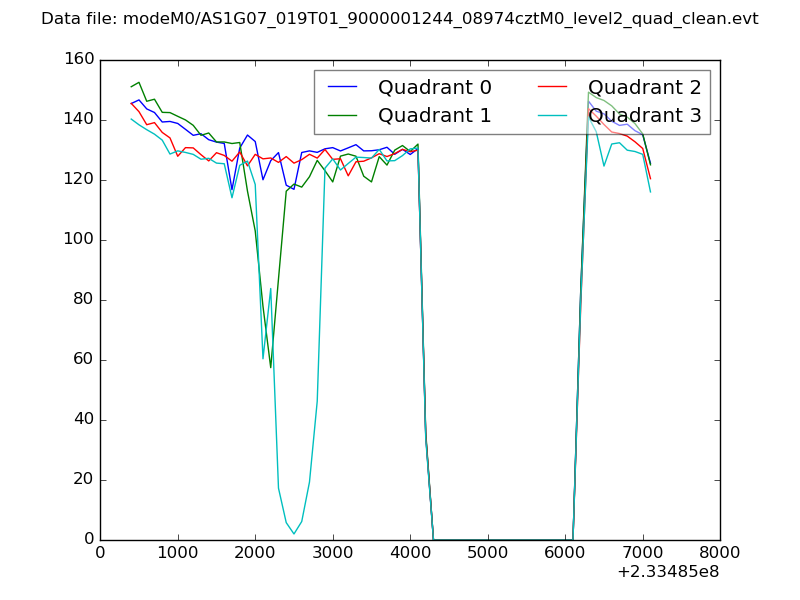
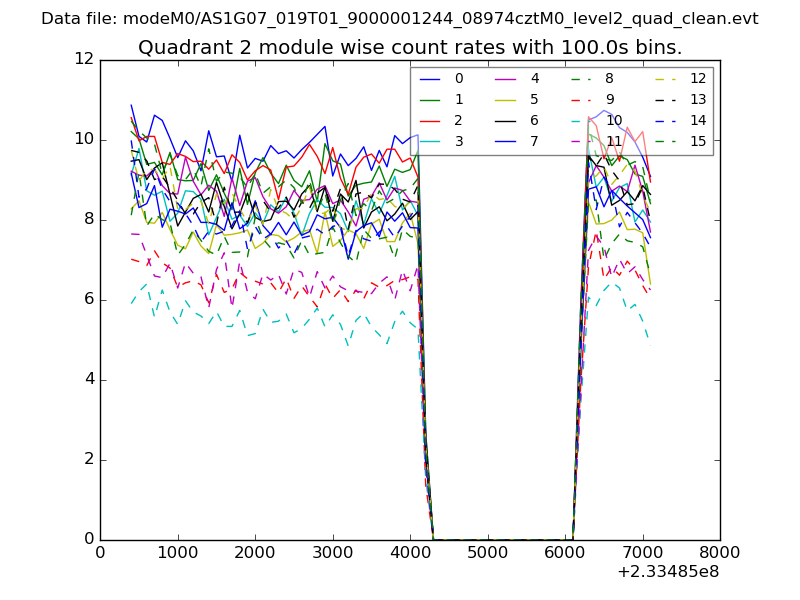
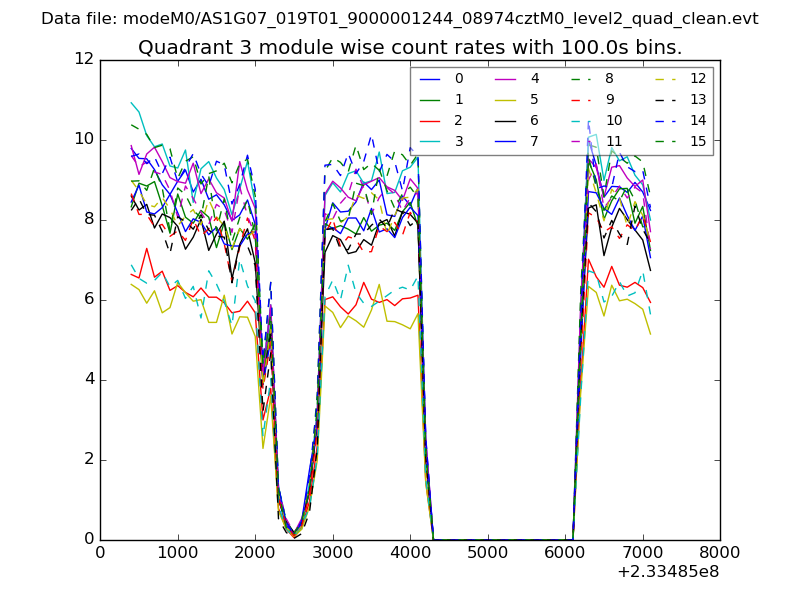
| Quadrant-wise count rates Data is divided into 100 sec bins |
 |
|
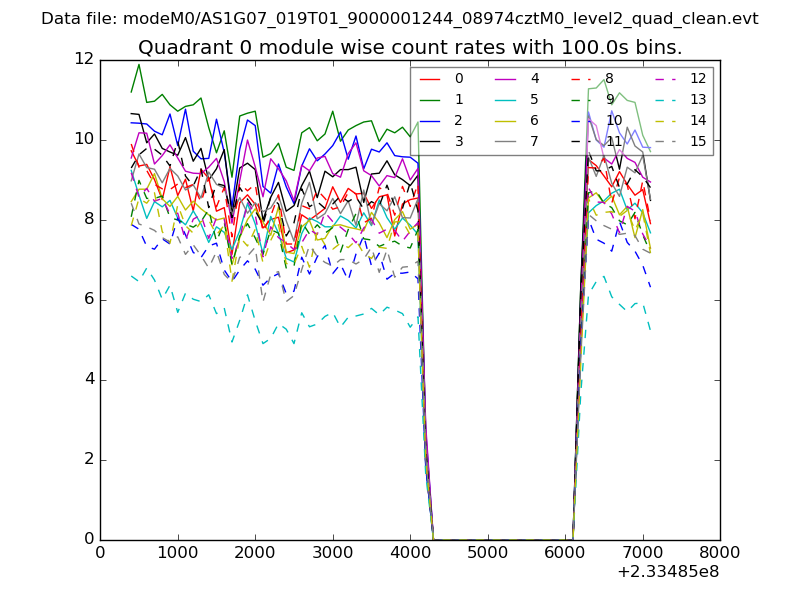
| Module-wise count rates for Quadrant A Data is divided into 100 sec bins |
 |
 |
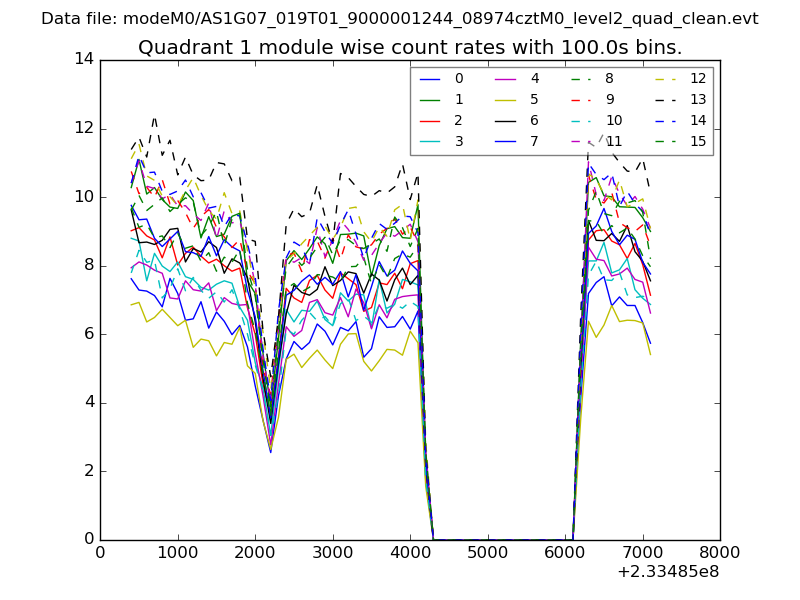
| Module-wise count rates for Quadrant B Data is divided into 100 sec bins |
 |
 |
| Module-wise count rates for Quadrant C Data is divided into 100 sec bins |
 |
 |
| Module-wise count rates for Quadrant D Data is divided into 100 sec bins |
 |
 |
| Parameter | Plot |
|---|---|
| CZT HV Monitor | 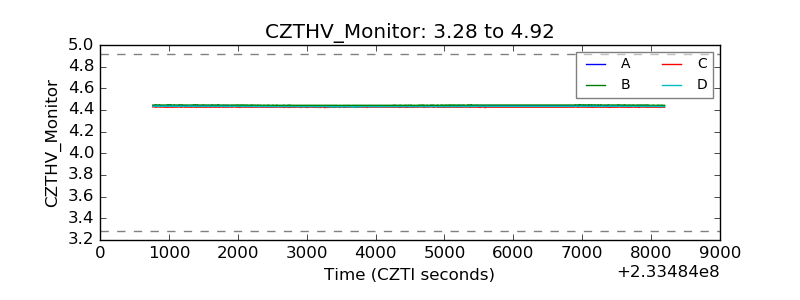 |
| D_VDD | 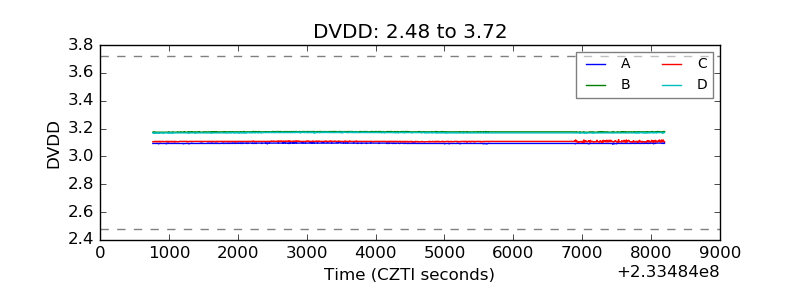 |
| Temperature 1 | 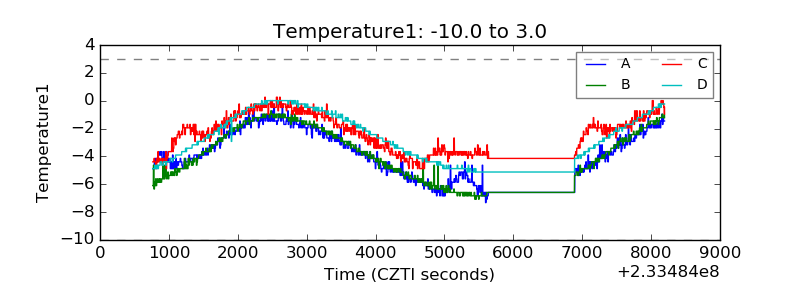 |
| Veto HV Monitor | 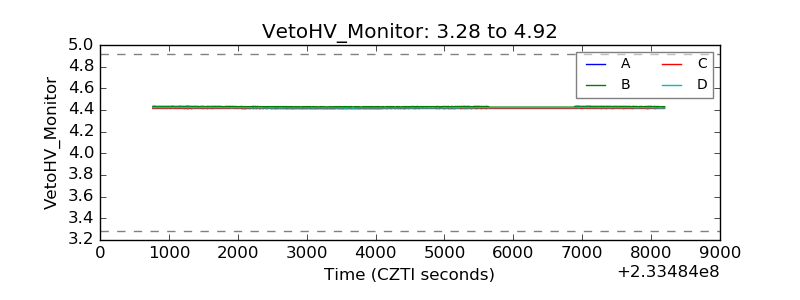 |
| Veto LLD | 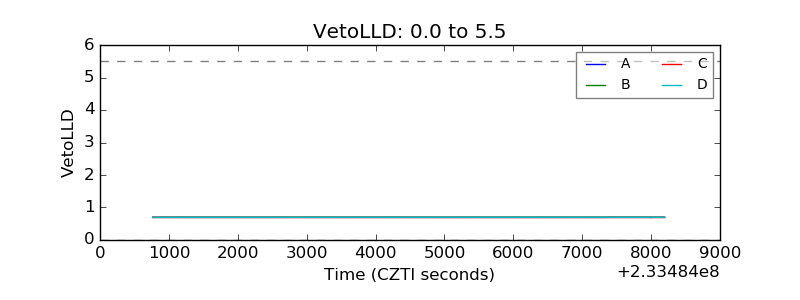 |
| Alpha Counter | 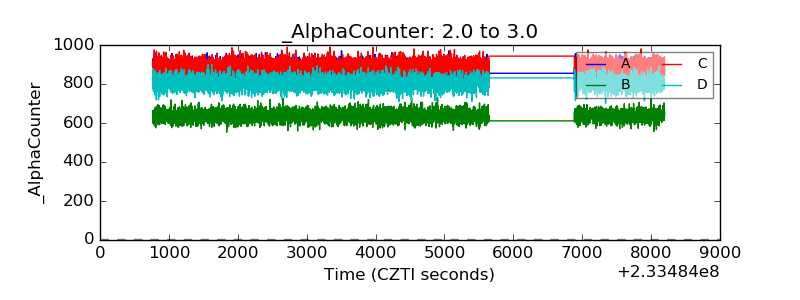 |
| _CPM_Rate | 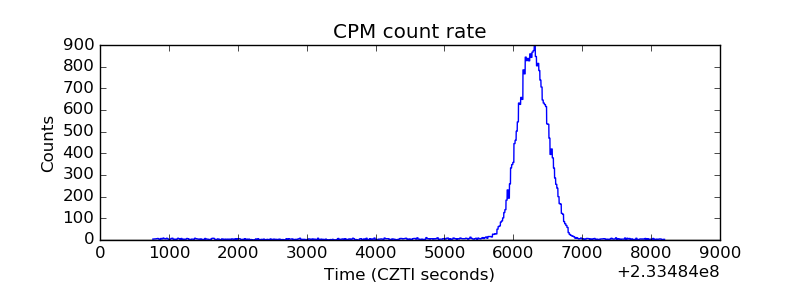 |
| CZT Counter | 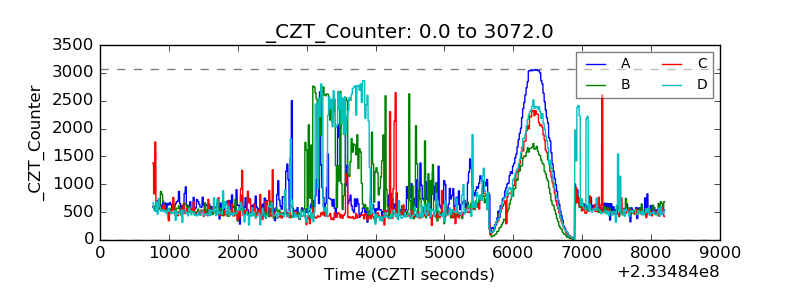 |
| +2.5 Volts monitor |  |
| +5 Volts monitor |  |
| _ROLL_ROT | 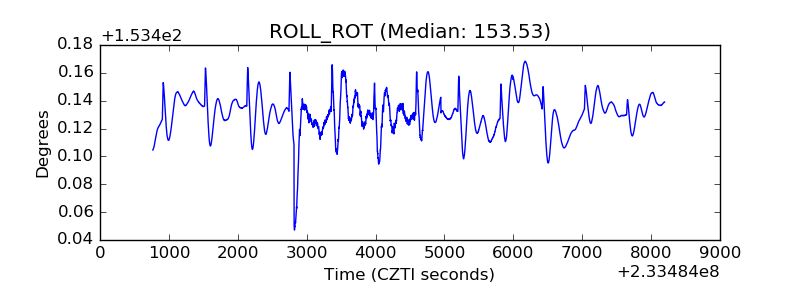 |
| _Roll_DEC | 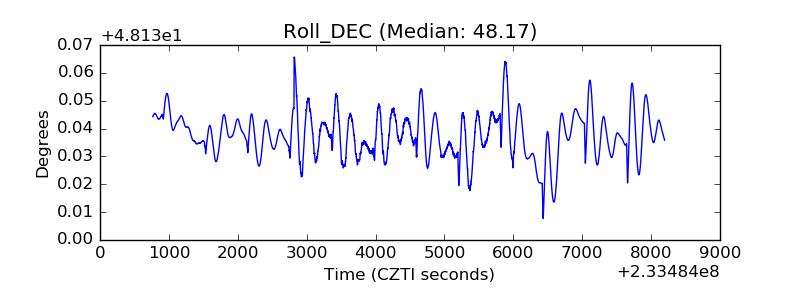 |
| _Roll_RA |  |
| Veto Counter | 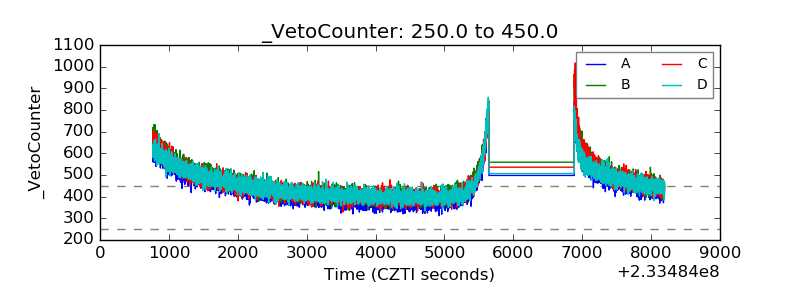 |