| Param | Original file | Final file |
|---|---|---|
| Filename | modeM0/AS1G07_019T01_9000001244_08975cztM0_level2.evt | modeM0/AS1G07_019T01_9000001244_08975cztM0_level2_quad_clean.evt |
| Size (bytes) | 145,203,840 | 29,044,800 |
| Size | 138.5 MB | 27.7 MB |
| Events in quadrant A | 999,865 | 191,803 |
| Events in quadrant B | 1,285,102 | 190,099 |
| Events in quadrant C | 927,039 | 186,256 |
| Events in quadrant D | 1,063,169 | 181,750 |
| Mode M0 | |||
|---|---|---|---|
| Quadrant | BADHDUFLAG | Total packets | Discarded packets |
| A | 0 | 4000 | 1 |
| B | 0 | 4874 | 1 |
| C | 0 | 3817 | 1 |
| D | 0 | 4203 | 1 |
| Mode M9 | |||
|---|---|---|---|
| Quadrant | BADHDUFLAG | Total packets | Discarded packets |
| A | 0 | 7 | 0 |
| B | 0 | 7 | 0 |
| C | 0 | 7 | 0 |
| D | 0 | 8 | 0 |
| Mode SS | |||
|---|---|---|---|
| Quadrant | BADHDUFLAG | Total packets | Discarded packets |
| A | 0 | 36 | 0 |
| B | 0 | 36 | 0 |
| C | 0 | 36 | 0 |
| D | 0 | 36 | 0 |
| Quadrant | Total seconds | Saturated seconds | Saturation percentage |
|---|---|---|---|
| A | 1759 | 19 | 1.080159% |
| B | 1759 | 111 | 6.310404% |
| C | 1759 | 13 | 0.739056% |
| D | 1759 | 85 | 4.832291% |
Noise dominated data is calculated using 1-second bins in cleaned event files. If a bin has >2000 counts, and if more than 50% of those come from <1% of pixels, then it is considered to be noise-dominated and hence unusable.
| Quadrant | # 1 sec bins | Bins with >0 counts | Bins with >2000 counts | High rate bins dominated by noise | Noise dominated (total time) | Noise dominated (detector-on time) | Marked lightcurve |
|---|---|---|---|---|---|---|---|
| A | 1759 | 1759 | 1 | 1 | 0.06% | 0.06% | 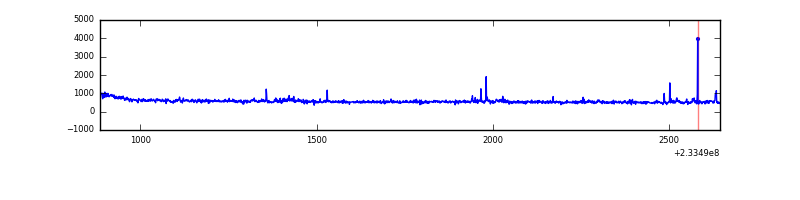 |
| B | 1759 | 1759 | 88 | 88 | 5.00% | 5.00% | 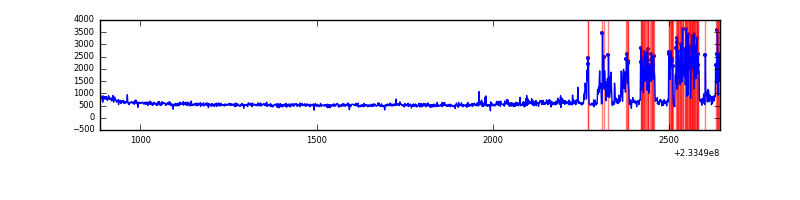 |
| C | 1759 | 1759 | 5 | 5 | 0.28% | 0.28% | 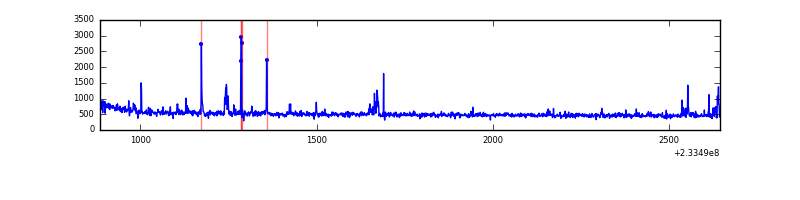 |
| D | 1759 | 1759 | 52 | 52 | 2.96% | 2.96% | 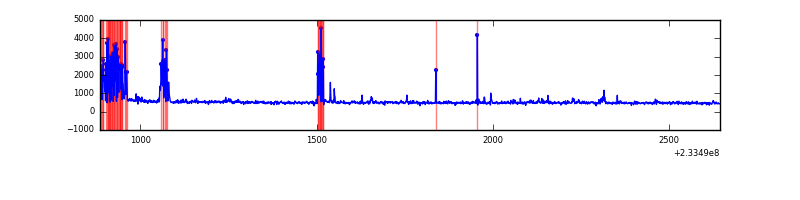 |
Top three noisy pixels from each quadrant. If the there are fewer than three noisy pixels in the level2.evt file, extra rows are filled as -1
| Pixel properties | Quadrant properties | ||||||
|---|---|---|---|---|---|---|---|
| Quadrant | DetID | PixID | Counts | Sigma | Mean | Median | Sigma |
| A | 8 | 5 | 60057 | 1225.08 | 236 | 231 | 48.8 |
| A | 13 | 251 | 17481 | 353.23 | 236 | 231 | 48.8 |
| A | 5 | 16 | 12017 | 241.35 | 236 | 231 | 48.8 |
| B | 0 | 85 | 369658 | 8117.5 | 228 | 223 | 45.5 |
| B | 0 | 214 | 23735 | 516.62 | 228 | 223 | 45.5 |
| B | 12 | 111 | 4490 | 93.76 | 228 | 223 | 45.5 |
| C | 4 | 254 | 59106 | 1130.17 | 220 | 220 | 52.1 |
| C | 8 | 128 | 4847 | 88.8 | 220 | 220 | 52.1 |
| C | 8 | 112 | 2483 | 43.43 | 220 | 220 | 52.1 |
| D | 1 | 52 | 203288 | 3428.21 | 218 | 212 | 59.2 |
| D | 7 | 71 | 14037 | 233.39 | 218 | 212 | 59.2 |
| D | 13 | 29 | 7832 | 128.64 | 218 | 212 | 59.2 |
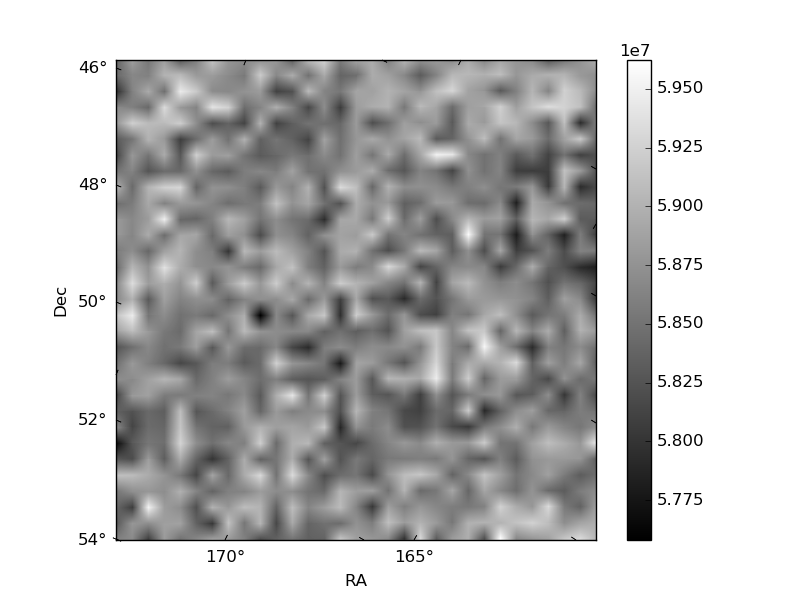
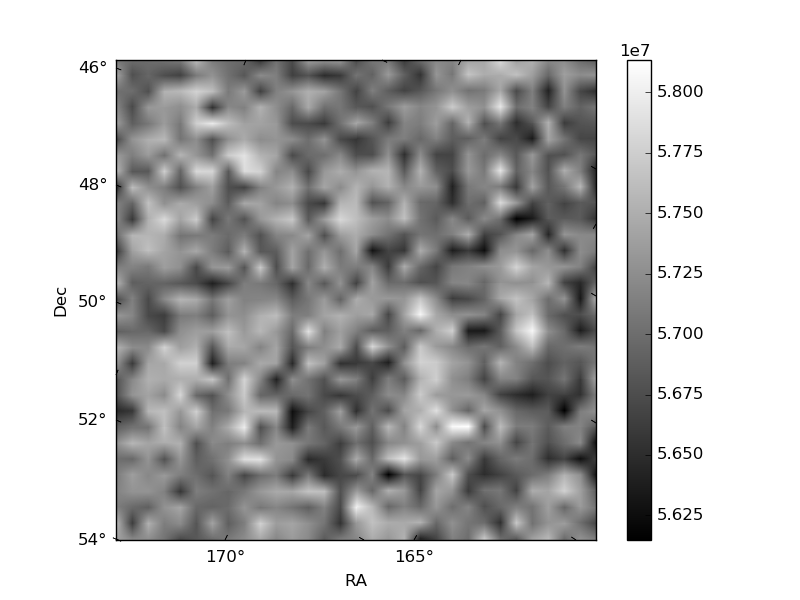
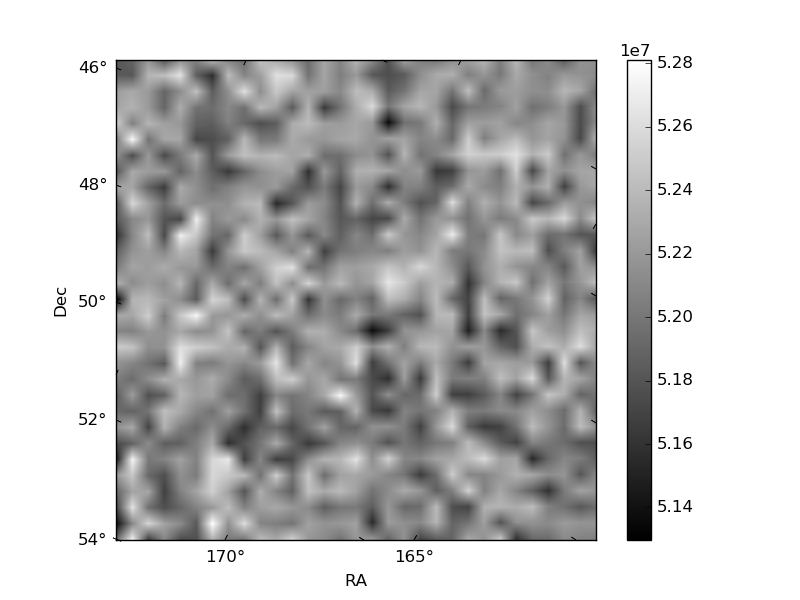
Histogram calculated using DETX and DETY for each event in the final _common_clean file
| Quadrant A | 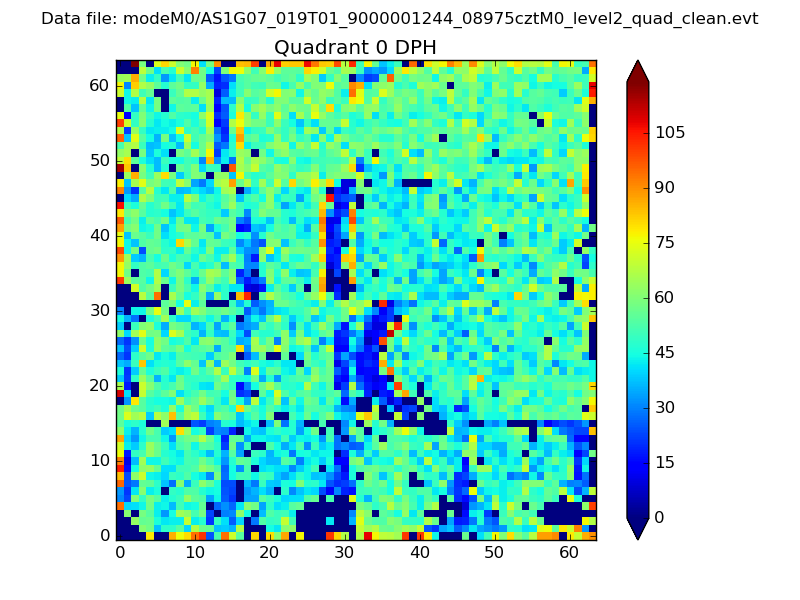 |
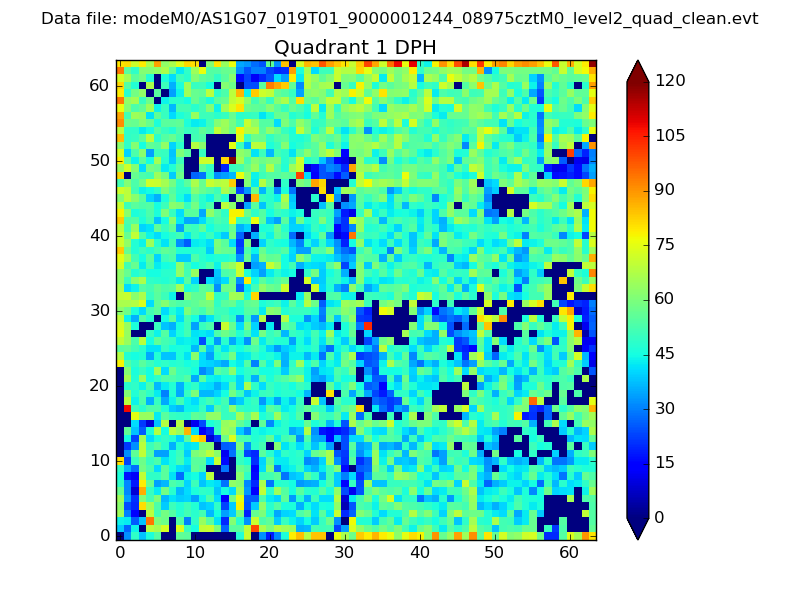 |
Quadrant B |
|---|---|---|---|
| Quadrant D | 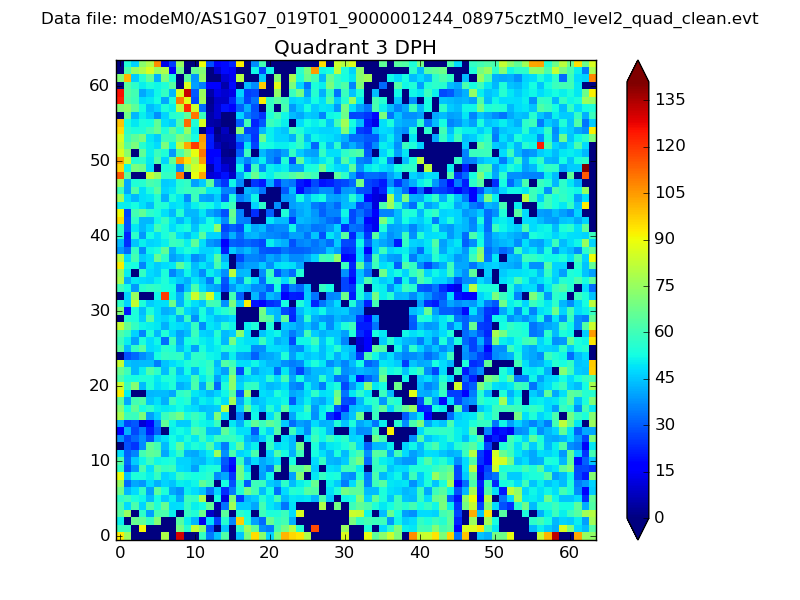 |
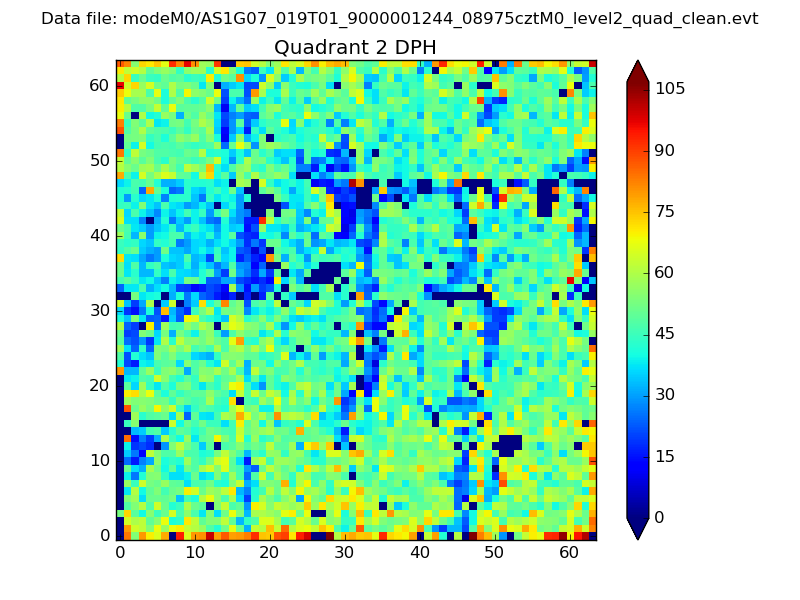 |
Quadrant C |
| Plot type | Count rate plots | Images |
|---|---|---|
| Comparison with Poisson distribution Blue bars denote a histogram of data divided into 1 sec bins. Red curve is a Poisson curve with rate = median count rate of data. |
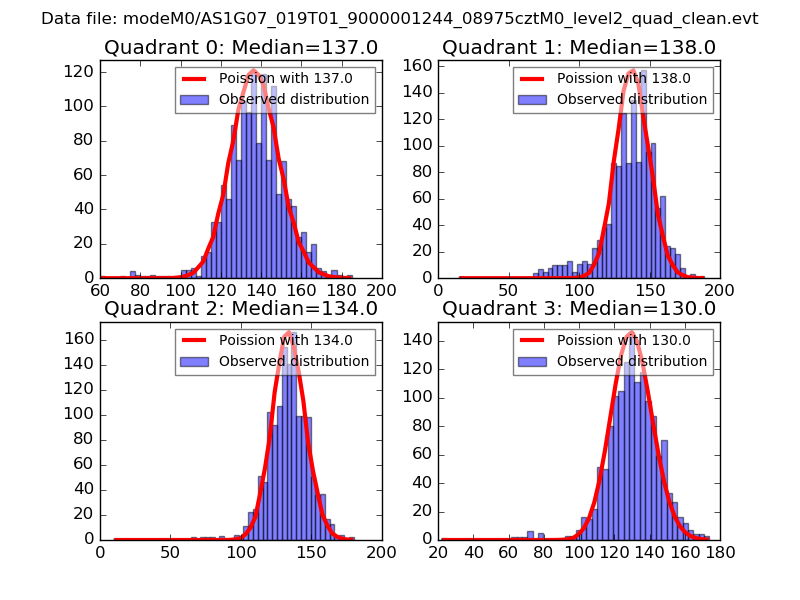 |
 |
| Quadrant-wise count rates Data is divided into 100 sec bins |
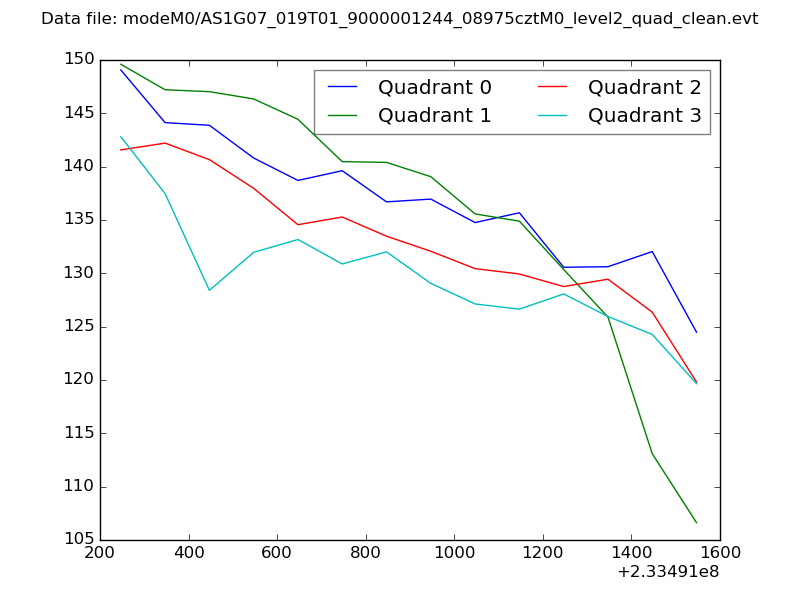 |
|
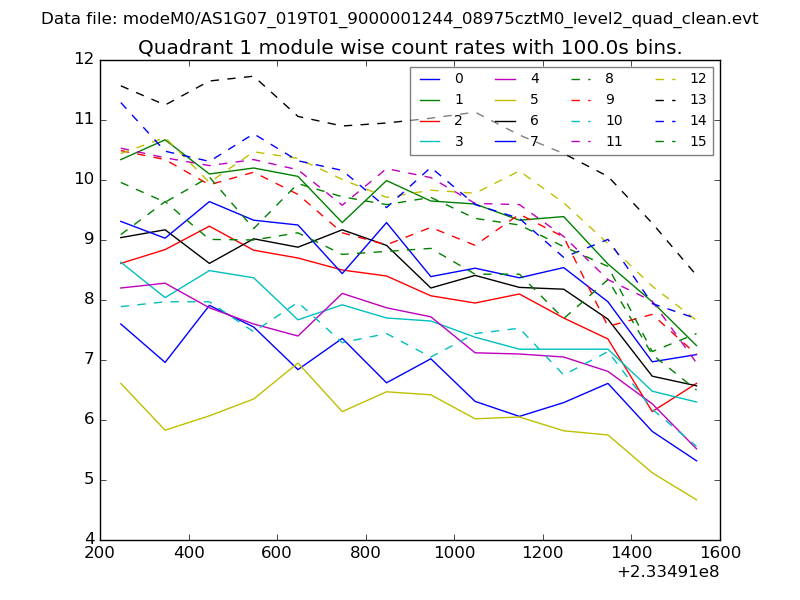
| Module-wise count rates for Quadrant A Data is divided into 100 sec bins |
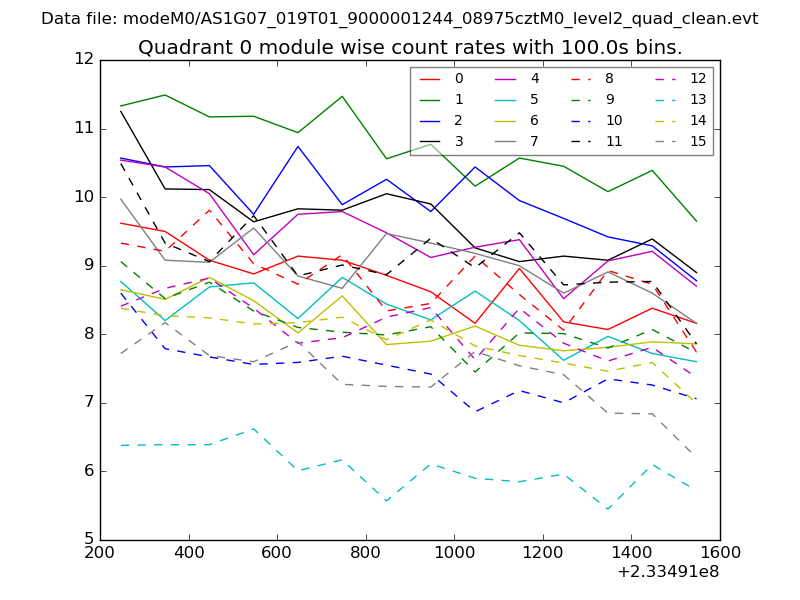 |
 |
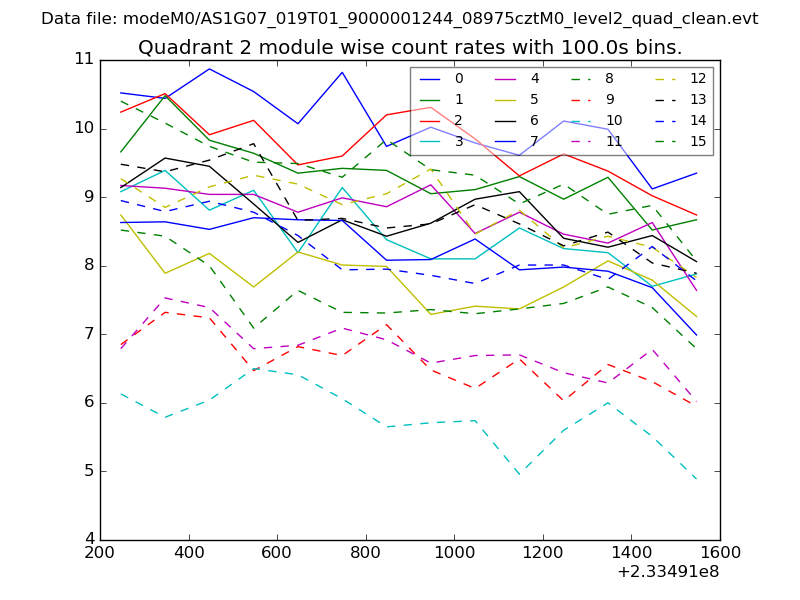
| Module-wise count rates for Quadrant B Data is divided into 100 sec bins |
 |
 |
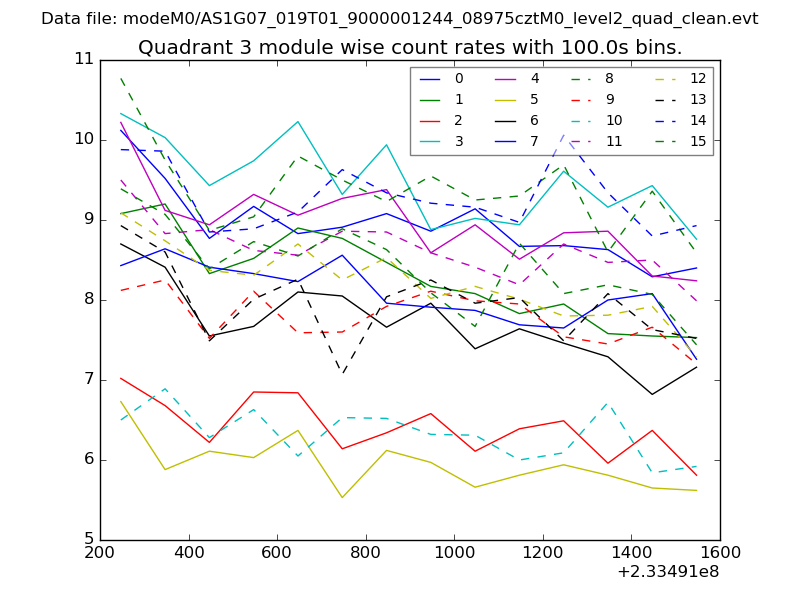
| Module-wise count rates for Quadrant C Data is divided into 100 sec bins |
 |
 |
| Module-wise count rates for Quadrant D Data is divided into 100 sec bins |
 |
 |
| Parameter | Plot |
|---|---|
| CZT HV Monitor | 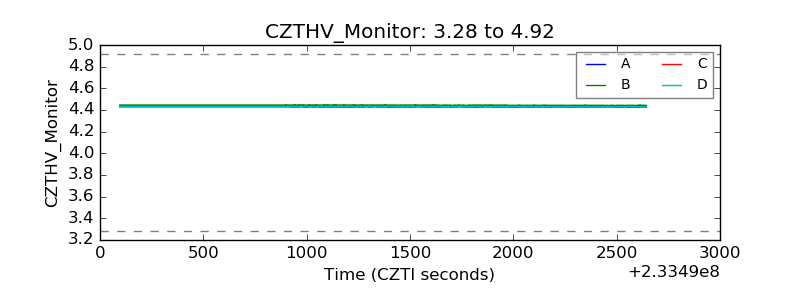 |
| D_VDD |  |
| Temperature 1 | 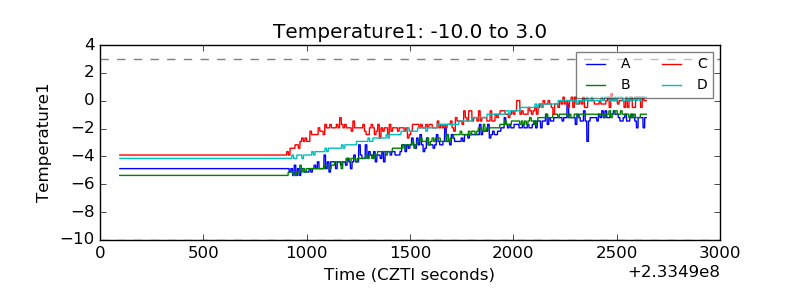 |
| Veto HV Monitor |  |
| Veto LLD | 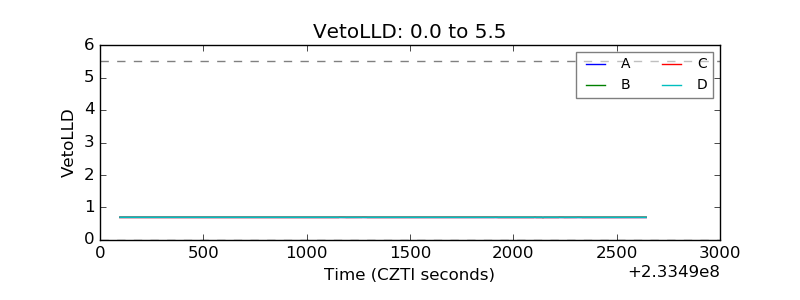 |
| Alpha Counter | 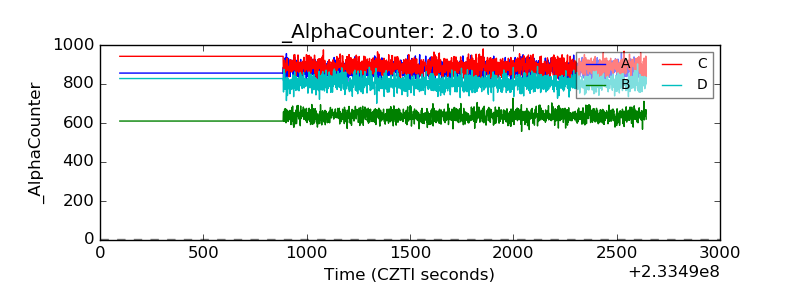 |
| _CPM_Rate | 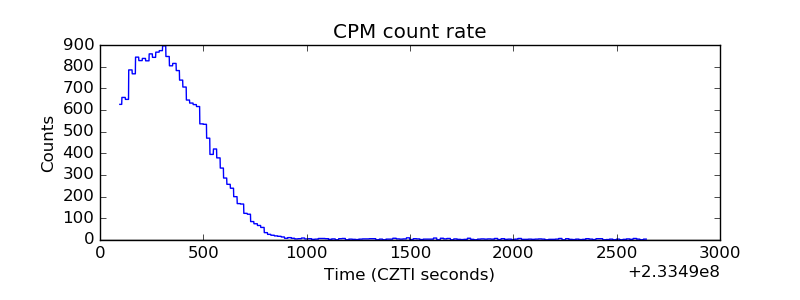 |
| CZT Counter | 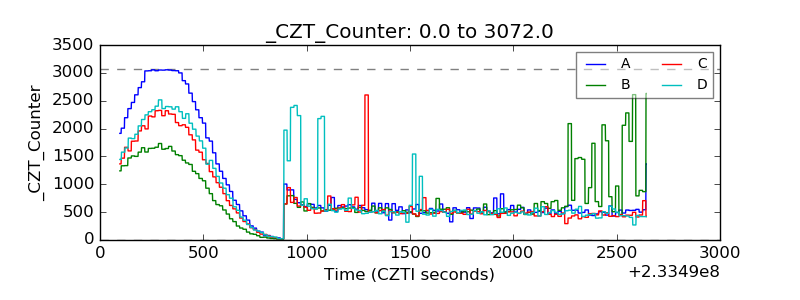 |
| +2.5 Volts monitor |  |
| +5 Volts monitor |  |
| _ROLL_ROT | 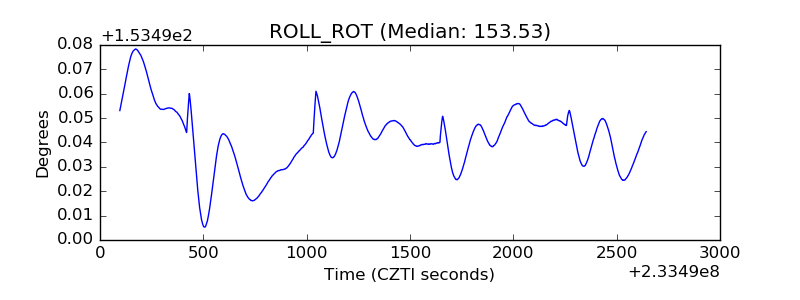 |
| _Roll_DEC | 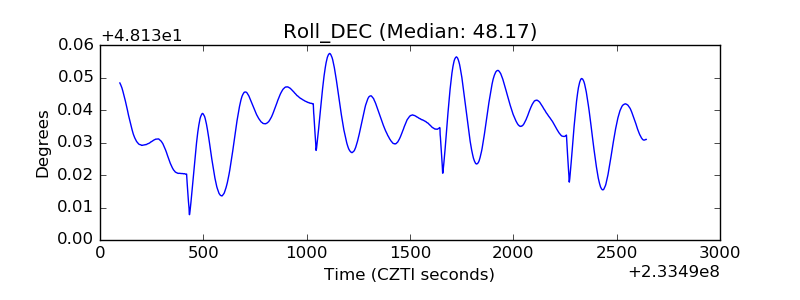 |
| _Roll_RA |  |
| Veto Counter | 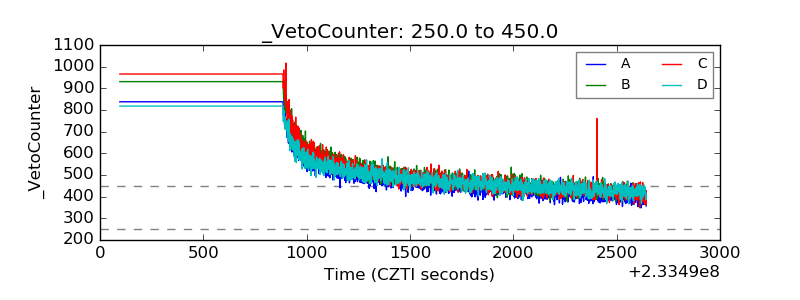 |