| Param | Original file | Final file |
|---|---|---|
| Filename | modeM0/AS1A03_025T08_9000001248cztM0_level2.fits | modeM0/AS1A03_025T08_9000001248cztM0_level2_quad_clean.evt |
| Size (bytes) | 462,864,960 | 420,425,280 |
| Size | 441.4 MB | 400.9 MB |
| Events in quadrant A | 2,851,542 | 2,506,475 |
| Events in quadrant B | 2,729,256 | 2,498,546 |
| Events in quadrant C | 2,708,738 | 2,229,397 |
| Events in quadrant D | 2,438,414 | 2,210,222 |
| Mode M9 | |||
|---|---|---|---|
| Quadrant | BADHDUFLAG | Total packets | Discarded packets |
| A | 0 | 105 | 0 |
| B | 0 | 104 | 0 |
| C | 0 | 103 | 0 |
| D | 0 | 105 | 0 |
| Mode M0 | |||
|---|---|---|---|
| Quadrant | BADHDUFLAG | Total packets | Discarded packets |
| A | 0 | 109831 | 0 |
| B | 0 | 105549 | 0 |
| C | 0 | 111337 | 0 |
| D | 0 | 103134 | 0 |
| Mode SS | |||
|---|---|---|---|
| Quadrant | BADHDUFLAG | Total packets | Discarded packets |
| A | 0 | 978 | 0 |
| B | 0 | 996 | 0 |
| C | 0 | 998 | 0 |
| D | 0 | 996 | 0 |
| Quadrant | Total seconds | Saturated seconds | Saturation percentage |
|---|---|---|---|
| A | 47779 | 964 | 2.017623% |
| B | 47940 | 1220 | 2.544848% |
| C | 47826 | 2309 | 4.827918% |
| D | 47816 | 607 | 1.269450% |
Noise dominated data is calculated using 1-second bins in cleaned event files. If a bin has >2000 counts, and if more than 50% of those come from <1% of pixels, then it is considered to be noise-dominated and hence unusable.
| Quadrant | # 1 sec bins | Bins with >0 counts | Bins with >2000 counts | High rate bins dominated by noise | Noise dominated (total time) | Noise dominated (detector-on time) | Marked lightcurve |
|---|---|---|---|---|---|---|---|
| A | 67311 | 48973 | 0 | 0 | 0.00% | 0.00% |  |
| B | 67311 | 49077 | 0 | 0 | 0.00% | 0.00% |  |
| C | 67311 | 48719 | 0 | 0 | 0.00% | 0.00% |  |
| D | 67311 | 49041 | 0 | 0 | 0.00% | 0.00% |  |
Top three noisy pixels from each quadrant. If the there are fewer than three noisy pixels in the level2.evt file, extra rows are filled as -1
| Pixel properties | Quadrant properties | ||||||
|---|---|---|---|---|---|---|---|
| Quadrant | DetID | PixID | Counts | Sigma | Mean | Median | Sigma |
| A | 0 | 29 | 2637 | 10.4 | 740 | 692 | 187.0 |
| A | 7 | 110 | 2430 | 9.29 | 740 | 692 | 187.0 |
| A | 0 | 30 | 2075 | 7.4 | 740 | 692 | 187.0 |
| B | 2 | 9 | 2338 | 11.4 | 721 | 686 | 144.9 |
| B | 14 | 254 | 1910 | 8.45 | 721 | 686 | 144.9 |
| B | 3 | 17 | 1846 | 8.01 | 721 | 686 | 144.9 |
| C | 1 | 81 | 1983 | 6.98 | 715 | 664 | 188.9 |
| C | 1 | 80 | 1974 | 6.93 | 715 | 664 | 188.9 |
| C | 12 | 241 | 1885 | 6.46 | 715 | 664 | 188.9 |
| D | 10 | 189 | 1802 | 6.28 | 694 | 630 | 186.5 |
| D | 6 | 231 | 1794 | 6.24 | 694 | 630 | 186.5 |
| D | 3 | 14 | 1765 | 6.09 | 694 | 630 | 186.5 |
Histogram calculated using DETX and DETY for each event in the final _common_clean file
| Quadrant A | 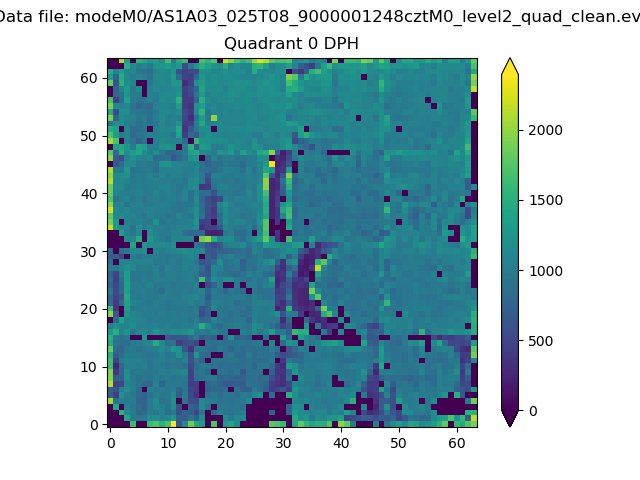 |
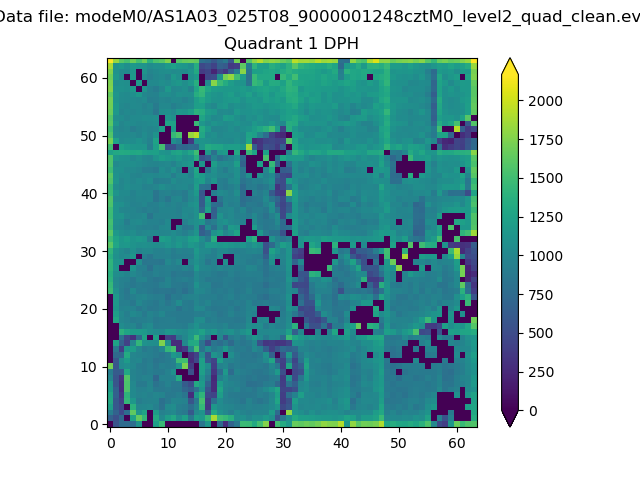 |
Quadrant B |
|---|---|---|---|
| Quadrant D |  |
 |
Quadrant C |
| Plot type | Count rate plots | Images |
|---|---|---|
| Comparison with Poisson distribution Blue bars denote a histogram of data divided into 1 sec bins. Red curve is a Poisson curve with rate = median count rate of data. |
 |
 |
| Quadrant-wise count rates Data is divided into 100 sec bins |
 |
|
| Module-wise count rates for Quadrant A Data is divided into 100 sec bins |
 |
 |
| Module-wise count rates for Quadrant B Data is divided into 100 sec bins |
 |
 |
| Module-wise count rates for Quadrant C Data is divided into 100 sec bins |
 |
 |
| Module-wise count rates for Quadrant D Data is divided into 100 sec bins |
 |
 |
| Parameter | Plot |
|---|---|
| CZT HV Monitor |  |
| D_VDD |  |
| Temperature 1 |  |
| Veto HV Monitor |  |
| Veto LLD |  |
| Alpha Counter |  |
| _CPM_Rate |  |
| CZT Counter |  |
| +2.5 Volts monitor |  |
| +5 Volts monitor | 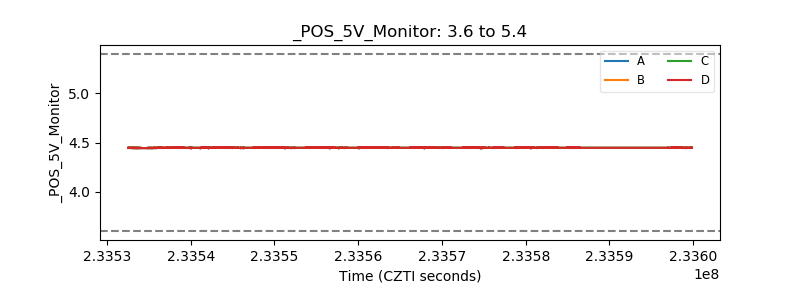 |
| _ROLL_ROT |  |
| _Roll_DEC |  |
| _Roll_RA |  |
| Veto Counter |  |