| Param | Original file | Final file |
|---|---|---|
| Filename | modeM0/AS1A03_025T08_9000001248_08983cztM0_level2.evt | modeM0/AS1A03_025T08_9000001248_08983cztM0_level2_quad_clean.evt |
| Size (bytes) | 440,542,080 | 81,449,280 |
| Size | 420.1 MB | 77.7 MB |
| Events in quadrant A | 3,433,071 | 505,336 |
| Events in quadrant B | 3,158,160 | 510,644 |
| Events in quadrant C | 3,079,210 | 500,764 |
| Events in quadrant D | 3,219,367 | 486,192 |
| Mode M9 | |||
|---|---|---|---|
| Quadrant | BADHDUFLAG | Total packets | Discarded packets |
| A | 0 | 10 | 0 |
| B | 0 | 10 | 0 |
| C | 0 | 10 | 0 |
| D | 0 | 11 | 0 |
| Mode M0 | |||
|---|---|---|---|
| Quadrant | BADHDUFLAG | Total packets | Discarded packets |
| A | 0 | 14356 | 20 |
| B | 0 | 13721 | 14 |
| C | 0 | 13801 | 4 |
| D | 0 | 14309 | 6 |
| Mode SS | |||
|---|---|---|---|
| Quadrant | BADHDUFLAG | Total packets | Discarded packets |
| A | 0 | 134 | 0 |
| B | 0 | 134 | 0 |
| C | 0 | 134 | 0 |
| D | 0 | 134 | 0 |
| Quadrant | Total seconds | Saturated seconds | Saturation percentage |
|---|---|---|---|
| A | 6649 | 32 | 0.481275% |
| B | 6649 | 31 | 0.466236% |
| C | 6654 | 34 | 0.510971% |
| D | 6653 | 49 | 0.736510% |
Noise dominated data is calculated using 1-second bins in cleaned event files. If a bin has >2000 counts, and if more than 50% of those come from <1% of pixels, then it is considered to be noise-dominated and hence unusable.
| Quadrant | # 1 sec bins | Bins with >0 counts | Bins with >2000 counts | High rate bins dominated by noise | Noise dominated (total time) | Noise dominated (detector-on time) | Marked lightcurve |
|---|---|---|---|---|---|---|---|
| A | 7650 | 6656 | 6 | 6 | 0.08% | 0.09% | 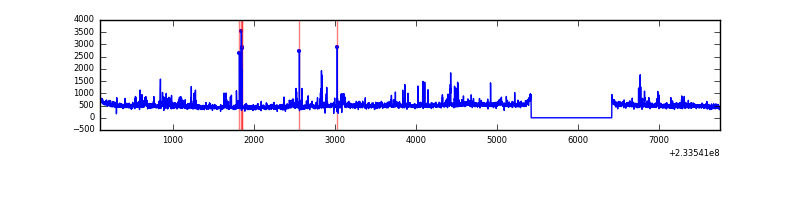 |
| B | 7650 | 6656 | 7 | 7 | 0.09% | 0.11% | 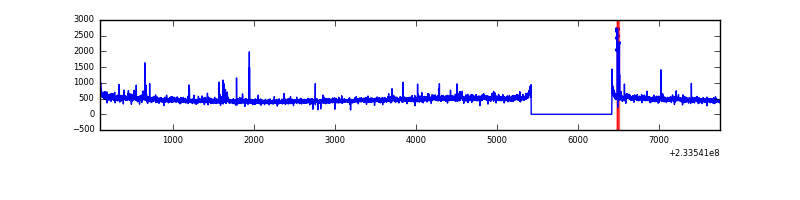 |
| C | 7650 | 6656 | 23 | 23 | 0.30% | 0.35% | 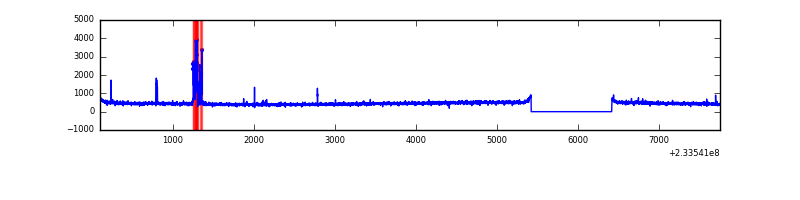 |
| D | 7650 | 6656 | 33 | 33 | 0.43% | 0.50% | 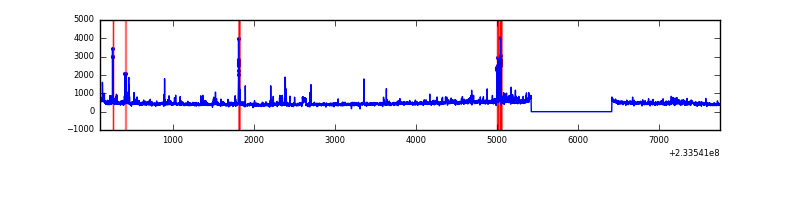 |
Top three noisy pixels from each quadrant. If the there are fewer than three noisy pixels in the level2.evt file, extra rows are filled as -1
| Pixel properties | Quadrant properties | ||||||
|---|---|---|---|---|---|---|---|
| Quadrant | DetID | PixID | Counts | Sigma | Mean | Median | Sigma |
| A | 8 | 5 | 369590 | 2306.1 | 777 | 758 | 159.9 |
| A | 5 | 16 | 35393 | 216.55 | 777 | 758 | 159.9 |
| A | 15 | 174 | 25393 | 154.03 | 777 | 758 | 159.9 |
| B | 4 | 173 | 43149 | 281.9 | 783 | 765 | 150.3 |
| B | 4 | 80 | 24828 | 160.05 | 783 | 765 | 150.3 |
| B | 0 | 219 | 23098 | 148.54 | 783 | 765 | 150.3 |
| C | 14 | 234 | 125451 | 709.95 | 755 | 760 | 175.6 |
| C | 12 | 4 | 7377 | 37.67 | 755 | 760 | 175.6 |
| C | 13 | 61 | 5756 | 28.45 | 755 | 760 | 175.6 |
| D | 1 | 52 | 204806 | 1071.25 | 746 | 726 | 190.5 |
| D | 2 | 14 | 81156 | 422.19 | 746 | 726 | 190.5 |
| D | 2 | 152 | 28889 | 147.83 | 746 | 726 | 190.5 |
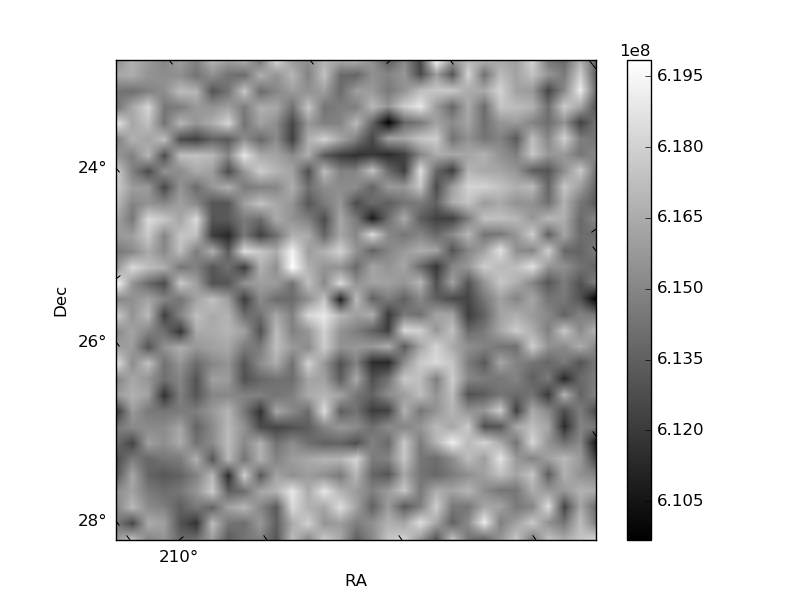
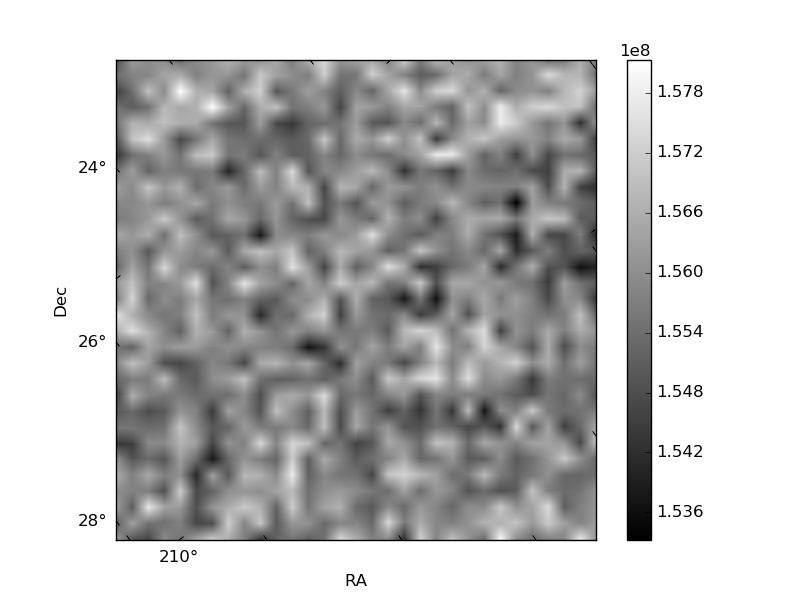
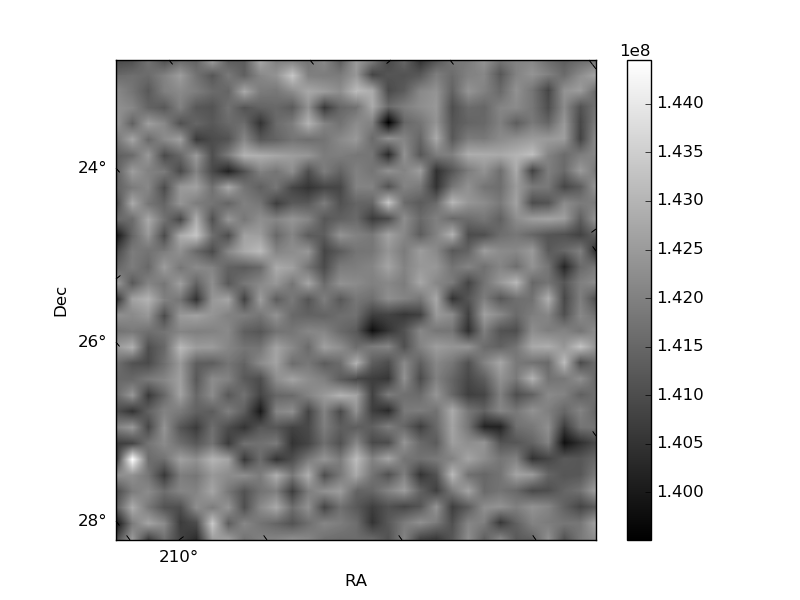
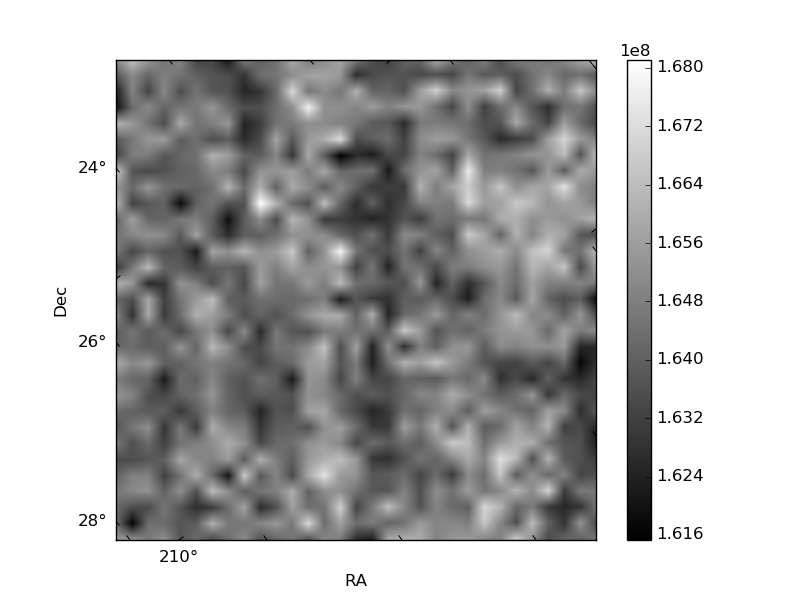
Histogram calculated using DETX and DETY for each event in the final _common_clean file
| Quadrant A | 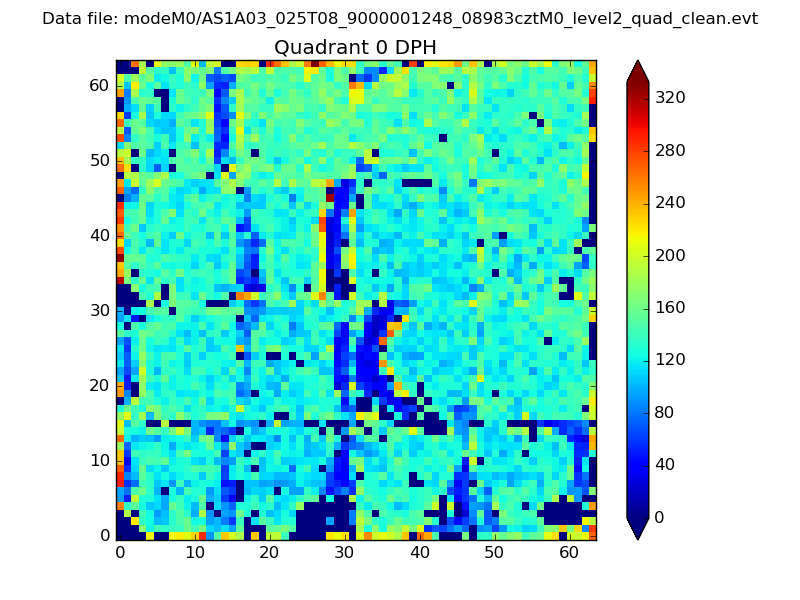 |
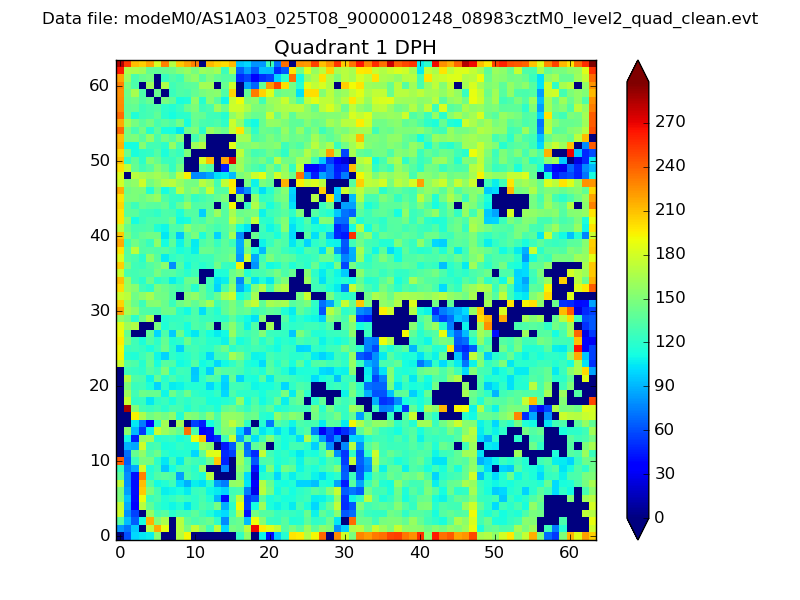 |
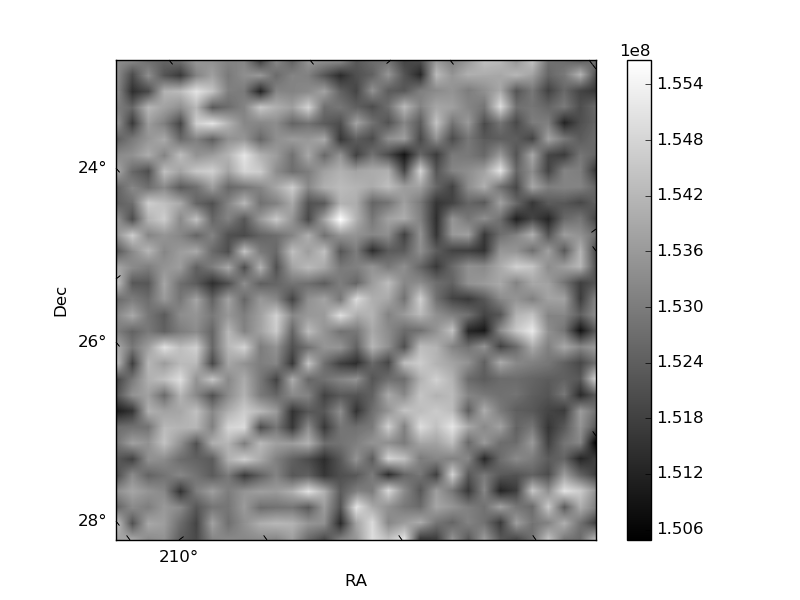
Quadrant B |
|---|---|---|---|
| Quadrant D | 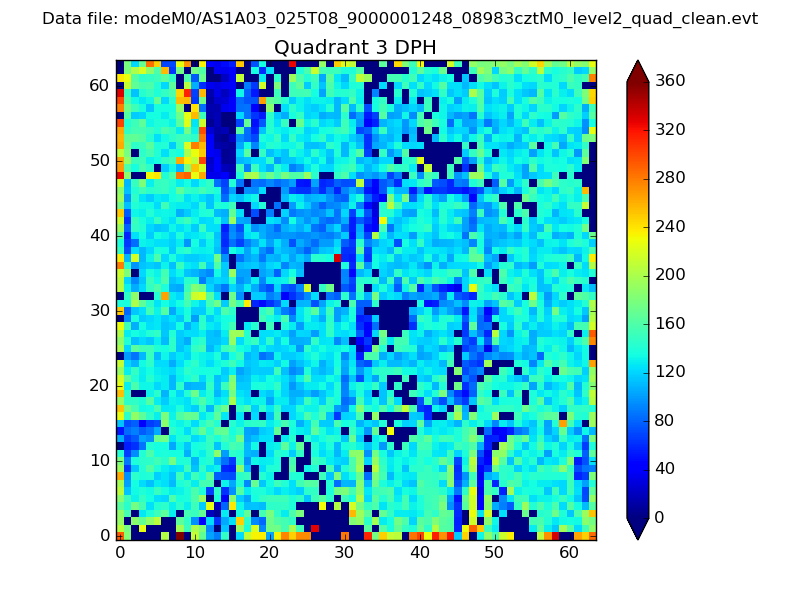 |
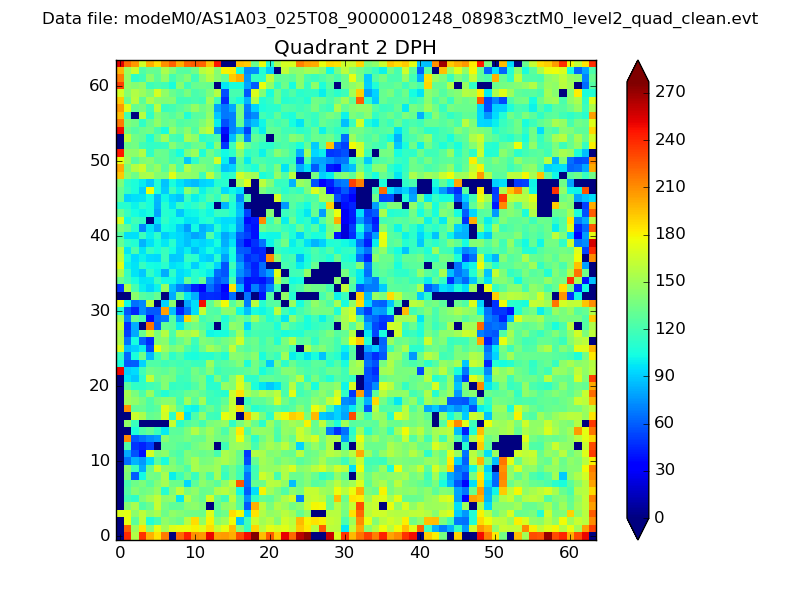 |
Quadrant C |
| Plot type | Count rate plots | Images |
|---|---|---|
| Comparison with Poisson distribution Blue bars denote a histogram of data divided into 1 sec bins. Red curve is a Poisson curve with rate = median count rate of data. |
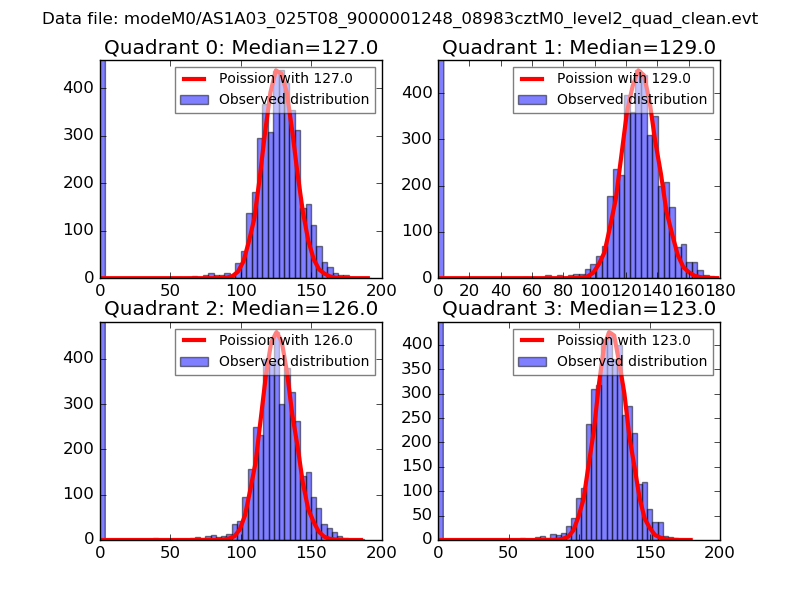 |
 |
| Quadrant-wise count rates Data is divided into 100 sec bins |
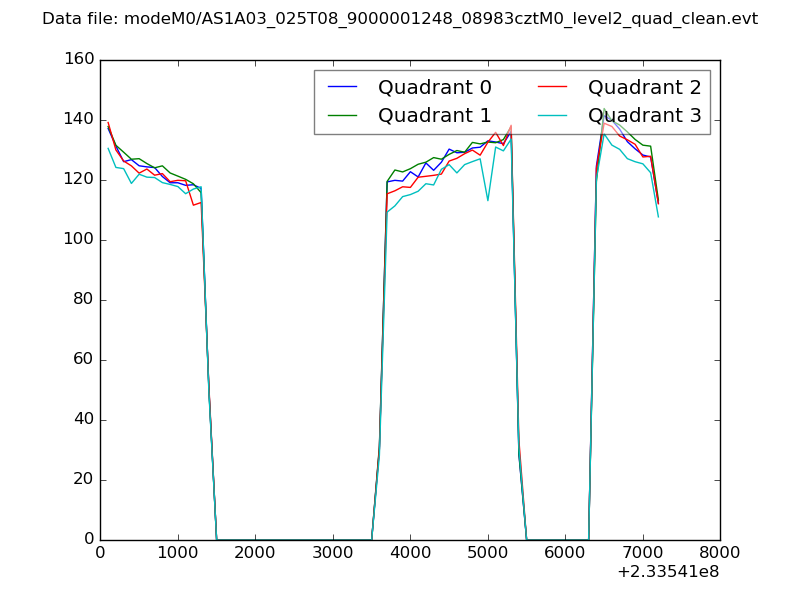 |
|
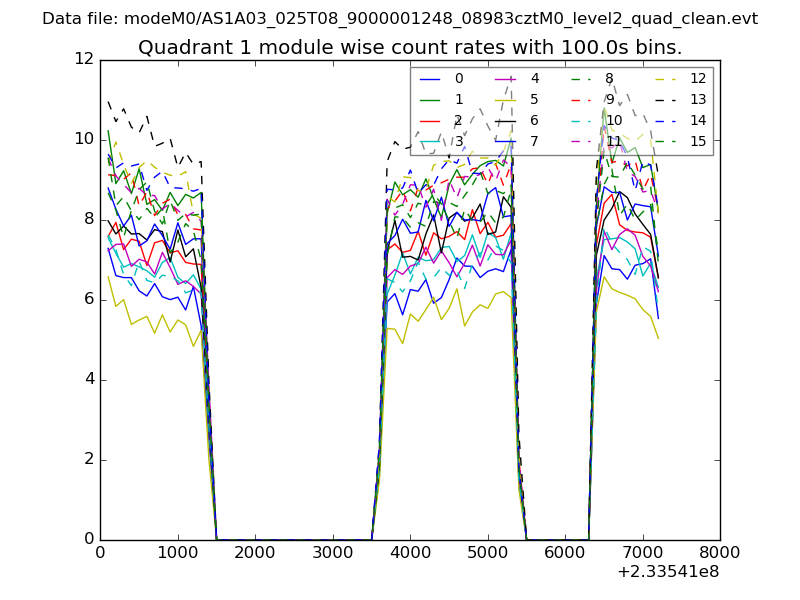
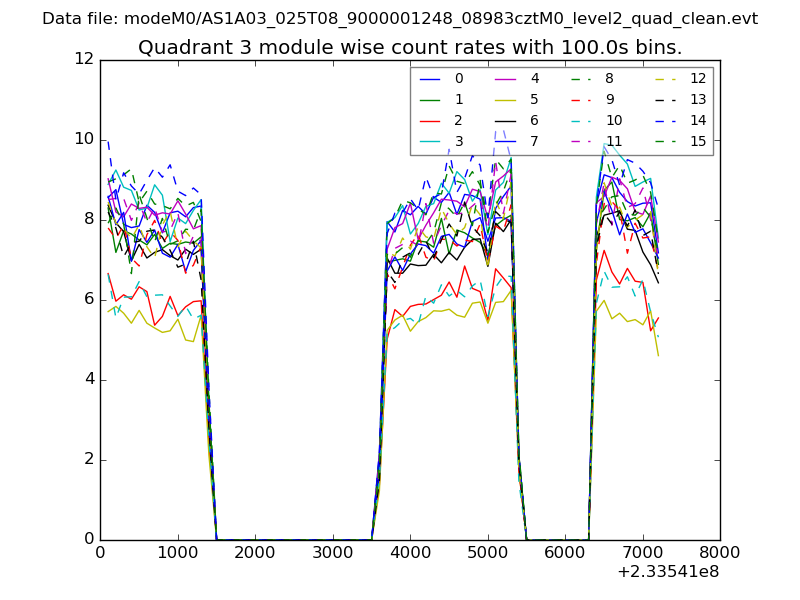
| Module-wise count rates for Quadrant A Data is divided into 100 sec bins |
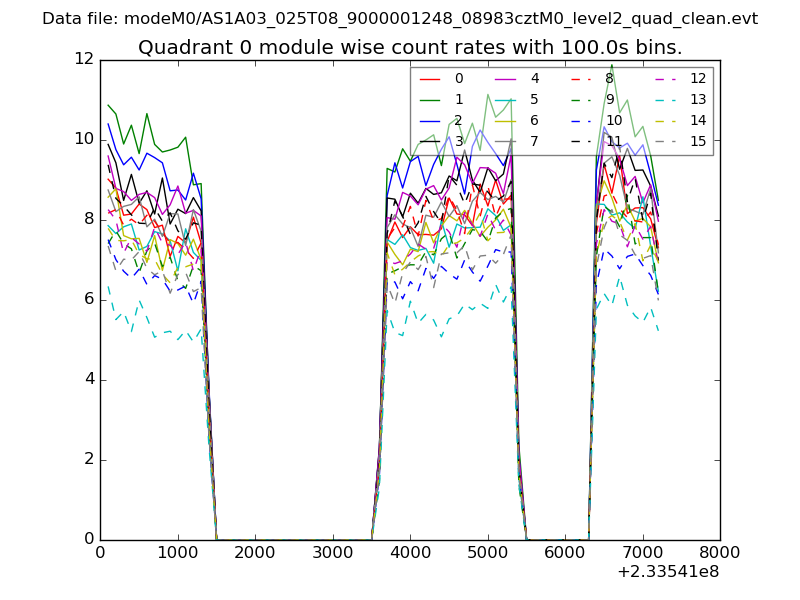 |
 |
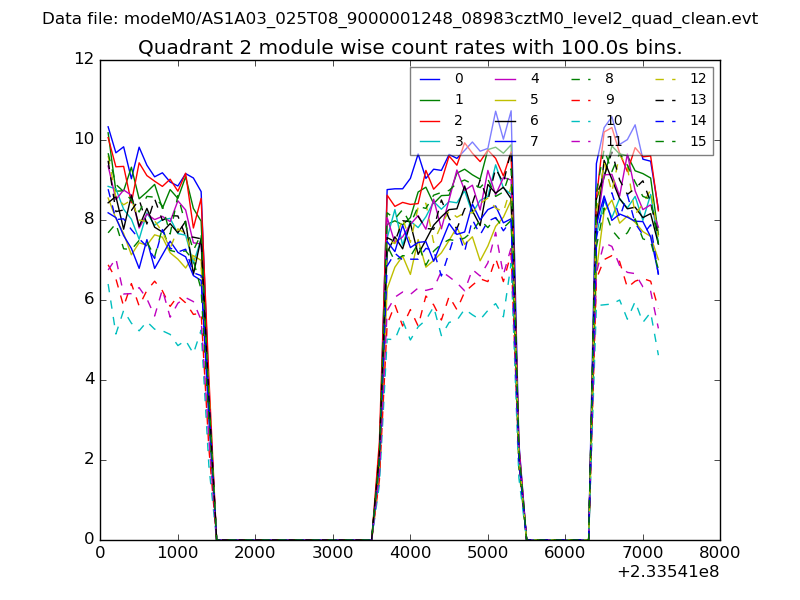
| Module-wise count rates for Quadrant B Data is divided into 100 sec bins |
 |
 |
| Module-wise count rates for Quadrant C Data is divided into 100 sec bins |
 |
 |
| Module-wise count rates for Quadrant D Data is divided into 100 sec bins |
 |
 |
| Parameter | Plot |
|---|---|
| CZT HV Monitor | 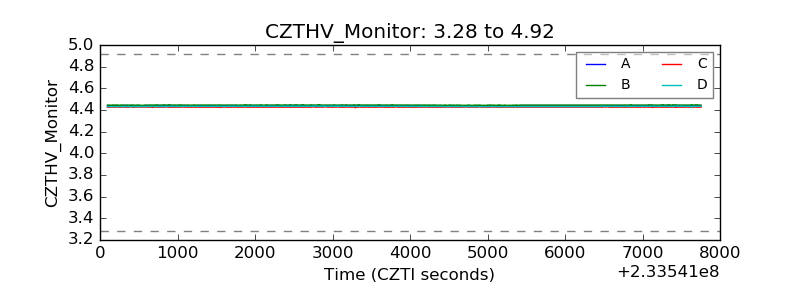 |
| D_VDD | 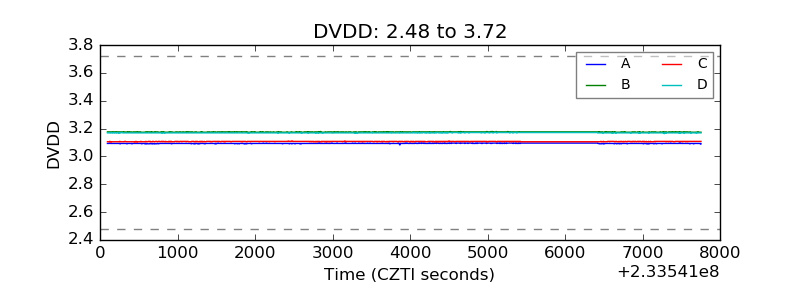 |
| Temperature 1 | 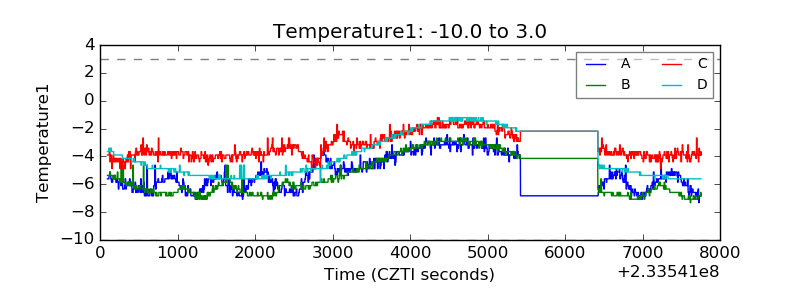 |
| Veto HV Monitor | 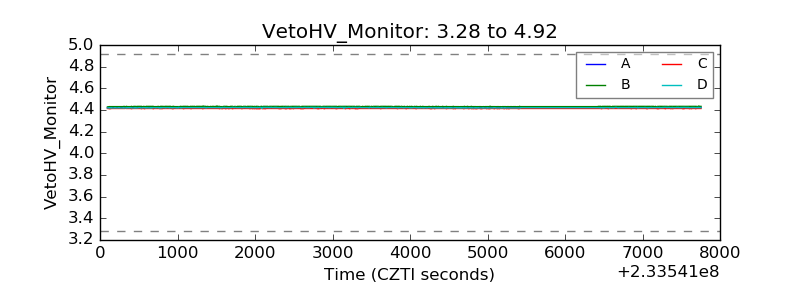 |
| Veto LLD | 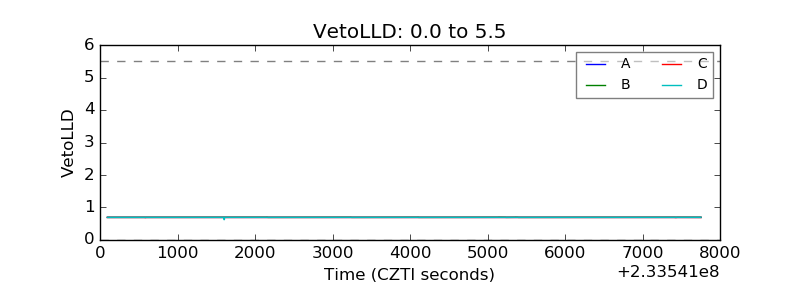 |
| Alpha Counter | 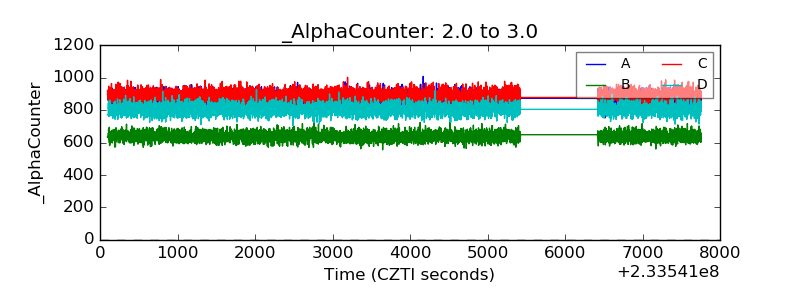 |
| _CPM_Rate | 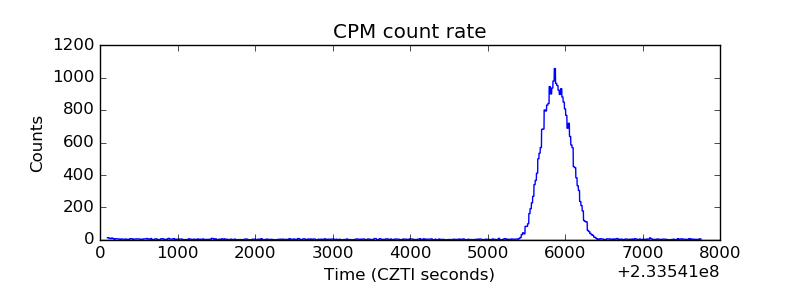 |
| CZT Counter | 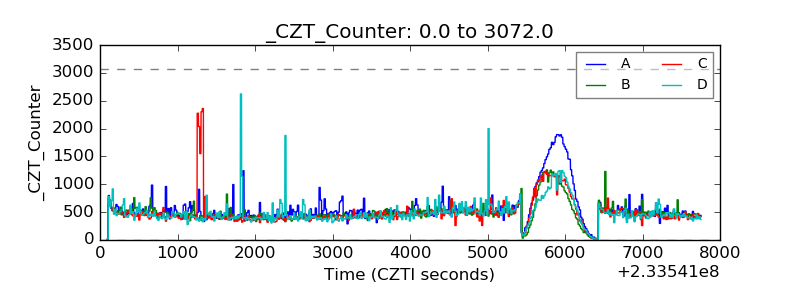 |
| +2.5 Volts monitor |  |
| +5 Volts monitor |  |
| _ROLL_ROT | 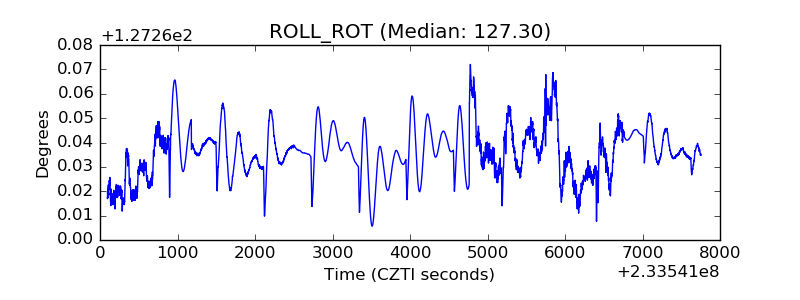 |
| _Roll_DEC | 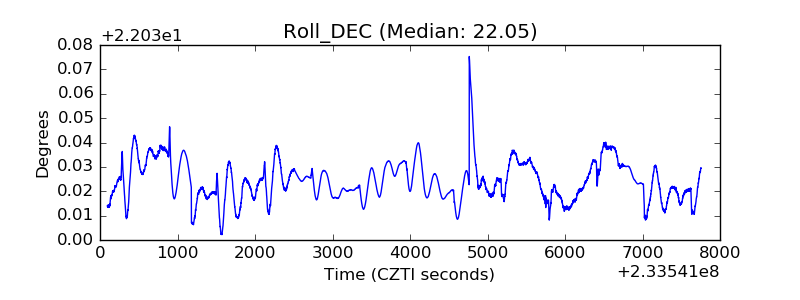 |
| _Roll_RA | 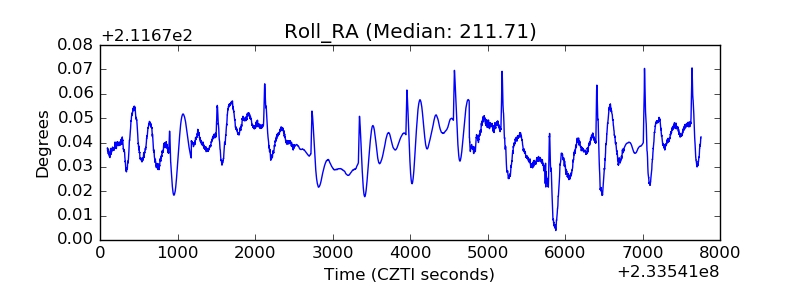 |
| Veto Counter | 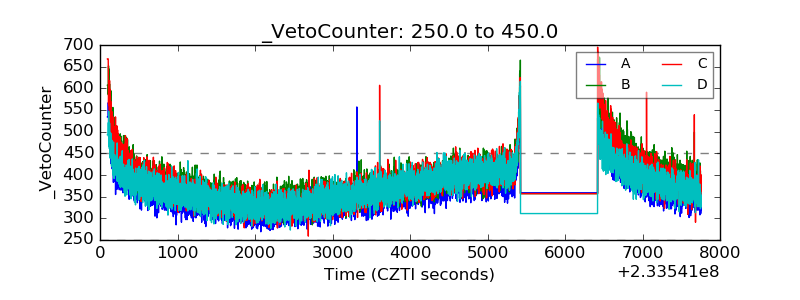 |