| Param | Original file | Final file |
|---|---|---|
| Filename | modeM0/AS1A03_025T08_9000001248_08985cztM0_level2.evt | modeM0/AS1A03_025T08_9000001248_08985cztM0_level2_quad_clean.evt |
| Size (bytes) | 1,285,361,280 | 224,720,640 |
| Size | 1.2 GB | 214.3 MB |
| Events in quadrant A | 10,517,822 | 1,379,637 |
| Events in quadrant B | 9,159,496 | 1,405,304 |
| Events in quadrant C | 8,845,792 | 1,377,677 |
| Events in quadrant D | 9,124,138 | 1,338,922 |
| Mode M9 | |||
|---|---|---|---|
| Quadrant | BADHDUFLAG | Total packets | Discarded packets |
| A | 0 | 37 | 0 |
| B | 0 | 37 | 0 |
| C | 0 | 37 | 0 |
| D | 0 | 37 | 0 |
| Mode M0 | |||
|---|---|---|---|
| Quadrant | BADHDUFLAG | Total packets | Discarded packets |
| A | 0 | 43425 | 16 |
| B | 0 | 39473 | 15 |
| C | 0 | 39308 | 13 |
| D | 0 | 40425 | 11 |
| Mode SS | |||
|---|---|---|---|
| Quadrant | BADHDUFLAG | Total packets | Discarded packets |
| A | 0 | 384 | 0 |
| B | 0 | 384 | 0 |
| C | 0 | 384 | 0 |
| D | 0 | 384 | 0 |
| Quadrant | Total seconds | Saturated seconds | Saturation percentage |
|---|---|---|---|
| A | 18941 | 304 | 1.604984% |
| B | 18941 | 119 | 0.628267% |
| C | 18941 | 87 | 0.459321% |
| D | 18943 | 103 | 0.543736% |
Noise dominated data is calculated using 1-second bins in cleaned event files. If a bin has >2000 counts, and if more than 50% of those come from <1% of pixels, then it is considered to be noise-dominated and hence unusable.
| Quadrant | # 1 sec bins | Bins with >0 counts | Bins with >2000 counts | High rate bins dominated by noise | Noise dominated (total time) | Noise dominated (detector-on time) | Marked lightcurve |
|---|---|---|---|---|---|---|---|
| A | 22520 | 18949 | 121 | 121 | 0.54% | 0.64% | 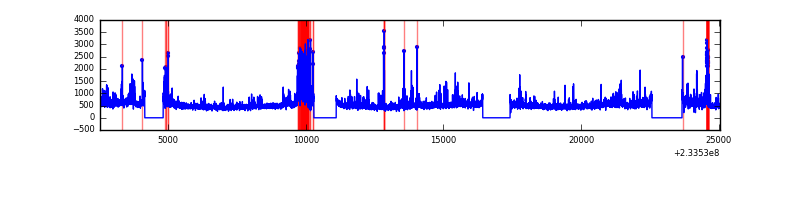 |
| B | 22520 | 18949 | 9 | 9 | 0.04% | 0.05% |  |
| C | 22520 | 18949 | 35 | 35 | 0.16% | 0.18% | 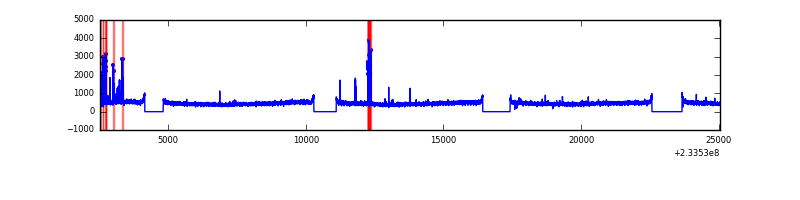 |
| D | 22520 | 18949 | 53 | 53 | 0.24% | 0.28% | 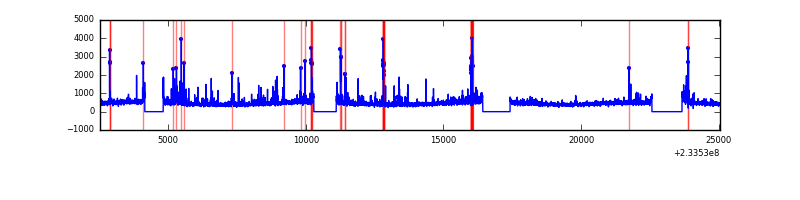 |
Top three noisy pixels from each quadrant. If the there are fewer than three noisy pixels in the level2.evt file, extra rows are filled as -1
| Pixel properties | Quadrant properties | ||||||
|---|---|---|---|---|---|---|---|
| Quadrant | DetID | PixID | Counts | Sigma | Mean | Median | Sigma |
| A | 8 | 5 | 1619912 | 3561.28 | 2249 | 2200 | 454.2 |
| A | 15 | 174 | 178134 | 387.31 | 2249 | 2200 | 454.2 |
| A | 5 | 16 | 46132 | 96.71 | 2249 | 2200 | 454.2 |
| B | 0 | 219 | 103311 | 233.4 | 2267 | 2213 | 433.2 |
| B | 4 | 173 | 78835 | 176.89 | 2267 | 2213 | 433.2 |
| B | 12 | 111 | 46758 | 102.84 | 2267 | 2213 | 433.2 |
| C | 4 | 254 | 173175 | 338.59 | 2188 | 2196 | 505.0 |
| C | 14 | 234 | 130178 | 253.44 | 2188 | 2196 | 505.0 |
| C | 13 | 61 | 16700 | 28.72 | 2188 | 2196 | 505.0 |
| D | 1 | 52 | 353777 | 634.52 | 2173 | 2120 | 554.2 |
| D | 7 | 71 | 196491 | 350.72 | 2173 | 2120 | 554.2 |
| D | 2 | 14 | 133692 | 237.4 | 2173 | 2120 | 554.2 |
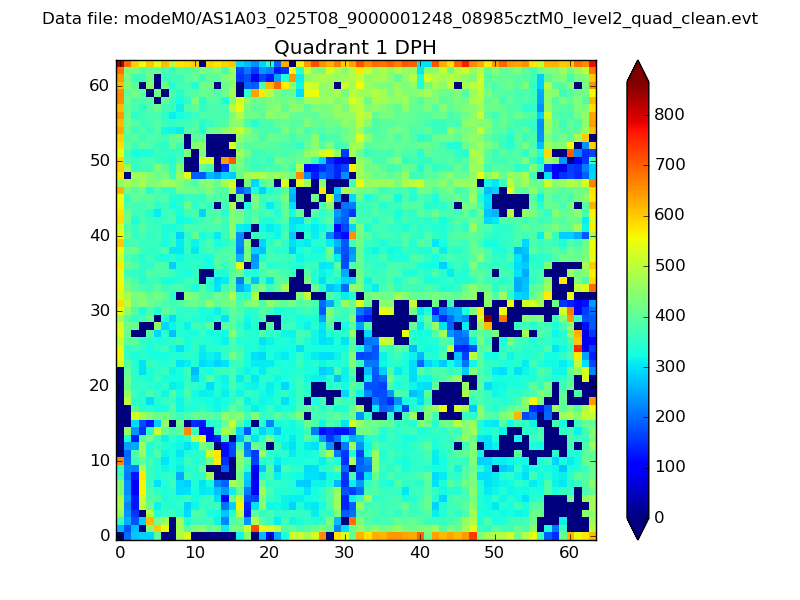
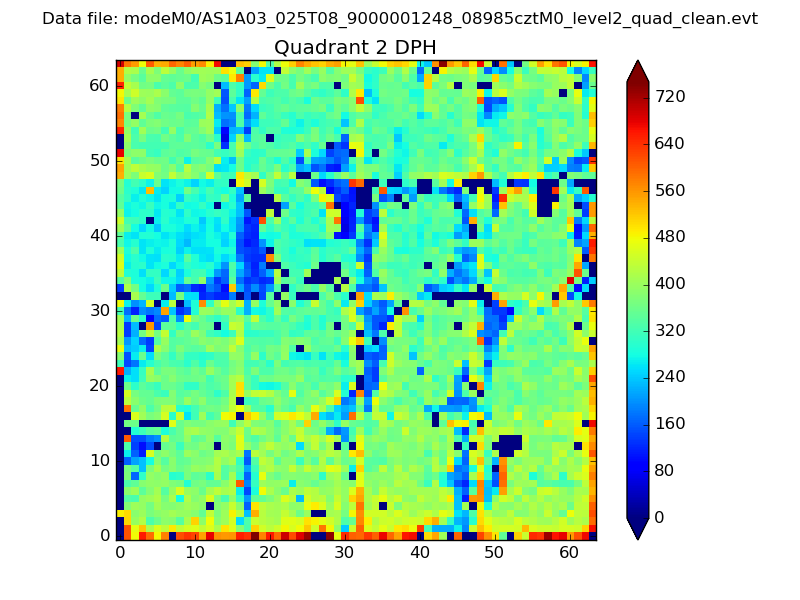
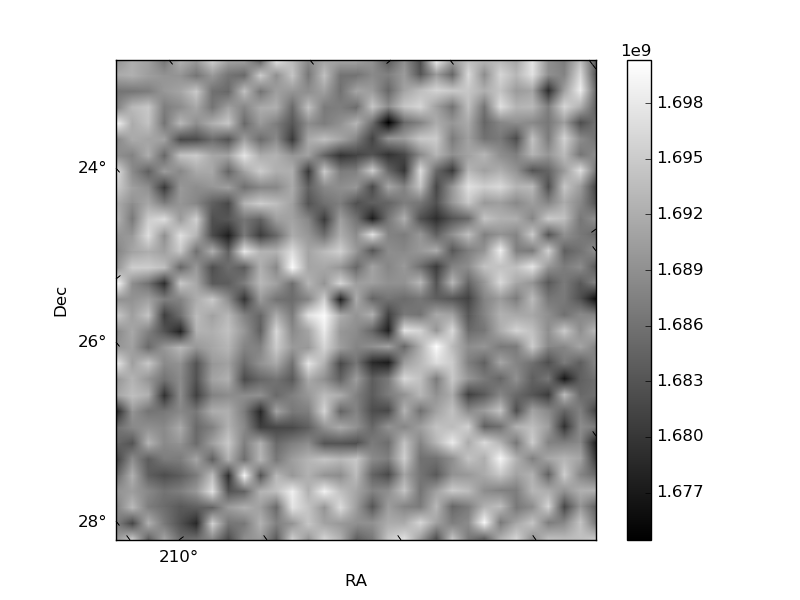
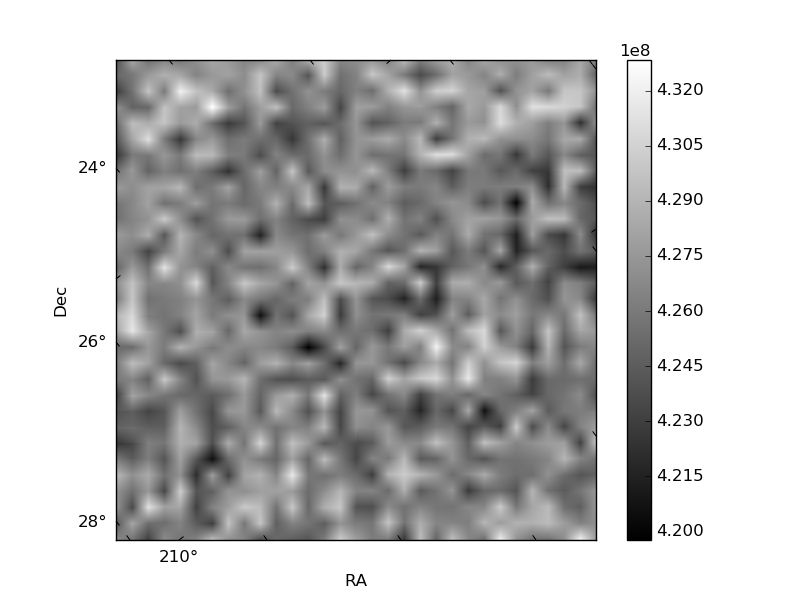
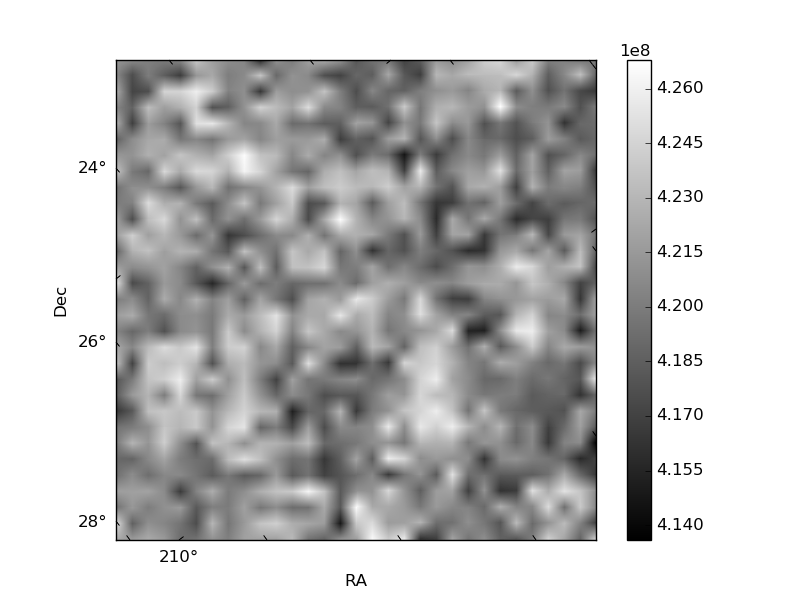
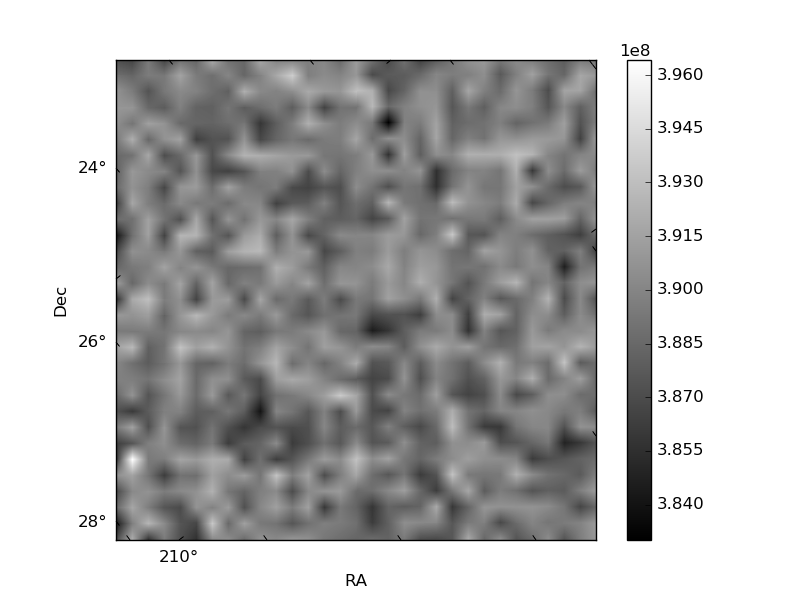
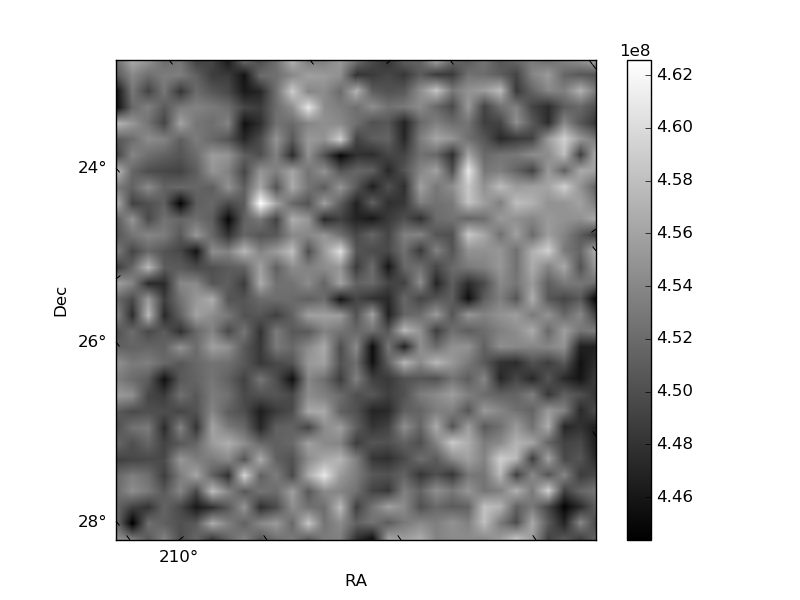
Histogram calculated using DETX and DETY for each event in the final _common_clean file
| Quadrant A | 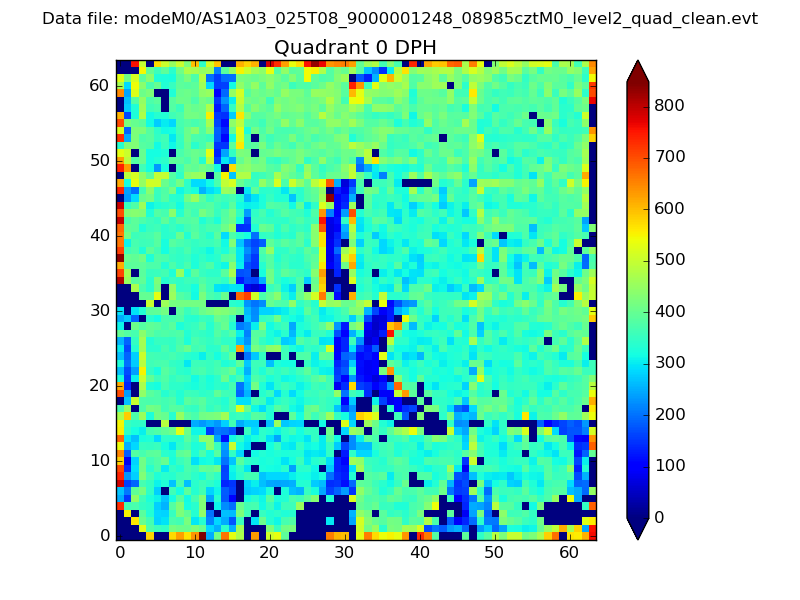 |
 |
Quadrant B |
|---|---|---|---|
| Quadrant D | 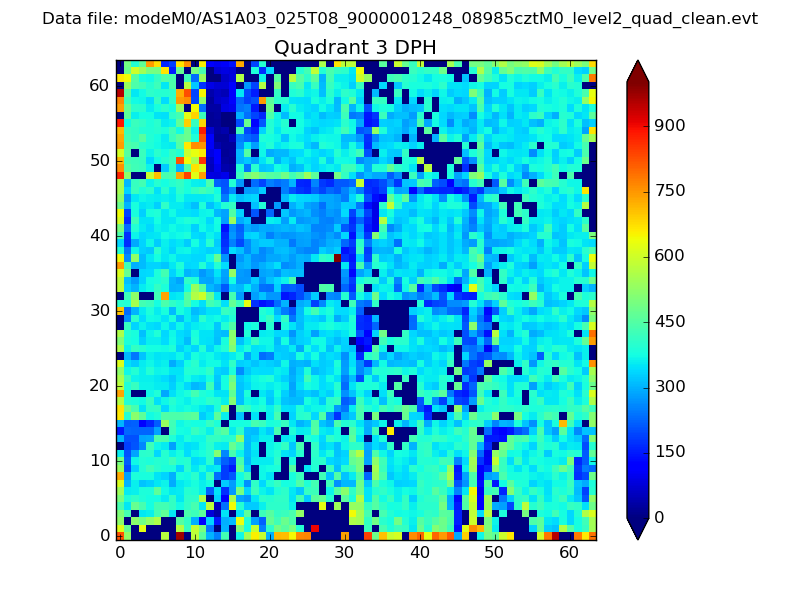 |
 |
Quadrant C |
| Plot type | Count rate plots | Images |
|---|---|---|
| Comparison with Poisson distribution Blue bars denote a histogram of data divided into 1 sec bins. Red curve is a Poisson curve with rate = median count rate of data. |
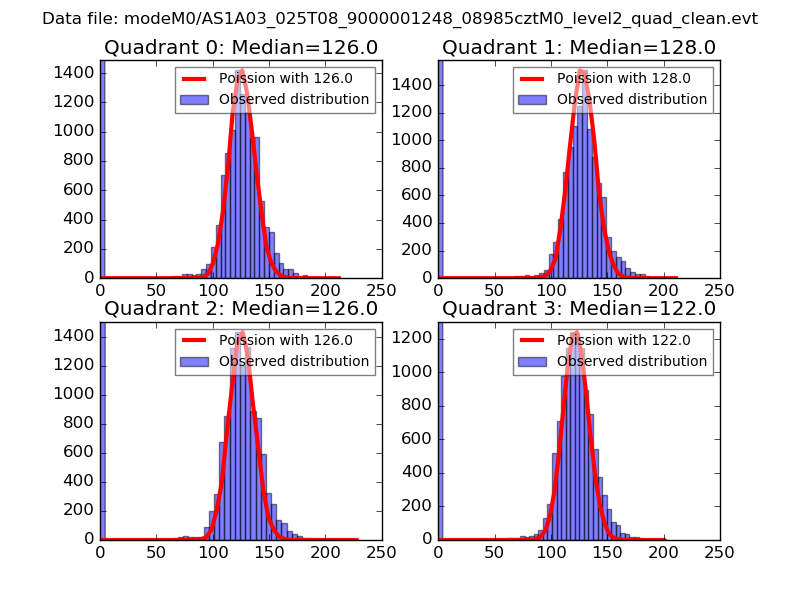 |
 |
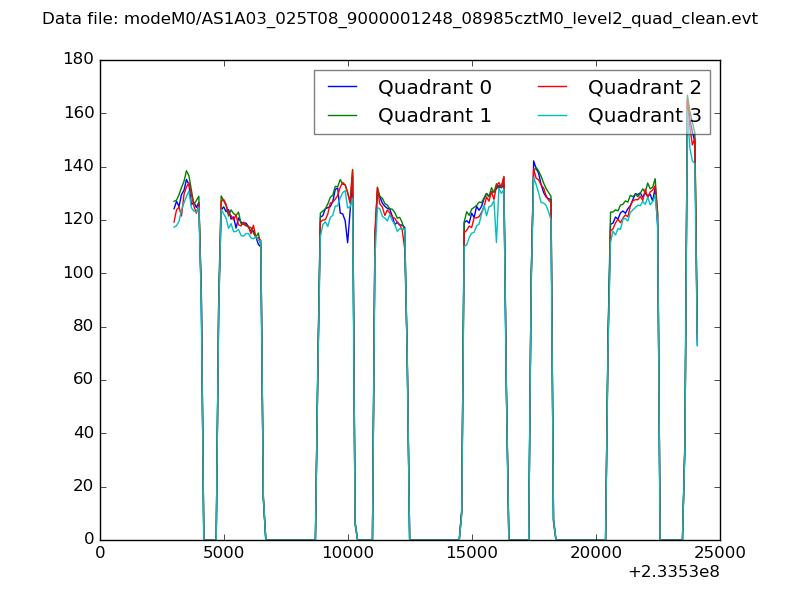
| Quadrant-wise count rates Data is divided into 100 sec bins |
 |
|
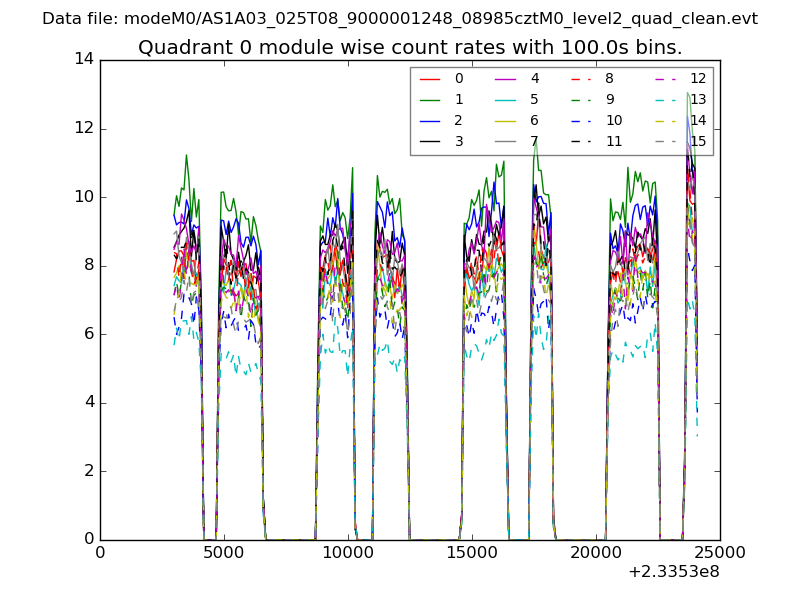
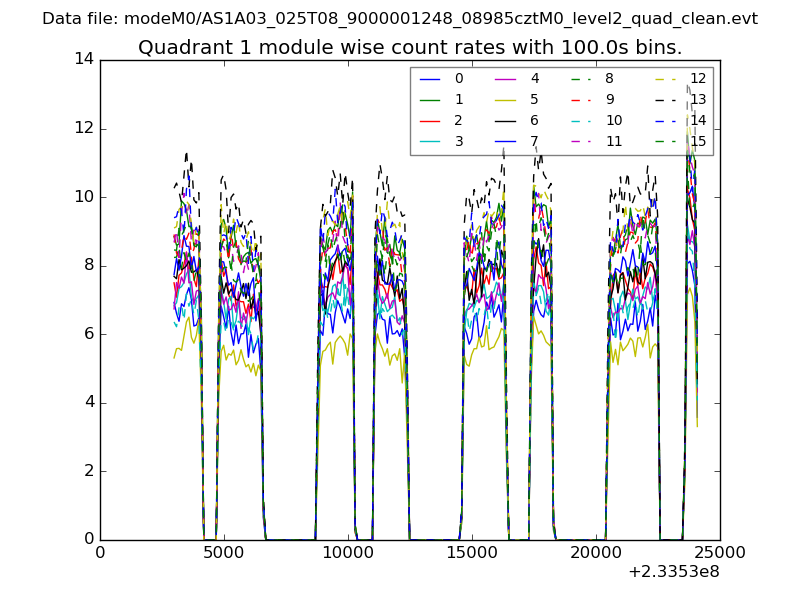
| Module-wise count rates for Quadrant A Data is divided into 100 sec bins |
 |
 |
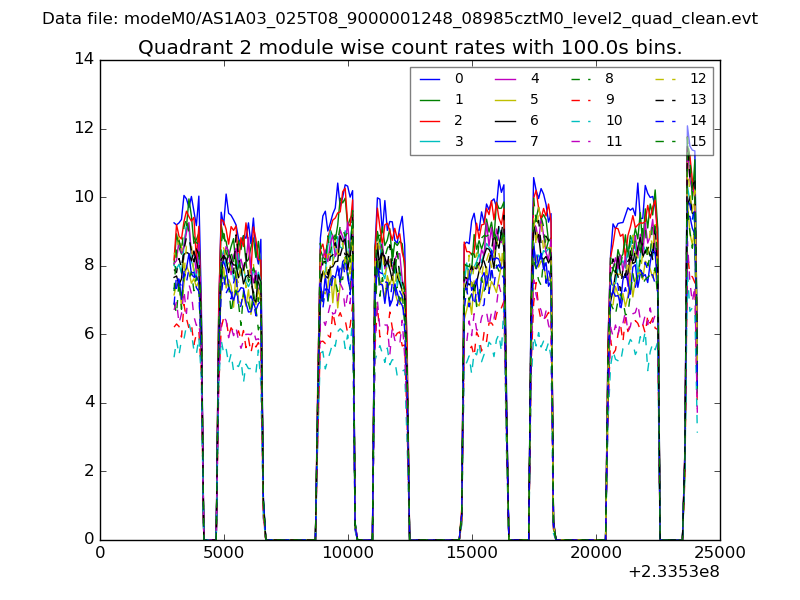
| Module-wise count rates for Quadrant B Data is divided into 100 sec bins |
 |
 |
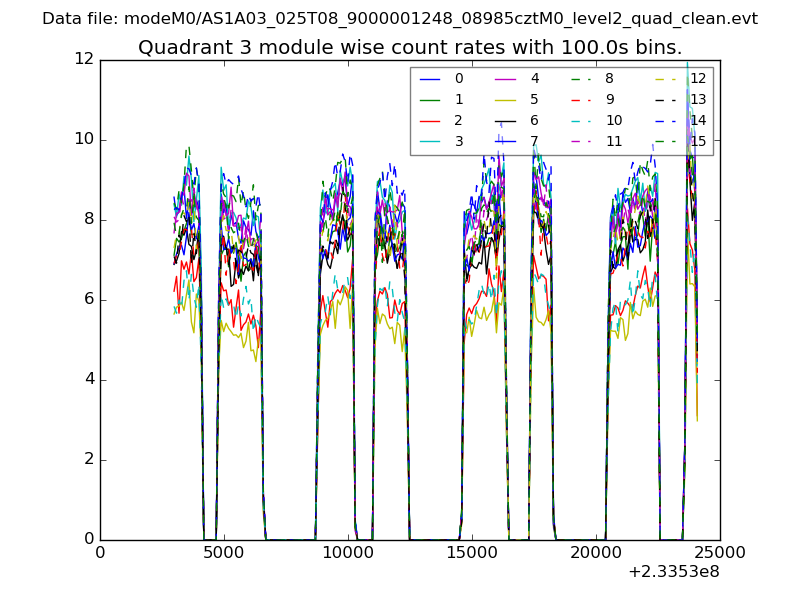
| Module-wise count rates for Quadrant C Data is divided into 100 sec bins |
 |
 |
| Module-wise count rates for Quadrant D Data is divided into 100 sec bins |
 |
 |
| Parameter | Plot |
|---|---|
| CZT HV Monitor | 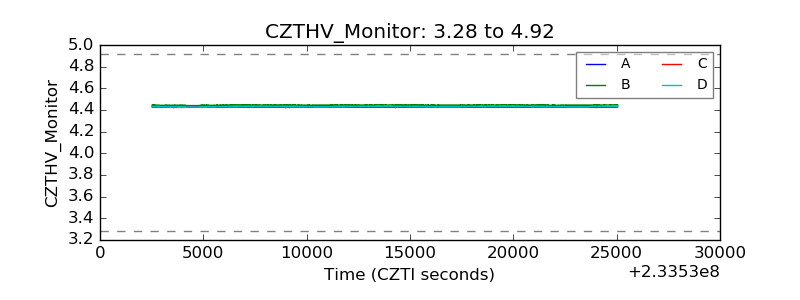 |
| D_VDD | 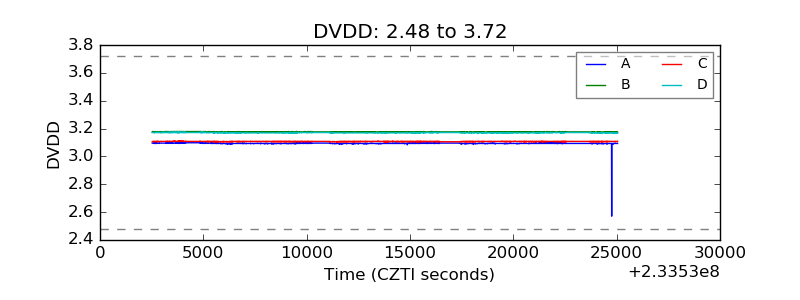 |
| Temperature 1 | 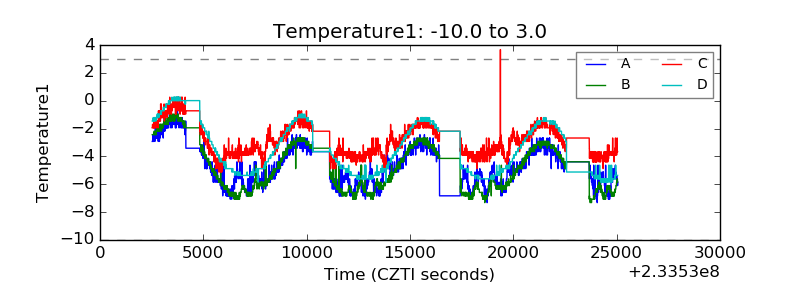 |
| Veto HV Monitor | 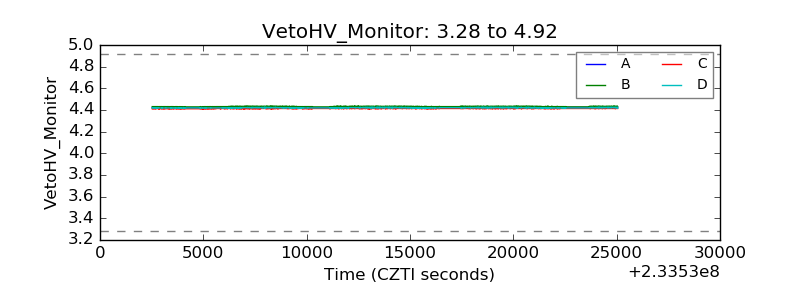 |
| Veto LLD | 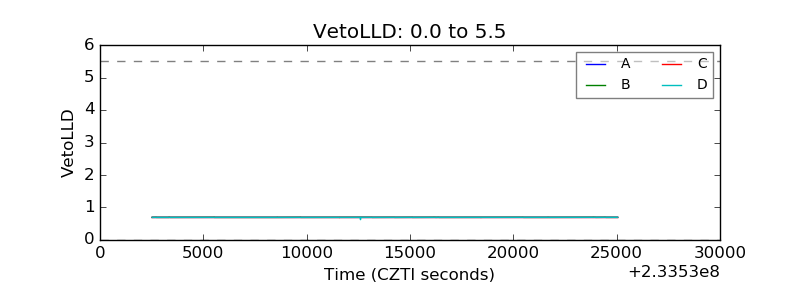 |
| Alpha Counter | 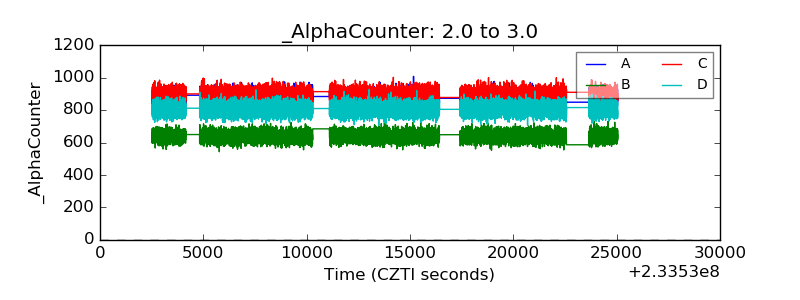 |
| _CPM_Rate | 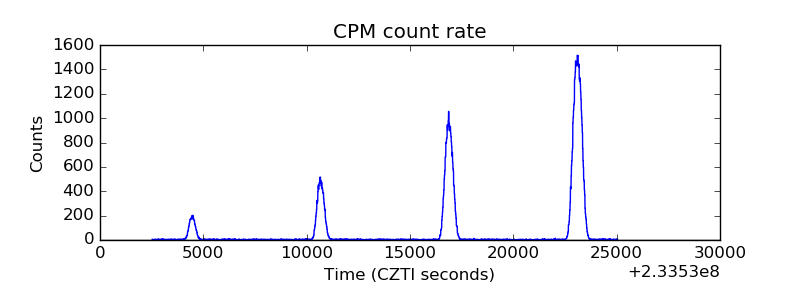 |
| CZT Counter | 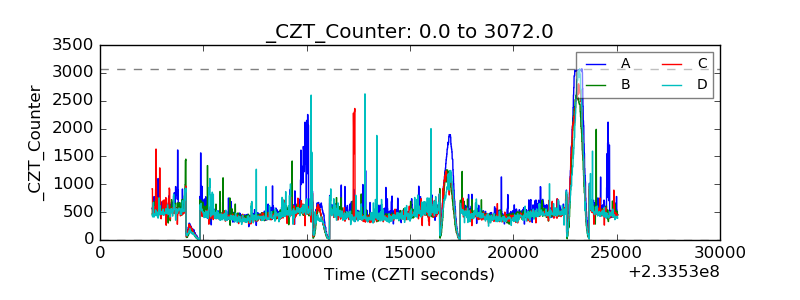 |
| +2.5 Volts monitor |  |
| +5 Volts monitor |  |
| _ROLL_ROT | 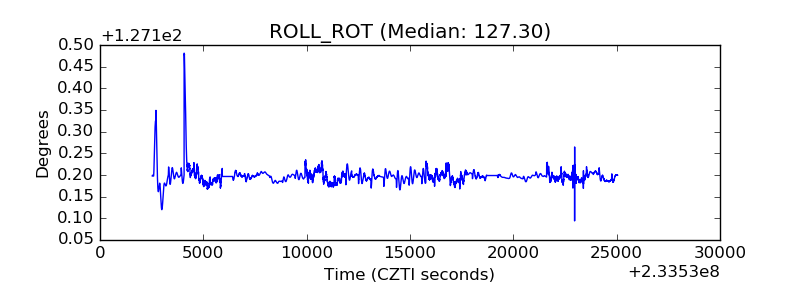 |
| _Roll_DEC | 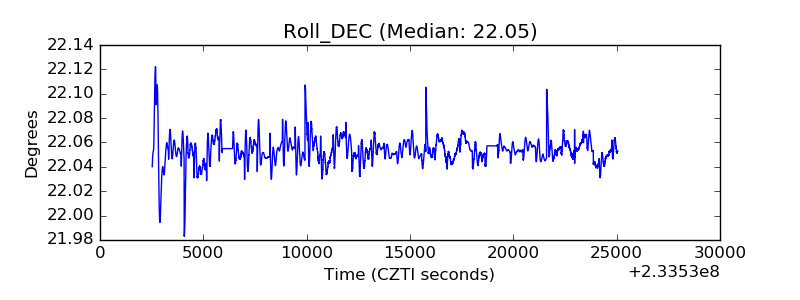 |
| _Roll_RA | 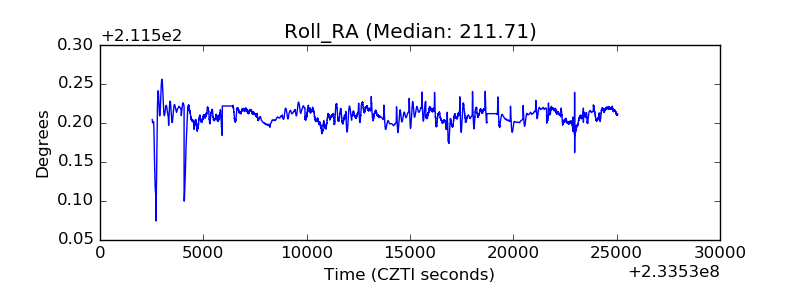 |
| Veto Counter | 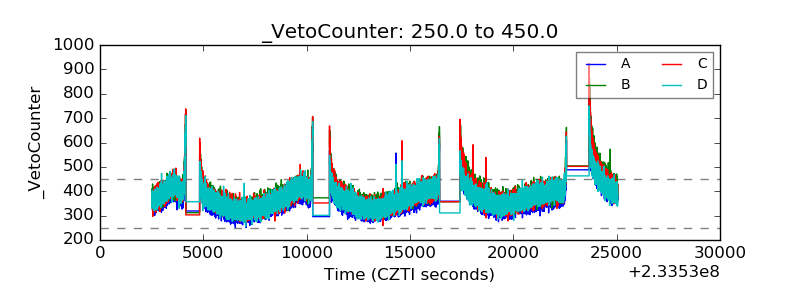 |