| Param | Original file | Final file |
|---|---|---|
| Filename | modeM0/AS1A03_025T08_9000001248_08987cztM0_level2.evt | modeM0/AS1A03_025T08_9000001248_08987cztM0_level2_quad_clean.evt |
| Size (bytes) | 461,350,080 | 62,510,400 |
| Size | 440.0 MB | 59.6 MB |
| Events in quadrant A | 3,881,224 | 369,008 |
| Events in quadrant B | 3,343,671 | 374,800 |
| Events in quadrant C | 3,064,770 | 363,406 |
| Events in quadrant D | 3,262,196 | 353,241 |
| Mode M9 | |||
|---|---|---|---|
| Quadrant | BADHDUFLAG | Total packets | Discarded packets |
| A | 0 | 19 | 0 |
| B | 0 | 19 | 0 |
| C | 0 | 19 | 0 |
| D | 0 | 20 | 0 |
| Mode M0 | |||
|---|---|---|---|
| Quadrant | BADHDUFLAG | Total packets | Discarded packets |
| A | 0 | 15561 | 3 |
| B | 0 | 13648 | 2 |
| C | 0 | 12898 | 7 |
| D | 0 | 13653 | 6 |
| Mode SS | |||
|---|---|---|---|
| Quadrant | BADHDUFLAG | Total packets | Discarded packets |
| A | 0 | 126 | 0 |
| B | 0 | 126 | 0 |
| C | 0 | 126 | 0 |
| D | 0 | 126 | 0 |
| Quadrant | Total seconds | Saturated seconds | Saturation percentage |
|---|---|---|---|
| A | 6189 | 86 | 1.389562% |
| B | 6189 | 97 | 1.567297% |
| C | 6187 | 45 | 0.727332% |
| D | 6187 | 107 | 1.729433% |
Noise dominated data is calculated using 1-second bins in cleaned event files. If a bin has >2000 counts, and if more than 50% of those come from <1% of pixels, then it is considered to be noise-dominated and hence unusable.
| Quadrant | # 1 sec bins | Bins with >0 counts | Bins with >2000 counts | High rate bins dominated by noise | Noise dominated (total time) | Noise dominated (detector-on time) | Marked lightcurve |
|---|---|---|---|---|---|---|---|
| A | 7439 | 6190 | 9 | 9 | 0.12% | 0.15% | 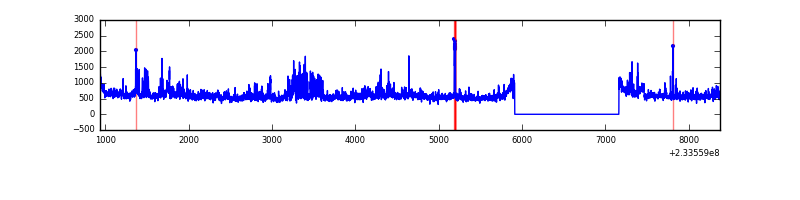 |
| B | 7439 | 6189 | 4 | 4 | 0.05% | 0.06% | 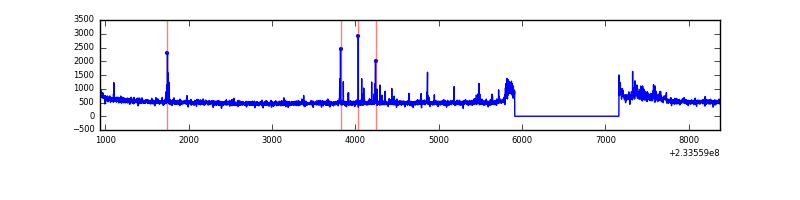 |
| C | 7439 | 6190 | 0 | 0 | 0.00% | 0.00% | 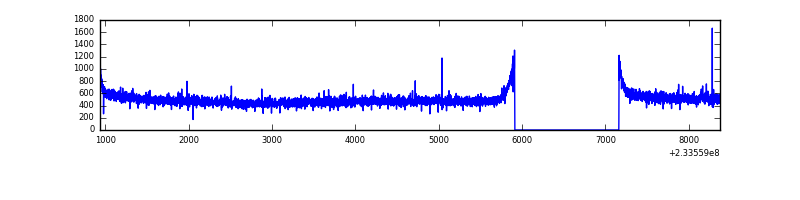 |
| D | 7439 | 6190 | 58 | 58 | 0.78% | 0.94% | 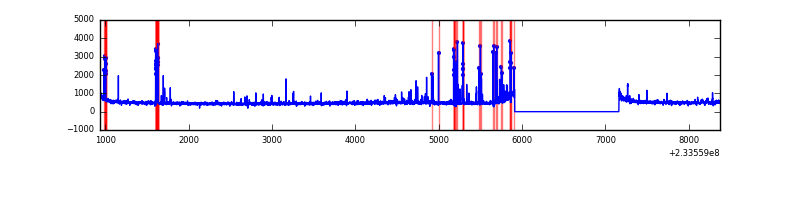 |
Top three noisy pixels from each quadrant. If the there are fewer than three noisy pixels in the level2.evt file, extra rows are filled as -1
| Pixel properties | Quadrant properties | ||||||
|---|---|---|---|---|---|---|---|
| Quadrant | DetID | PixID | Counts | Sigma | Mean | Median | Sigma |
| A | 8 | 5 | 720240 | 4387.58 | 815 | 800 | 164.0 |
| A | 15 | 174 | 20393 | 119.49 | 815 | 800 | 164.0 |
| A | 0 | 226 | 7620 | 41.59 | 815 | 800 | 164.0 |
| B | 10 | 16 | 125139 | 802.3 | 817 | 800 | 155.0 |
| B | 0 | 229 | 21366 | 132.7 | 817 | 800 | 155.0 |
| B | 12 | 111 | 16437 | 100.9 | 817 | 800 | 155.0 |
| C | 9 | 68 | 18609 | 99.03 | 781 | 786 | 180.0 |
| C | 13 | 61 | 5859 | 28.19 | 781 | 786 | 180.0 |
| C | 2 | 1 | 2185 | 7.77 | 781 | 786 | 180.0 |
| D | 1 | 52 | 139186 | 739.95 | 774 | 758 | 187.1 |
| D | 13 | 104 | 69243 | 366.08 | 774 | 758 | 187.1 |
| D | 2 | 14 | 57535 | 303.49 | 774 | 758 | 187.1 |
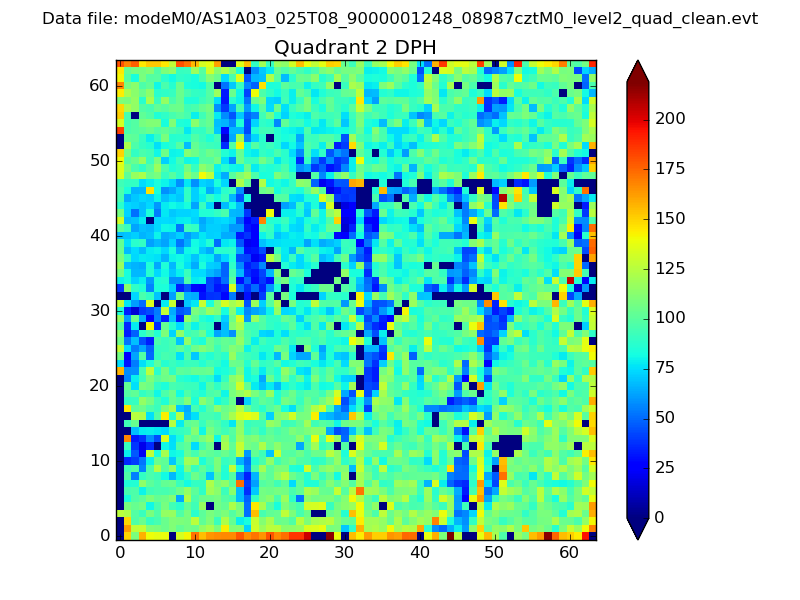
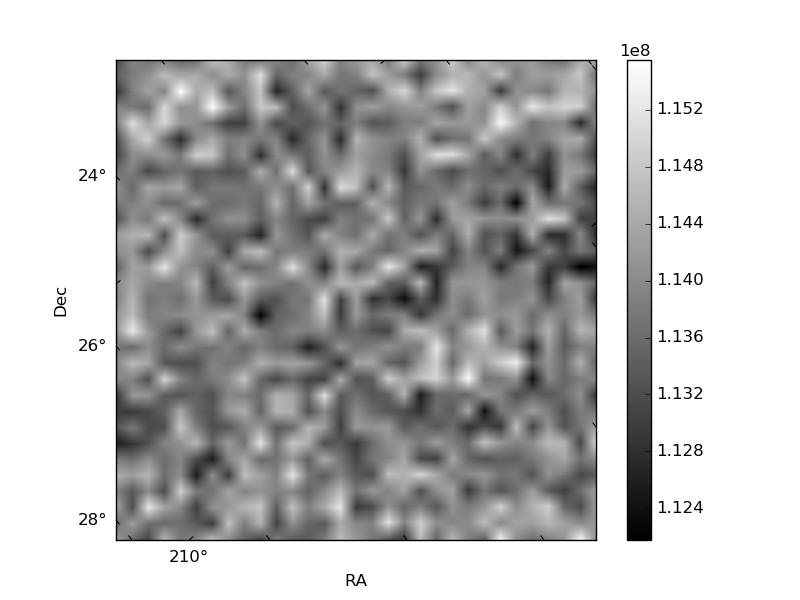
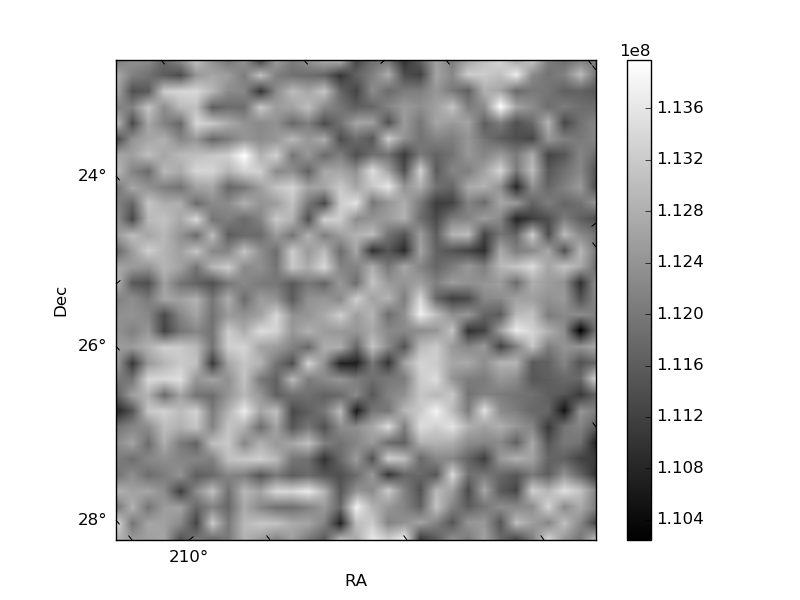
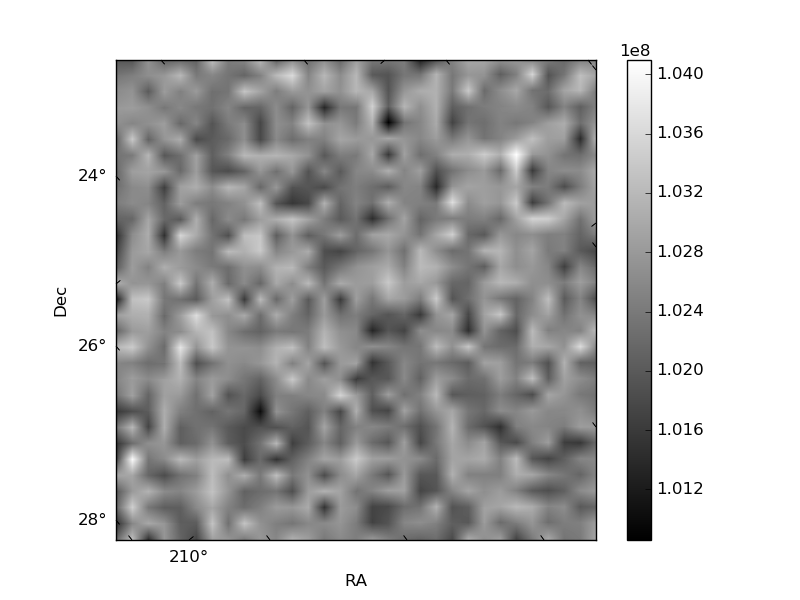
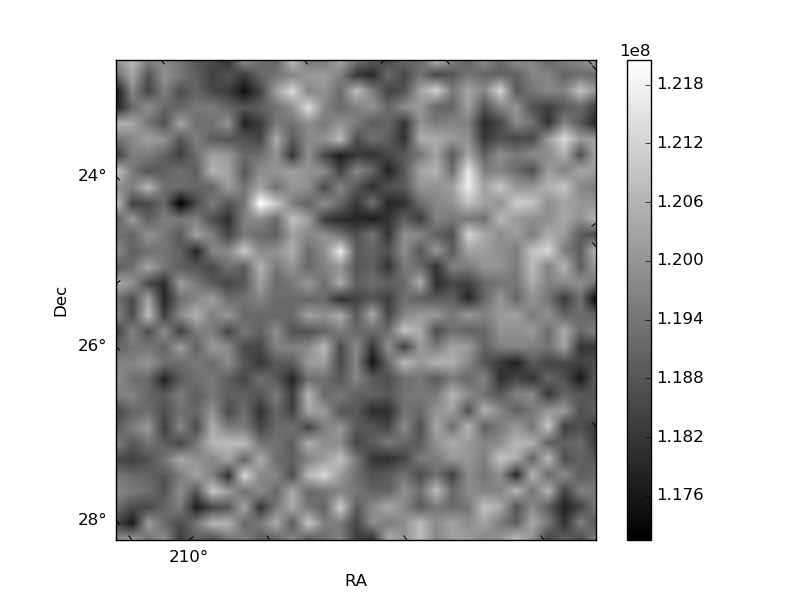
Histogram calculated using DETX and DETY for each event in the final _common_clean file
| Quadrant A | 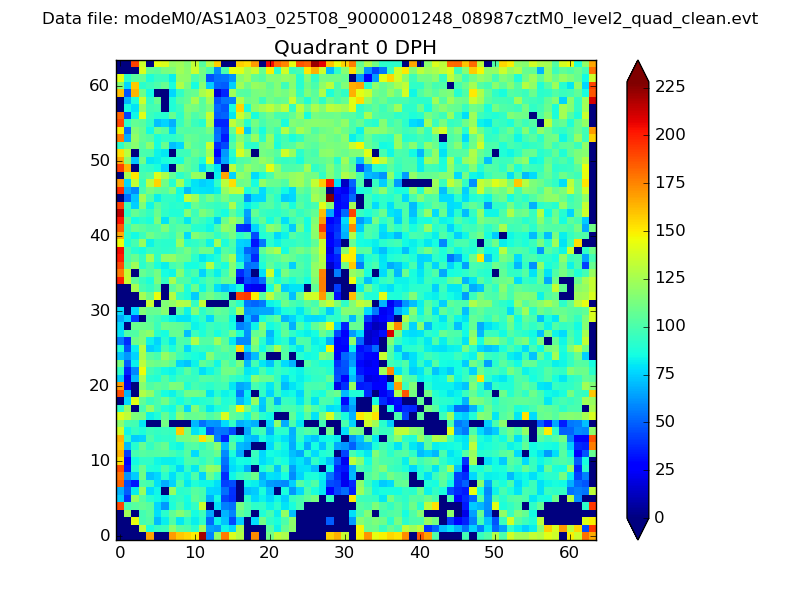 |
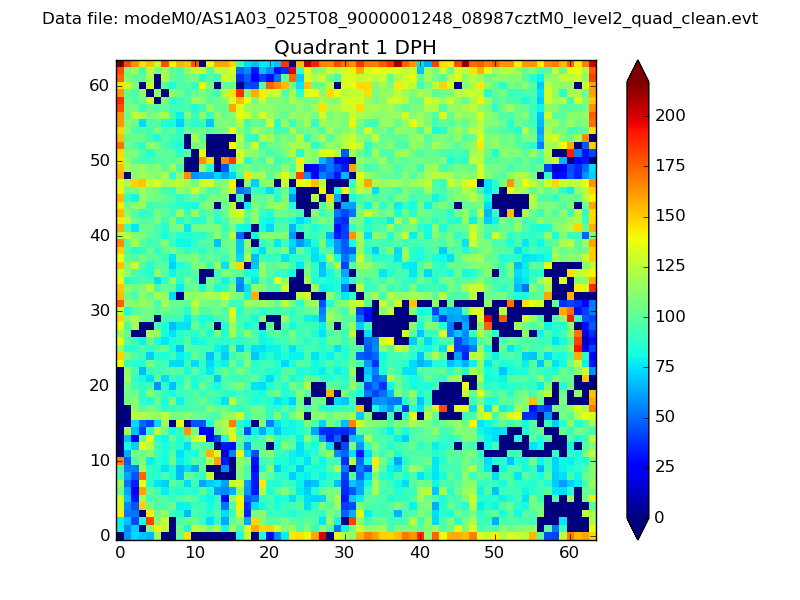 |
Quadrant B |
|---|---|---|---|
| Quadrant D | 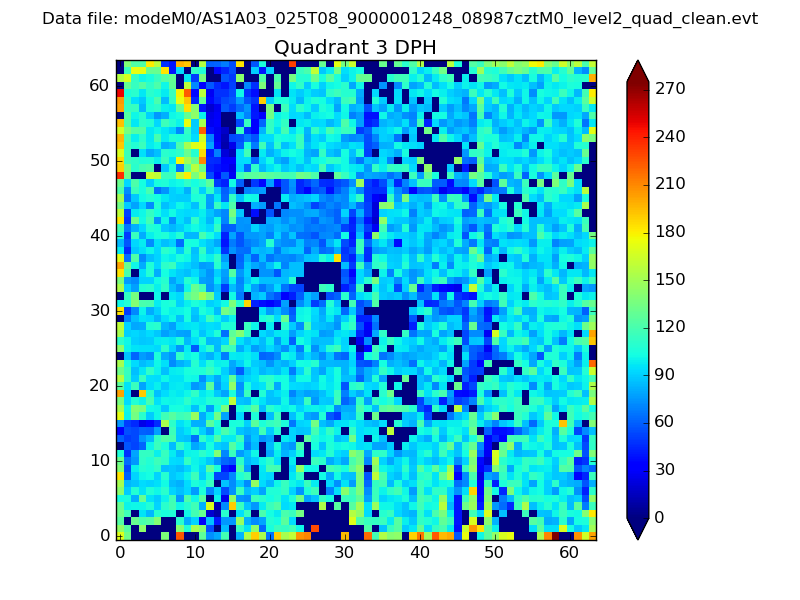 |
 |
Quadrant C |
| Plot type | Count rate plots | Images |
|---|---|---|
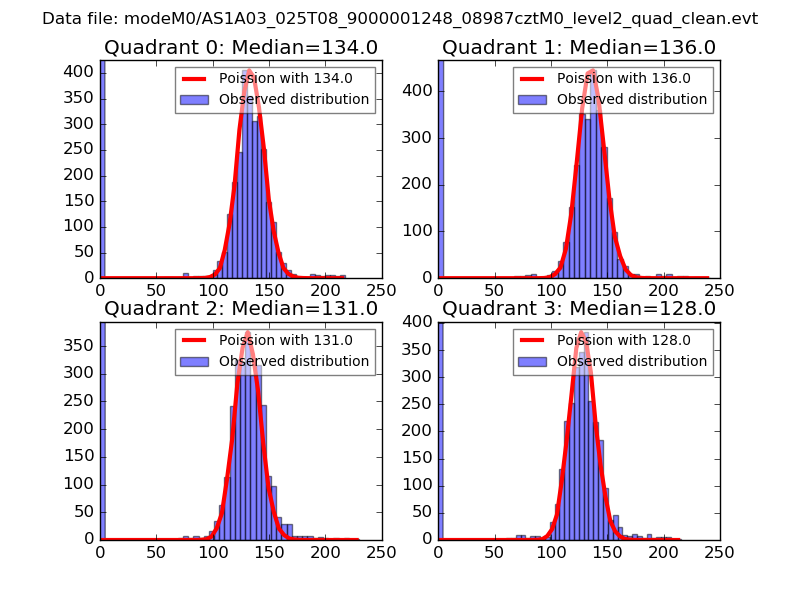
| Comparison with Poisson distribution Blue bars denote a histogram of data divided into 1 sec bins. Red curve is a Poisson curve with rate = median count rate of data. |
 |
 |
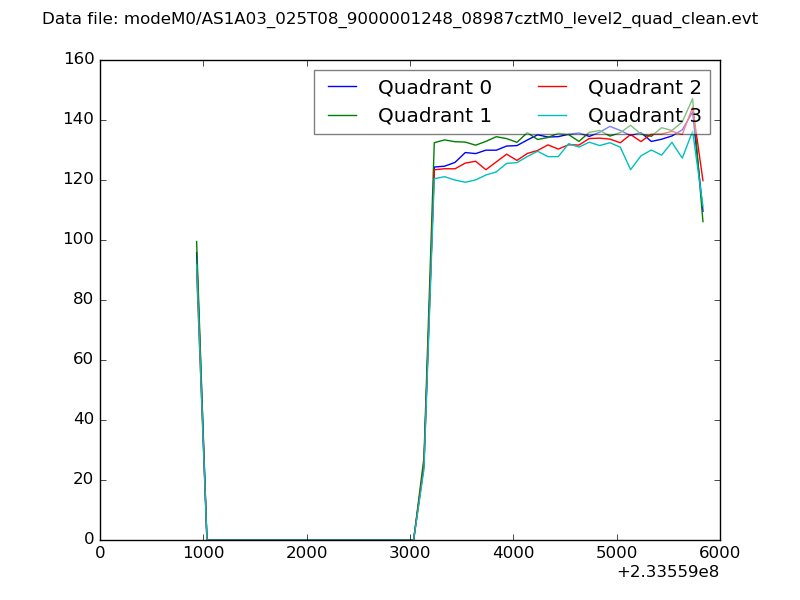
| Quadrant-wise count rates Data is divided into 100 sec bins |
 |
|
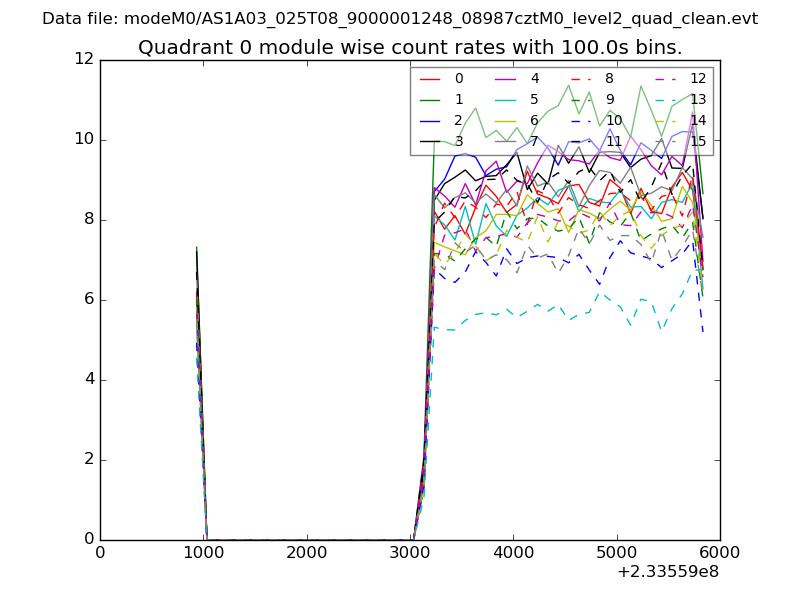
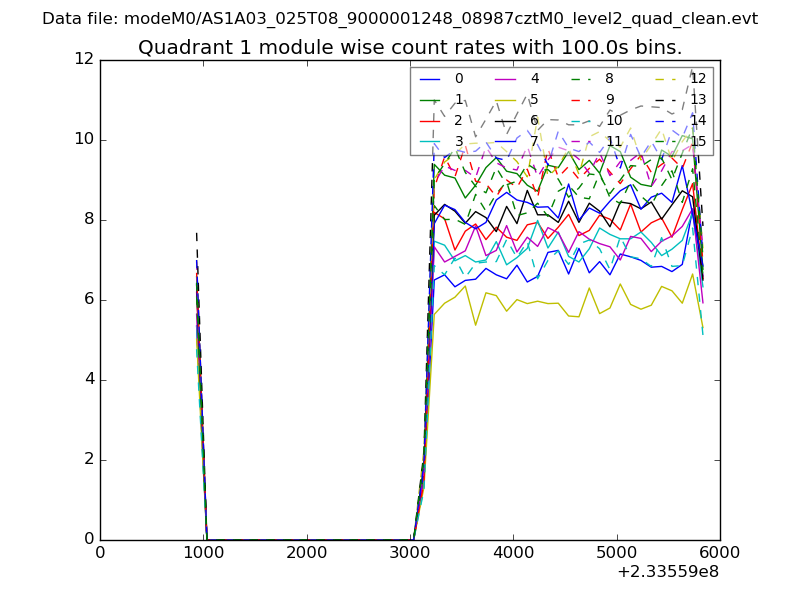
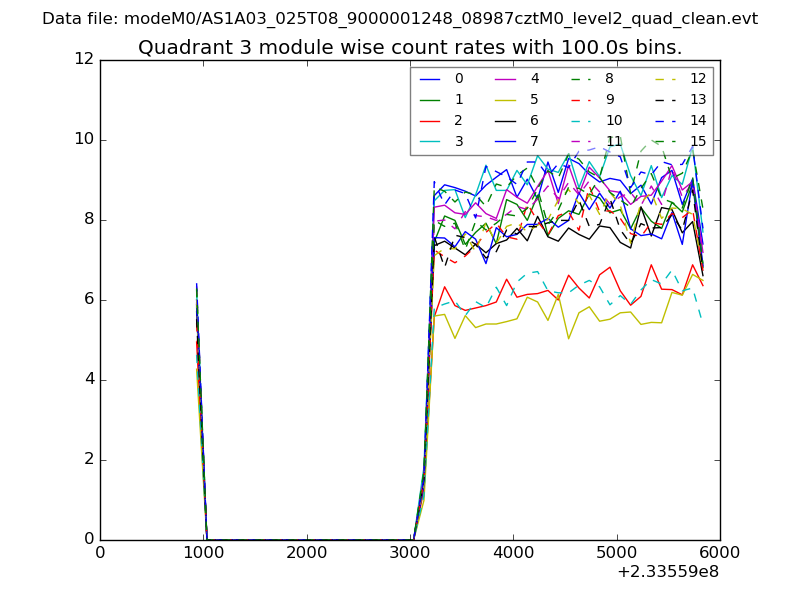
| Module-wise count rates for Quadrant A Data is divided into 100 sec bins |
 |
 |
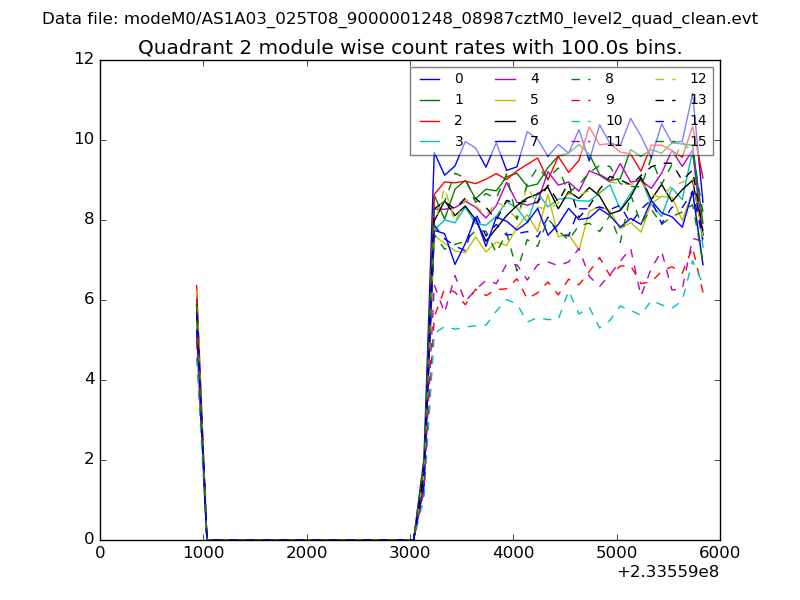
| Module-wise count rates for Quadrant B Data is divided into 100 sec bins |
 |
 |
| Module-wise count rates for Quadrant C Data is divided into 100 sec bins |
 |
 |
| Module-wise count rates for Quadrant D Data is divided into 100 sec bins |
 |
 |
| Parameter | Plot |
|---|---|
| CZT HV Monitor | 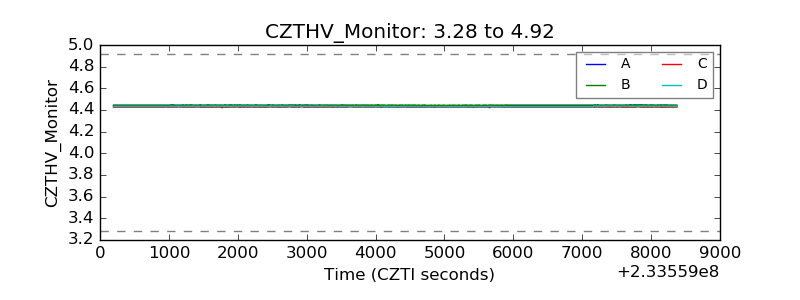 |
| D_VDD | 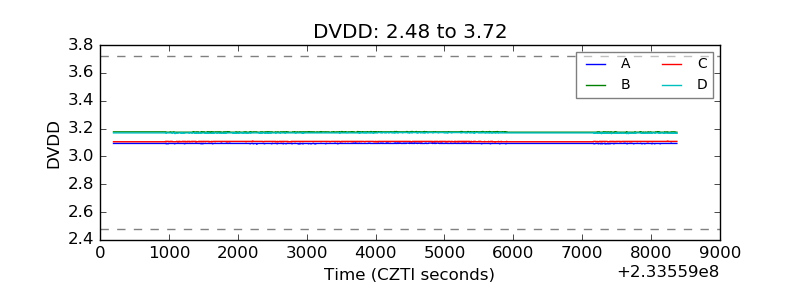 |
| Temperature 1 | 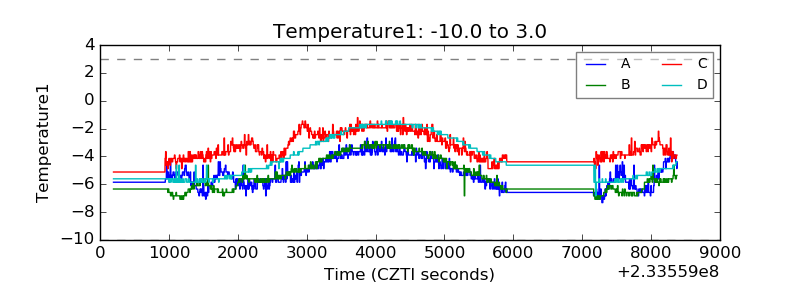 |
| Veto HV Monitor | 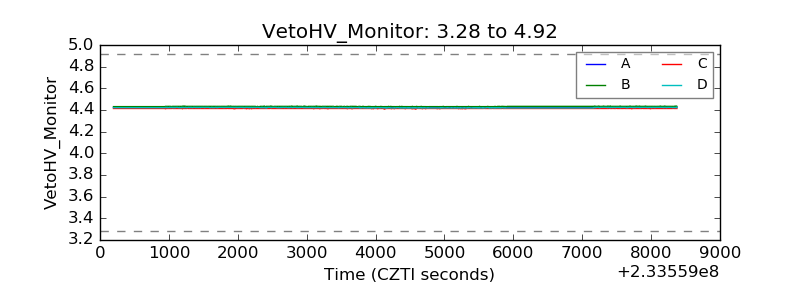 |
| Veto LLD | 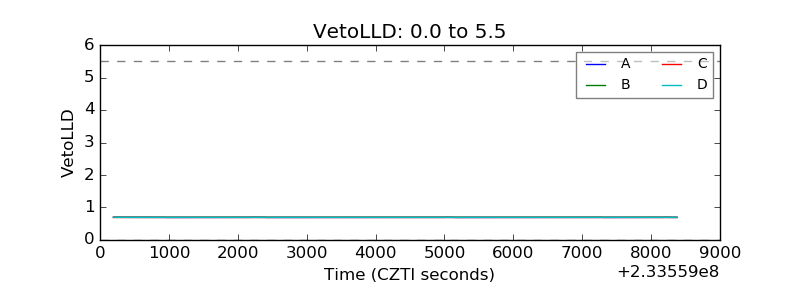 |
| Alpha Counter | 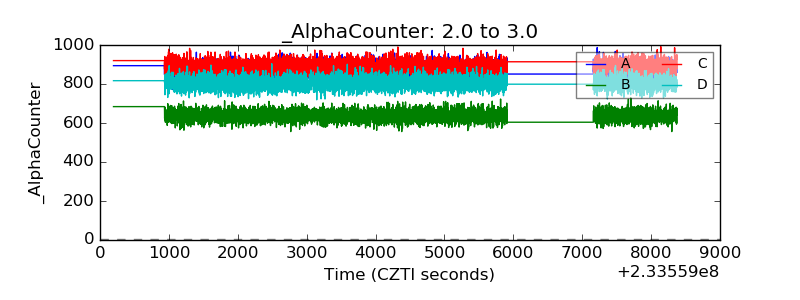 |
| _CPM_Rate | 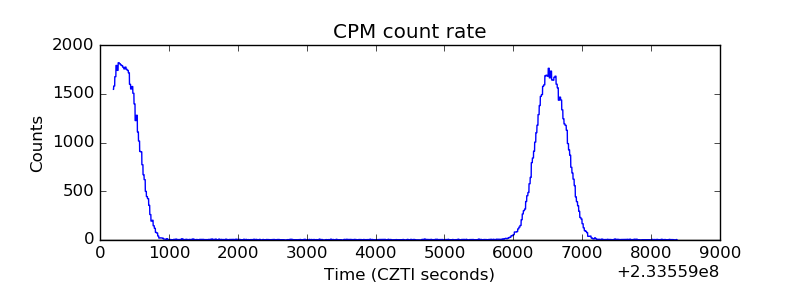 |
| CZT Counter | 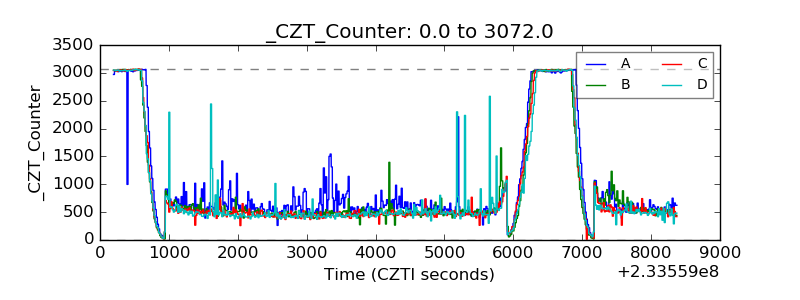 |
| +2.5 Volts monitor | 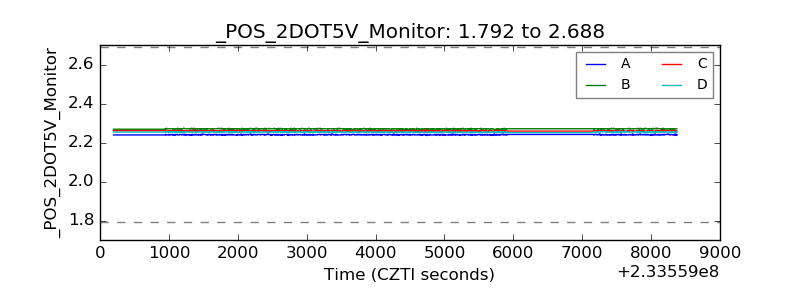 |
| +5 Volts monitor | 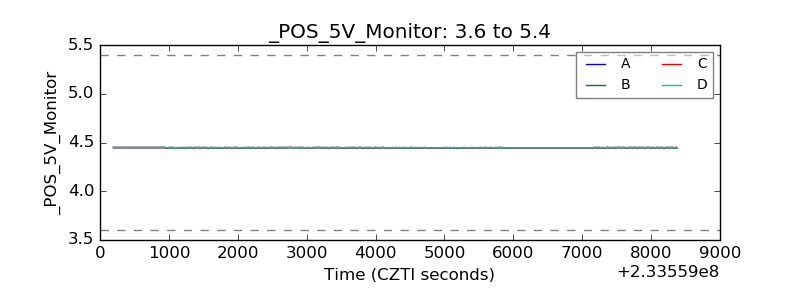 |
| _ROLL_ROT | 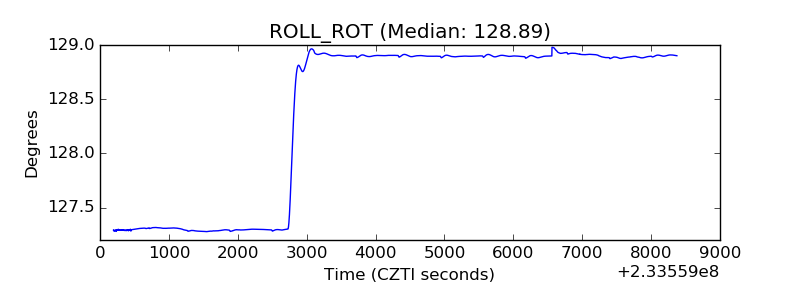 |
| _Roll_DEC | 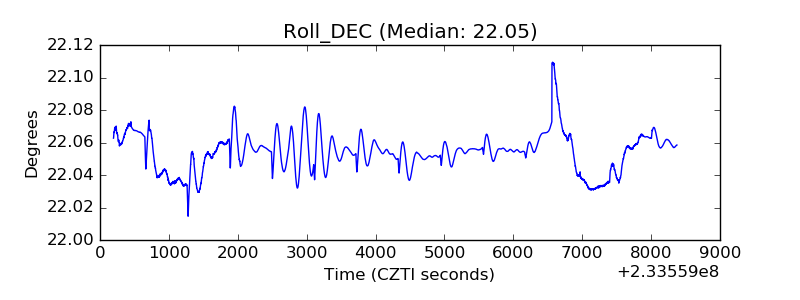 |
| _Roll_RA | 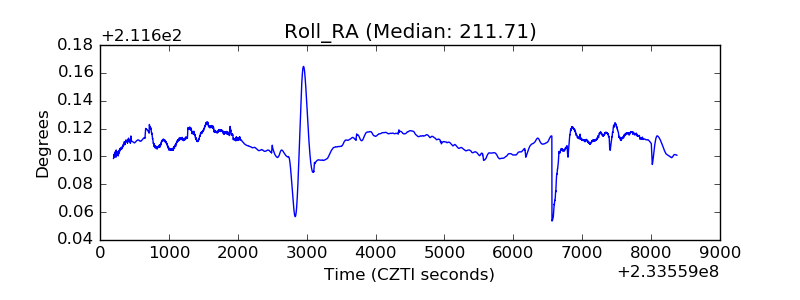 |
| Veto Counter | 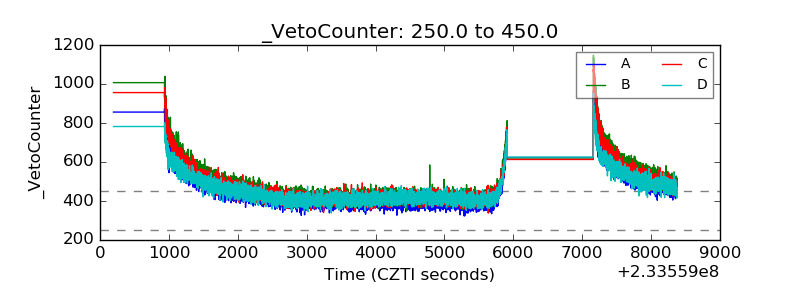 |