| Param | Original file | Final file |
|---|---|---|
| Filename | modeM0/AS1A03_025T08_9000001248_08988cztM0_level2.evt | modeM0/AS1A03_025T08_9000001248_08988cztM0_level2_quad_clean.evt |
| Size (bytes) | 478,800,000 | 68,829,120 |
| Size | 456.6 MB | 65.6 MB |
| Events in quadrant A | 4,021,599 | 414,038 |
| Events in quadrant B | 3,664,945 | 427,216 |
| Events in quadrant C | 3,137,939 | 412,271 |
| Events in quadrant D | 3,258,919 | 401,353 |
| Mode M9 | |||
|---|---|---|---|
| Quadrant | BADHDUFLAG | Total packets | Discarded packets |
| A | 0 | 16 | 0 |
| B | 0 | 16 | 0 |
| C | 0 | 16 | 0 |
| D | 0 | 17 | 0 |
| Mode M0 | |||
|---|---|---|---|
| Quadrant | BADHDUFLAG | Total packets | Discarded packets |
| A | 0 | 15771 | 28 |
| B | 0 | 14660 | 14 |
| C | 0 | 13065 | 23 |
| D | 0 | 13456 | 9 |
| Mode SS | |||
|---|---|---|---|
| Quadrant | BADHDUFLAG | Total packets | Discarded packets |
| A | 0 | 124 | 0 |
| B | 0 | 124 | 0 |
| C | 0 | 124 | 0 |
| D | 0 | 124 | 0 |
| Quadrant | Total seconds | Saturated seconds | Saturation percentage |
|---|---|---|---|
| A | 6147 | 229 | 3.725395% |
| B | 6150 | 219 | 3.560976% |
| C | 6145 | 80 | 1.301871% |
| D | 6152 | 80 | 1.300390% |
Noise dominated data is calculated using 1-second bins in cleaned event files. If a bin has >2000 counts, and if more than 50% of those come from <1% of pixels, then it is considered to be noise-dominated and hence unusable.
| Quadrant | # 1 sec bins | Bins with >0 counts | Bins with >2000 counts | High rate bins dominated by noise | Noise dominated (total time) | Noise dominated (detector-on time) | Marked lightcurve |
|---|---|---|---|---|---|---|---|
| A | 7430 | 6155 | 86 | 86 | 1.16% | 1.40% | 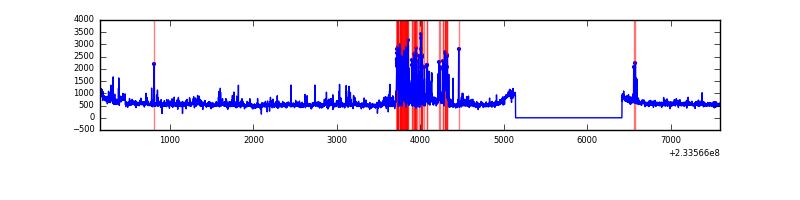 |
| B | 7430 | 6155 | 67 | 67 | 0.90% | 1.09% | 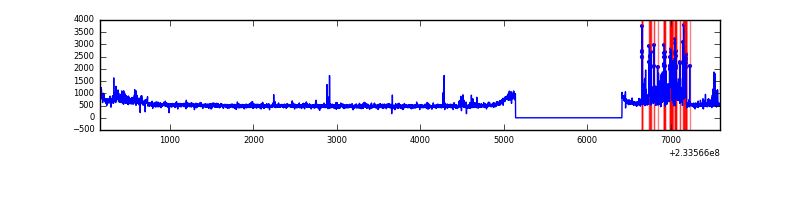 |
| C | 7430 | 6156 | 7 | 7 | 0.09% | 0.11% | 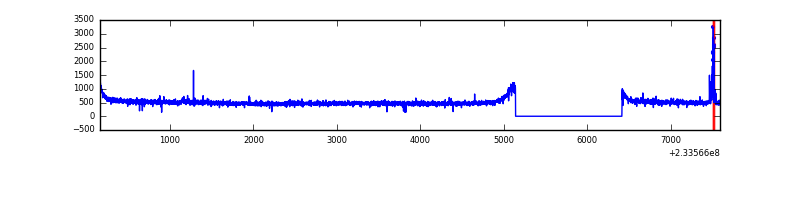 |
| D | 7430 | 6155 | 7 | 7 | 0.09% | 0.11% | 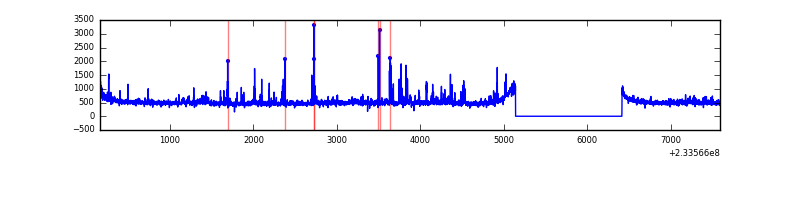 |
Top three noisy pixels from each quadrant. If the there are fewer than three noisy pixels in the level2.evt file, extra rows are filled as -1
| Pixel properties | Quadrant properties | ||||||
|---|---|---|---|---|---|---|---|
| Quadrant | DetID | PixID | Counts | Sigma | Mean | Median | Sigma |
| A | 8 | 5 | 833162 | 5067.37 | 822 | 809 | 164.3 |
| A | 15 | 174 | 21234 | 124.35 | 822 | 809 | 164.3 |
| A | 0 | 226 | 7685 | 41.86 | 822 | 809 | 164.3 |
| B | 10 | 16 | 445843 | 2882.96 | 820 | 805 | 154.4 |
| B | 12 | 32 | 24943 | 156.37 | 820 | 805 | 154.4 |
| B | 12 | 111 | 16730 | 103.16 | 820 | 805 | 154.4 |
| C | 4 | 254 | 46626 | 253.01 | 787 | 793 | 181.2 |
| C | 9 | 68 | 23039 | 122.8 | 787 | 793 | 181.2 |
| C | 13 | 61 | 6004 | 28.77 | 787 | 793 | 181.2 |
| D | 1 | 52 | 132202 | 689.7 | 788 | 772 | 190.6 |
| D | 7 | 71 | 38123 | 196.0 | 788 | 772 | 190.6 |
| D | 2 | 234 | 27204 | 138.71 | 788 | 772 | 190.6 |
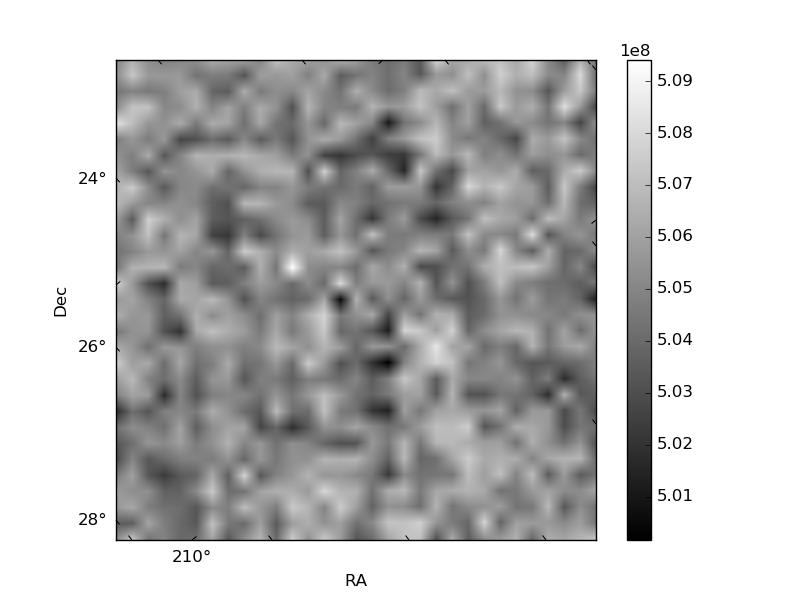
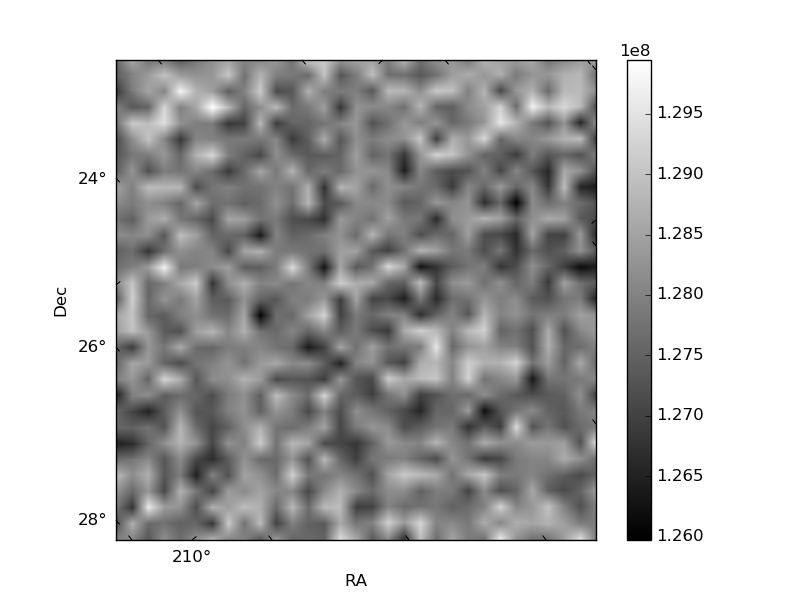
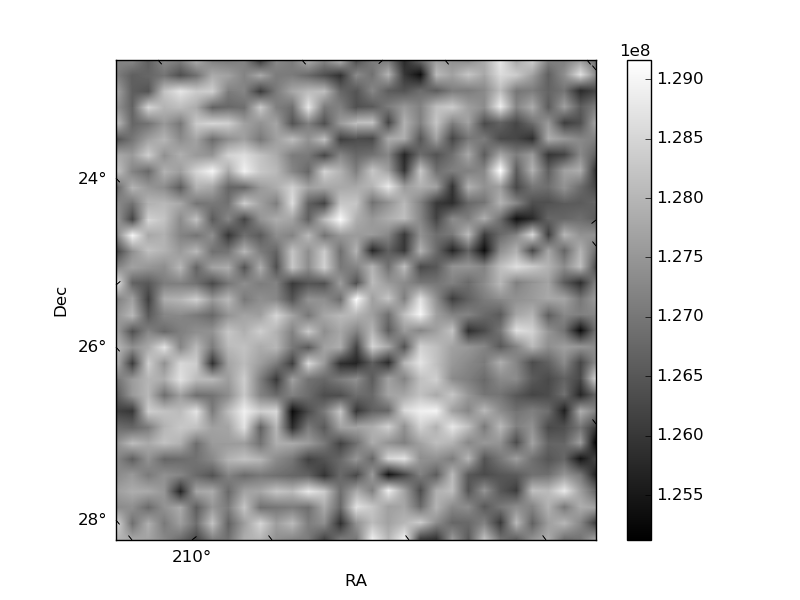
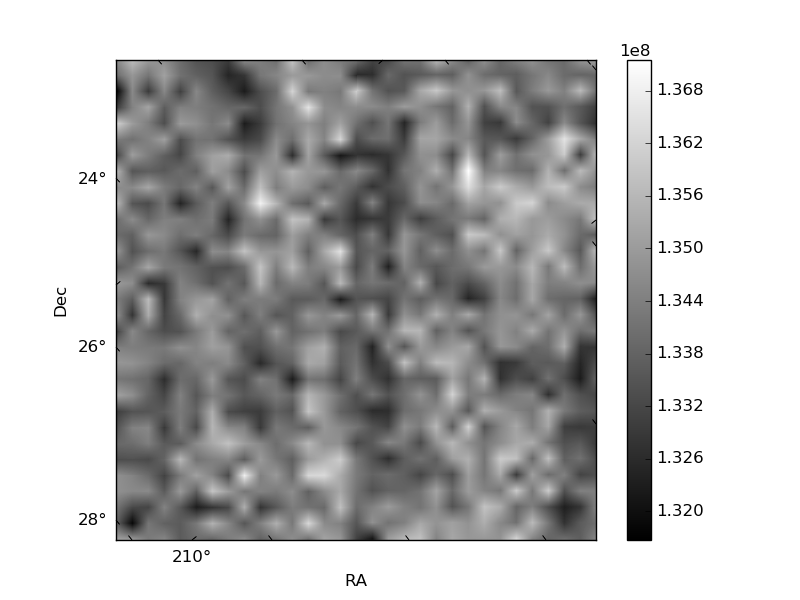
Histogram calculated using DETX and DETY for each event in the final _common_clean file
| Quadrant A | 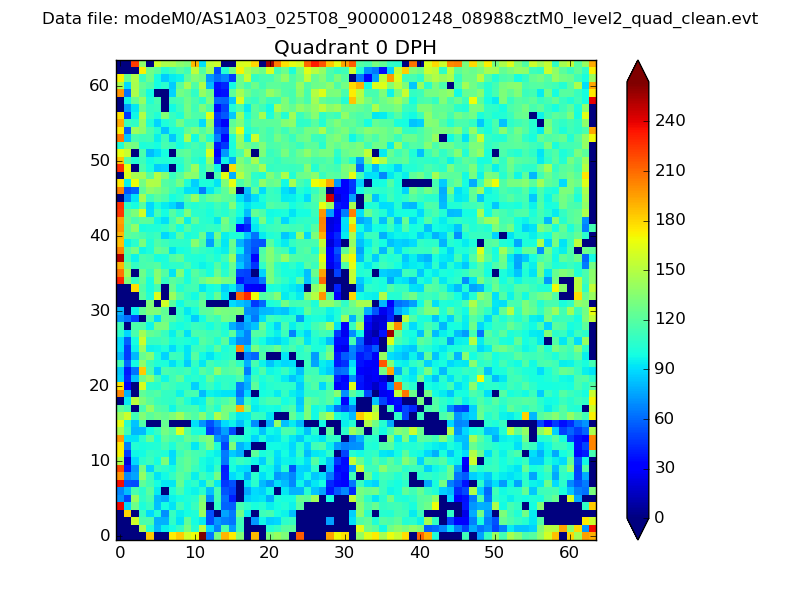 |
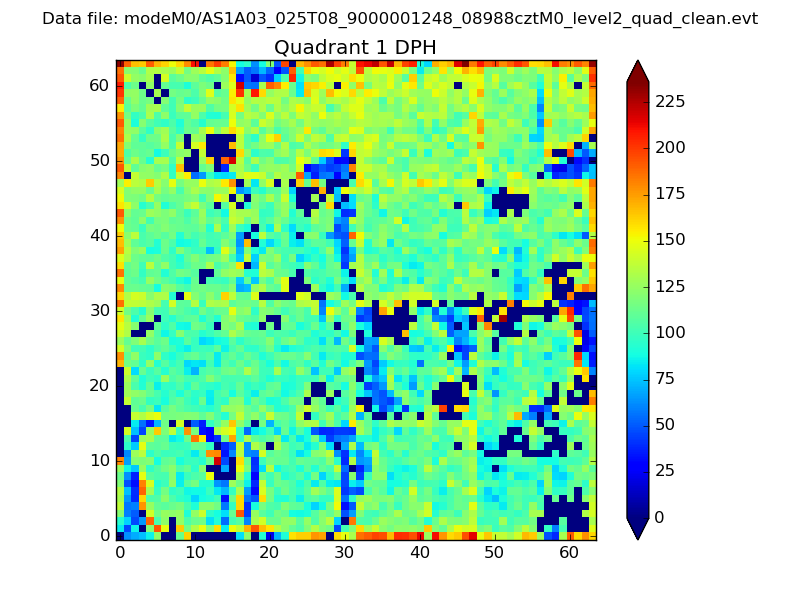 |
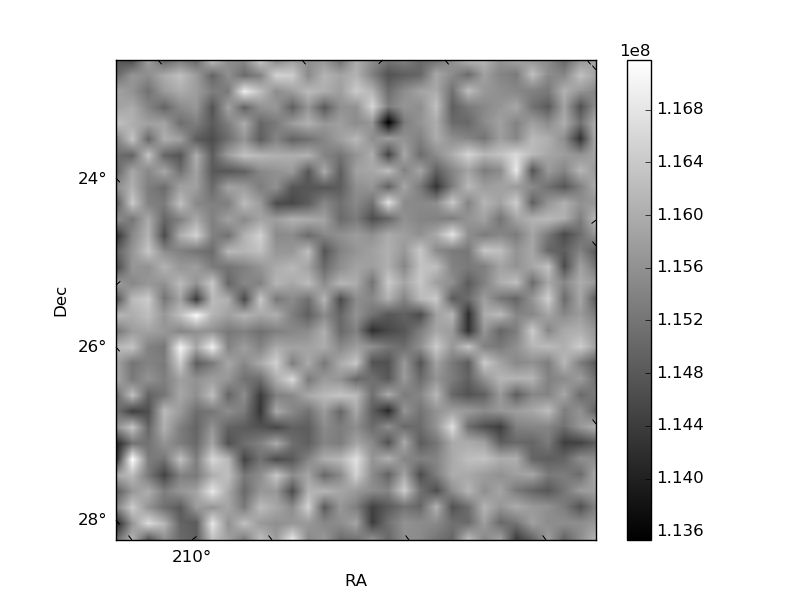
Quadrant B |
|---|---|---|---|
| Quadrant D | 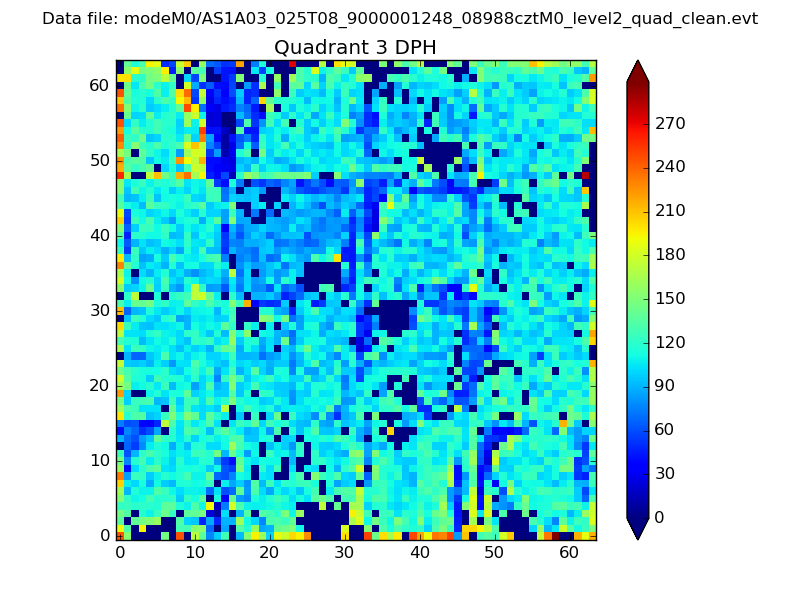 |
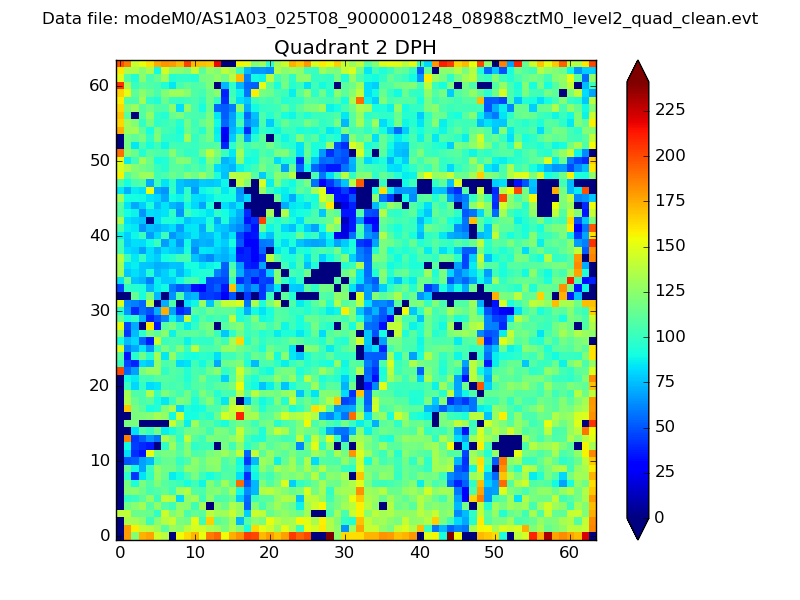 |
Quadrant C |
| Plot type | Count rate plots | Images |
|---|---|---|
| Comparison with Poisson distribution Blue bars denote a histogram of data divided into 1 sec bins. Red curve is a Poisson curve with rate = median count rate of data. |
 |
 |
| Quadrant-wise count rates Data is divided into 100 sec bins |
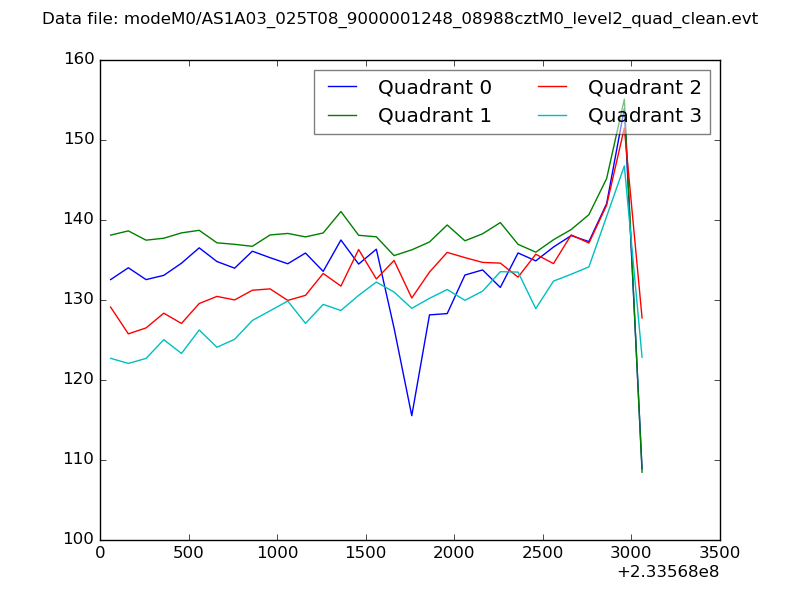 |
|
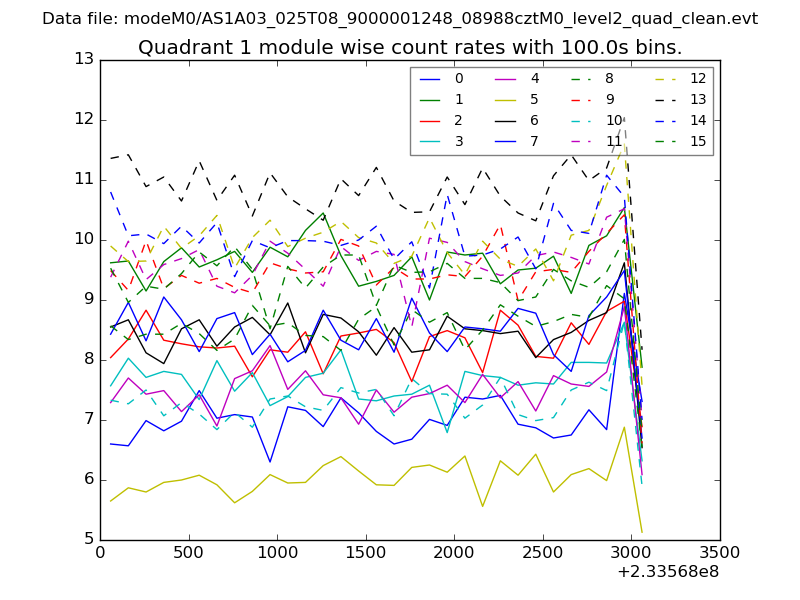
| Module-wise count rates for Quadrant A Data is divided into 100 sec bins |
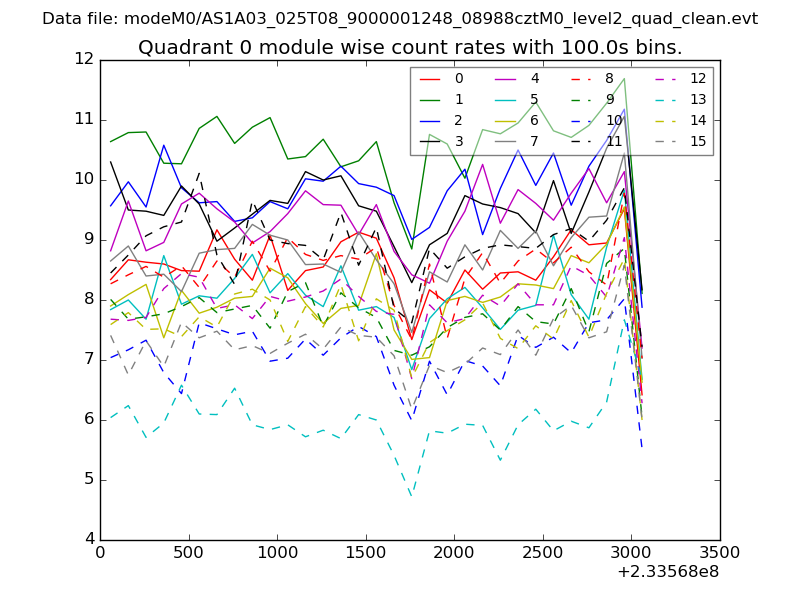 |
 |
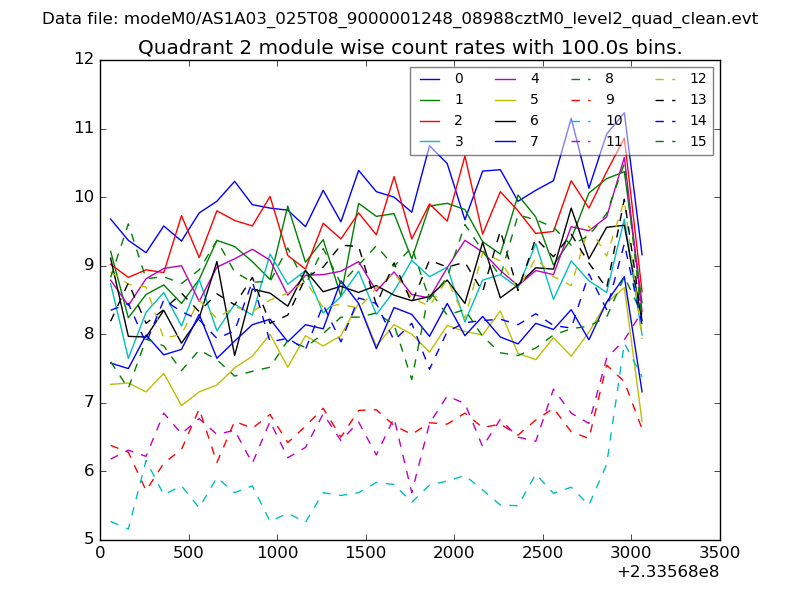
| Module-wise count rates for Quadrant B Data is divided into 100 sec bins |
 |
 |
| Module-wise count rates for Quadrant C Data is divided into 100 sec bins |
 |
 |
| Module-wise count rates for Quadrant D Data is divided into 100 sec bins |
 |
 |
| Parameter | Plot |
|---|---|
| CZT HV Monitor | 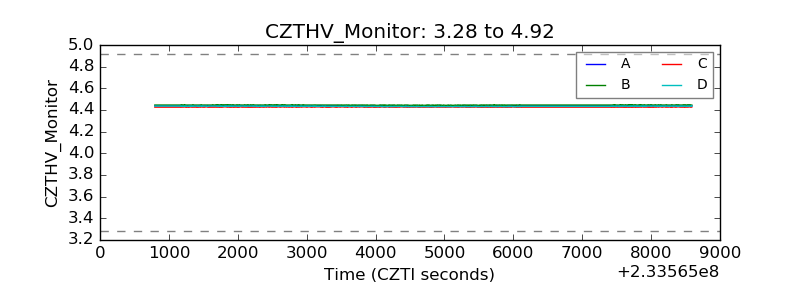 |
| D_VDD | 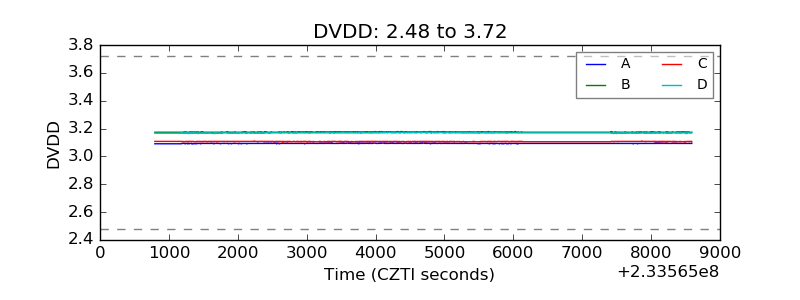 |
| Temperature 1 | 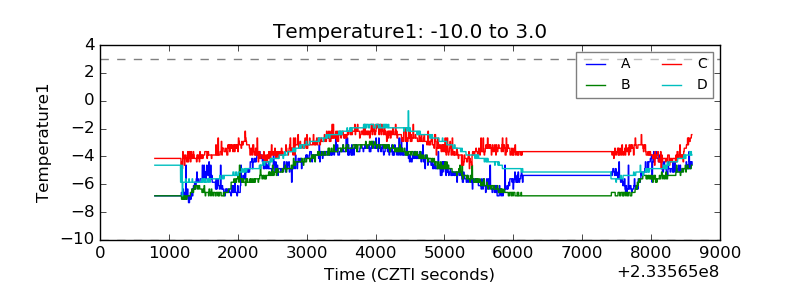 |
| Veto HV Monitor | 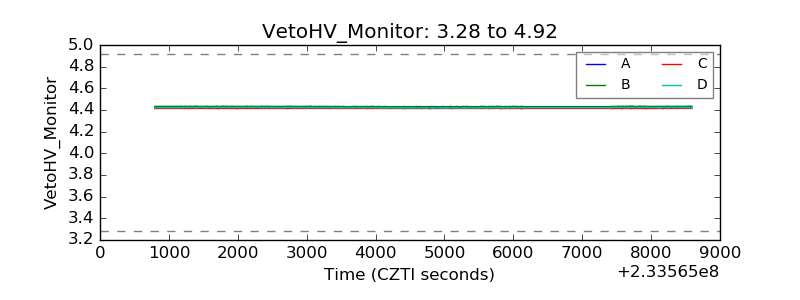 |
| Veto LLD | 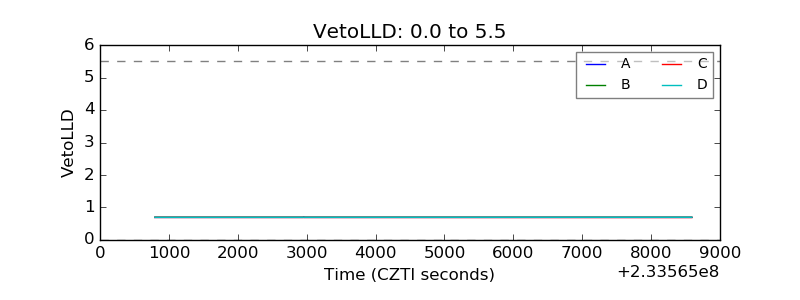 |
| Alpha Counter | 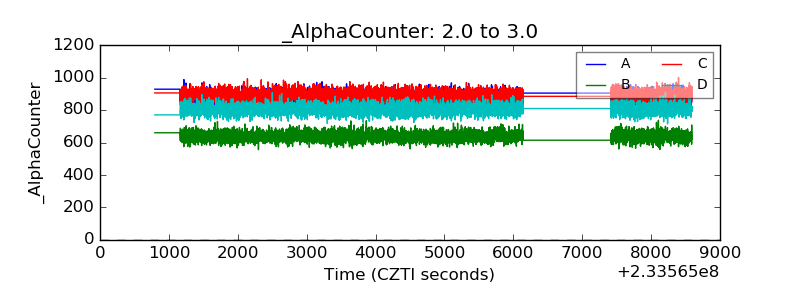 |
| _CPM_Rate | 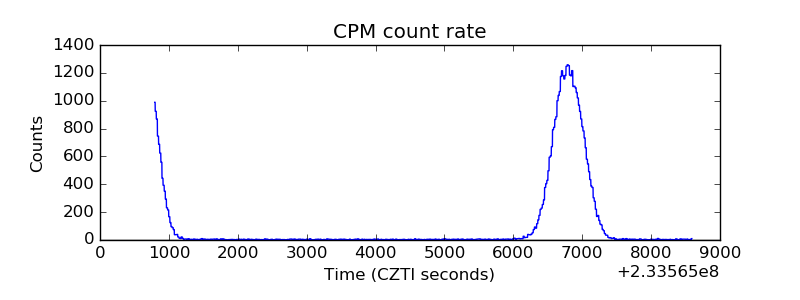 |
| CZT Counter | 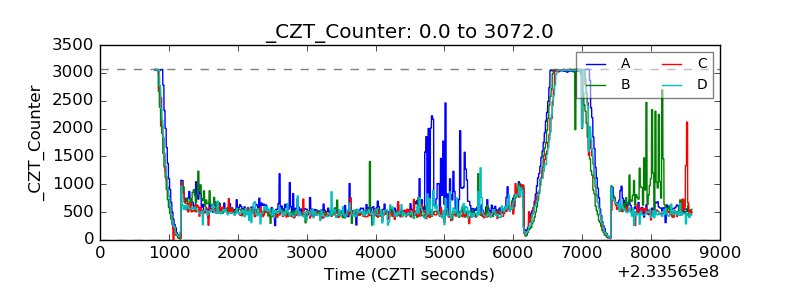 |
| +2.5 Volts monitor | 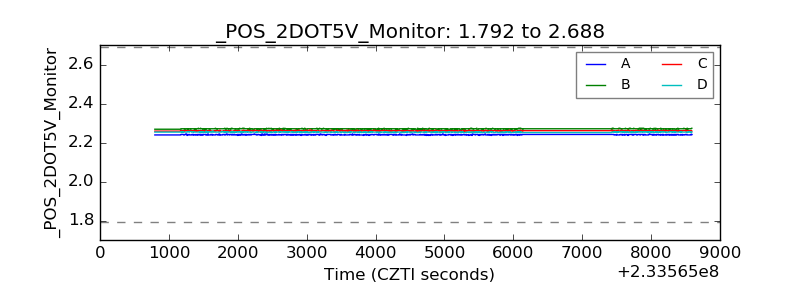 |
| +5 Volts monitor |  |
| _ROLL_ROT |  |
| _Roll_DEC | 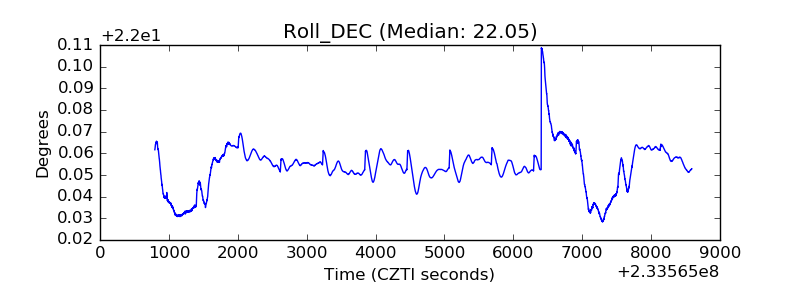 |
| _Roll_RA | 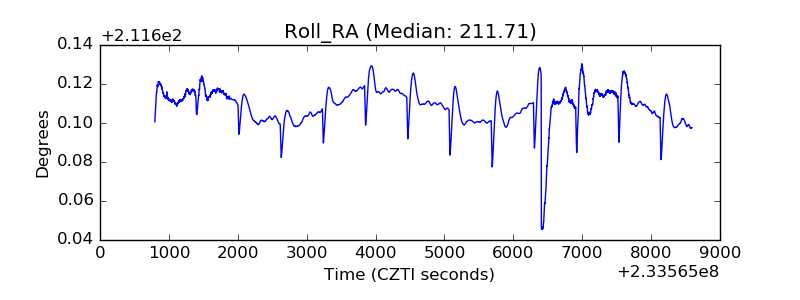 |
| Veto Counter | 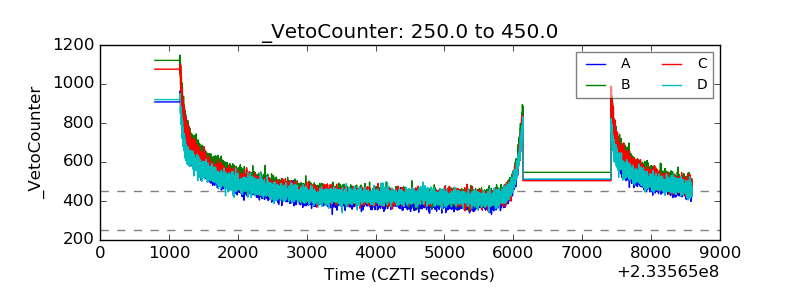 |