| Param | Original file | Final file |
|---|---|---|
| Filename | modeM0/AS1A03_025T08_9000001248_08989cztM0_level2.evt | modeM0/AS1A03_025T08_9000001248_08989cztM0_level2_quad_clean.evt |
| Size (bytes) | 606,268,800 | 85,089,600 |
| Size | 578.2 MB | 81.1 MB |
| Events in quadrant A | 3,768,368 | 557,785 |
| Events in quadrant B | 4,961,204 | 519,459 |
| Events in quadrant C | 5,686,907 | 497,431 |
| Events in quadrant D | 3,489,005 | 533,216 |
| Mode M9 | |||
|---|---|---|---|
| Quadrant | BADHDUFLAG | Total packets | Discarded packets |
| A | 0 | 25 | 0 |
| B | 0 | 25 | 0 |
| C | 0 | 25 | 0 |
| D | 0 | 25 | 0 |
| Mode M0 | |||
|---|---|---|---|
| Quadrant | BADHDUFLAG | Total packets | Discarded packets |
| A | 0 | 15023 | 3 |
| B | 0 | 18879 | 2 |
| C | 0 | 21239 | 2 |
| D | 0 | 14571 | 2 |
| Mode SS | |||
|---|---|---|---|
| Quadrant | BADHDUFLAG | Total packets | Discarded packets |
| A | 0 | 138 | 0 |
| B | 0 | 138 | 0 |
| C | 0 | 138 | 0 |
| D | 0 | 138 | 0 |
| Quadrant | Total seconds | Saturated seconds | Saturation percentage |
|---|---|---|---|
| A | 6718 | 158 | 2.351890% |
| B | 6718 | 711 | 10.583507% |
| C | 6718 | 998 | 14.855612% |
| D | 6718 | 148 | 2.203037% |
Noise dominated data is calculated using 1-second bins in cleaned event files. If a bin has >2000 counts, and if more than 50% of those come from <1% of pixels, then it is considered to be noise-dominated and hence unusable.
| Quadrant | # 1 sec bins | Bins with >0 counts | Bins with >2000 counts | High rate bins dominated by noise | Noise dominated (total time) | Noise dominated (detector-on time) | Marked lightcurve |
|---|---|---|---|---|---|---|---|
| A | 9223 | 6718 | 4 | 4 | 0.04% | 0.06% | 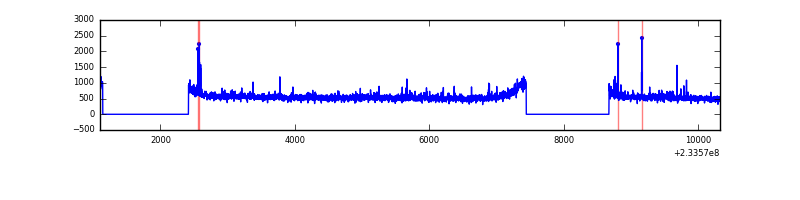 |
| B | 9223 | 6718 | 330 | 330 | 3.58% | 4.91% |  |
| C | 9222 | 6718 | 651 | 651 | 7.06% | 9.69% |  |
| D | 9223 | 6718 | 17 | 17 | 0.18% | 0.25% | 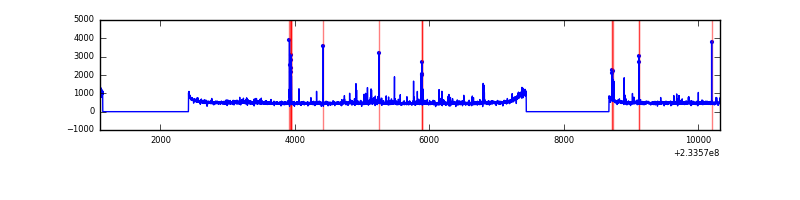 |
Top three noisy pixels from each quadrant. If the there are fewer than three noisy pixels in the level2.evt file, extra rows are filled as -1
| Pixel properties | Quadrant properties | ||||||
|---|---|---|---|---|---|---|---|
| Quadrant | DetID | PixID | Counts | Sigma | Mean | Median | Sigma |
| A | 8 | 5 | 348870 | 1937.08 | 887 | 870 | 179.7 |
| A | 0 | 226 | 8262 | 41.15 | 887 | 870 | 179.7 |
| A | 12 | 194 | 7401 | 36.35 | 887 | 870 | 179.7 |
| B | 10 | 16 | 1180575 | 7364.63 | 841 | 824 | 160.2 |
| B | 12 | 32 | 462902 | 2884.53 | 841 | 824 | 160.2 |
| B | 4 | 173 | 24479 | 147.67 | 841 | 824 | 160.2 |
| C | 4 | 254 | 2555832 | 13742.59 | 799 | 805 | 185.9 |
| C | 4 | 238 | 11072 | 55.22 | 799 | 805 | 185.9 |
| C | 13 | 61 | 6169 | 28.85 | 799 | 805 | 185.9 |
| D | 1 | 52 | 130259 | 615.54 | 851 | 829 | 210.3 |
| D | 7 | 71 | 40214 | 187.31 | 851 | 829 | 210.3 |
| D | 9 | 101 | 27082 | 124.85 | 851 | 829 | 210.3 |
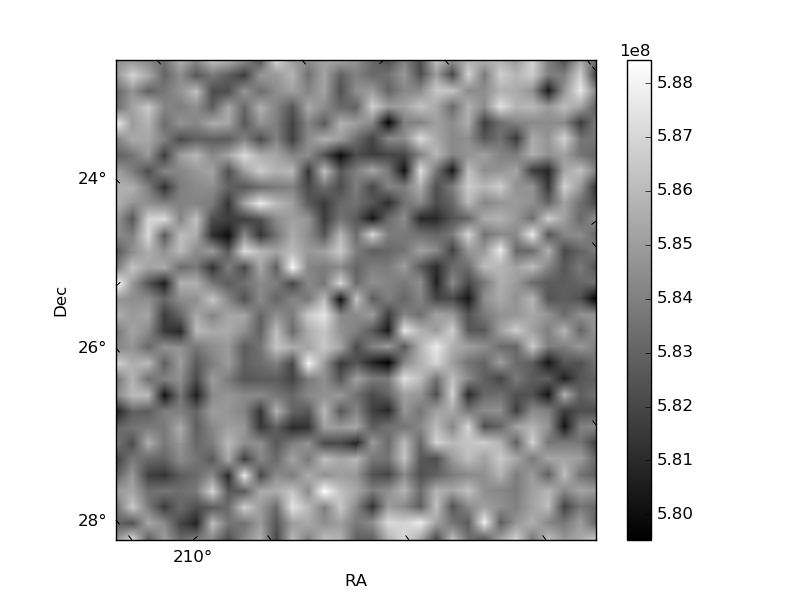
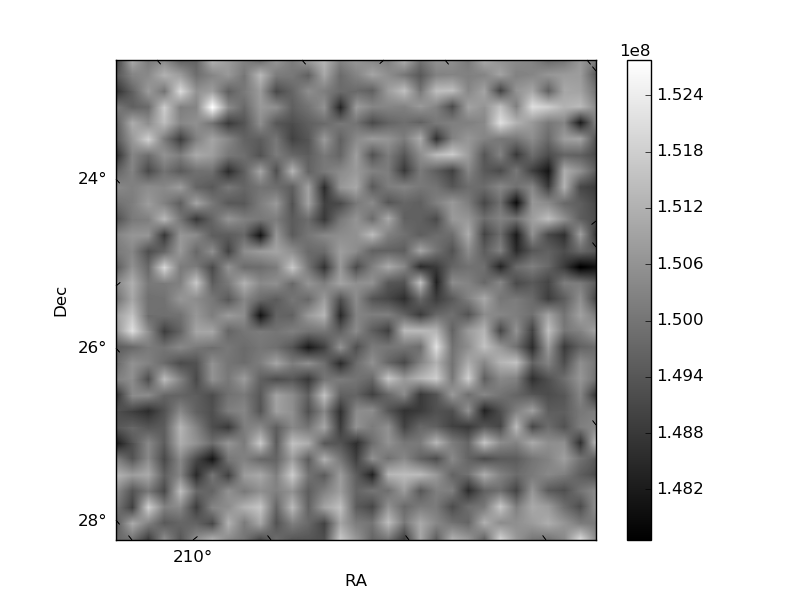
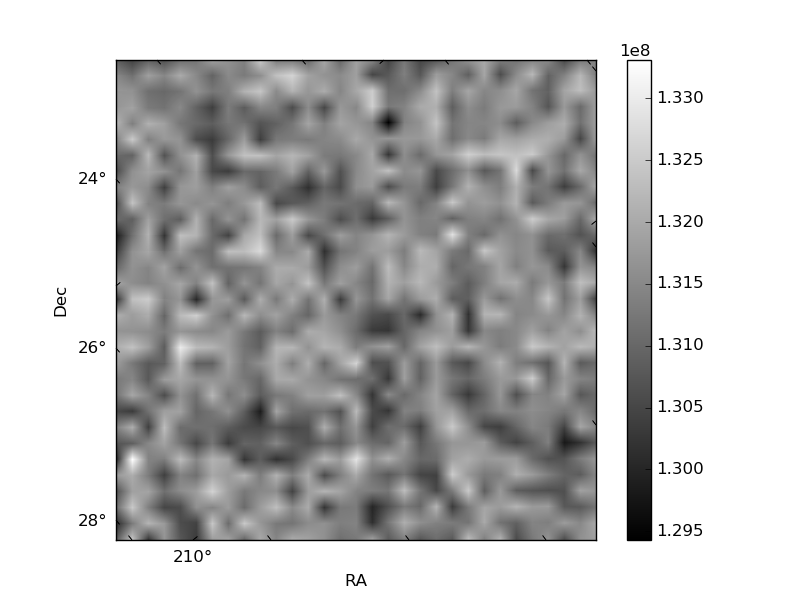
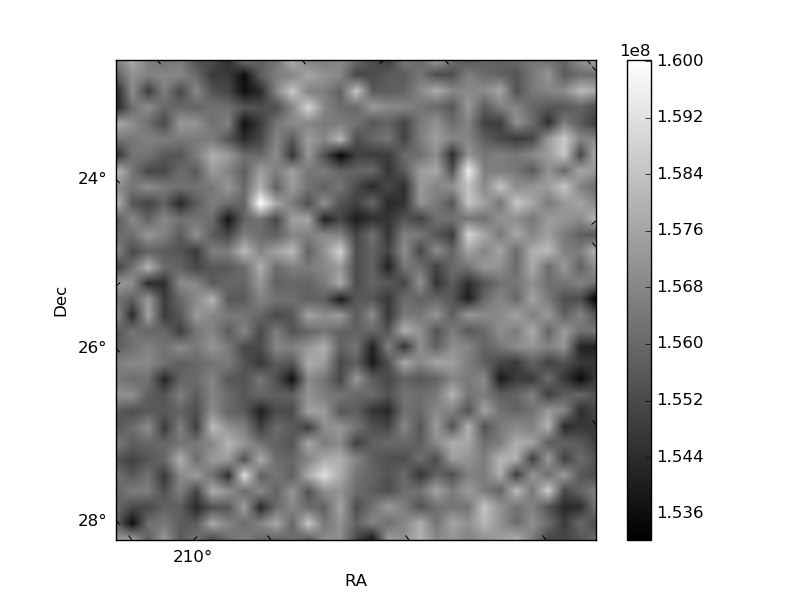
Histogram calculated using DETX and DETY for each event in the final _common_clean file
| Quadrant A | 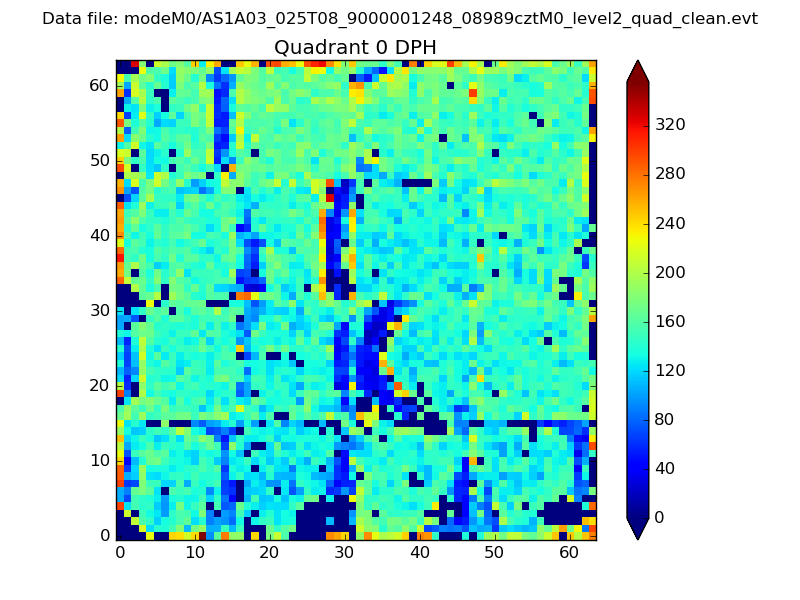 |
 |
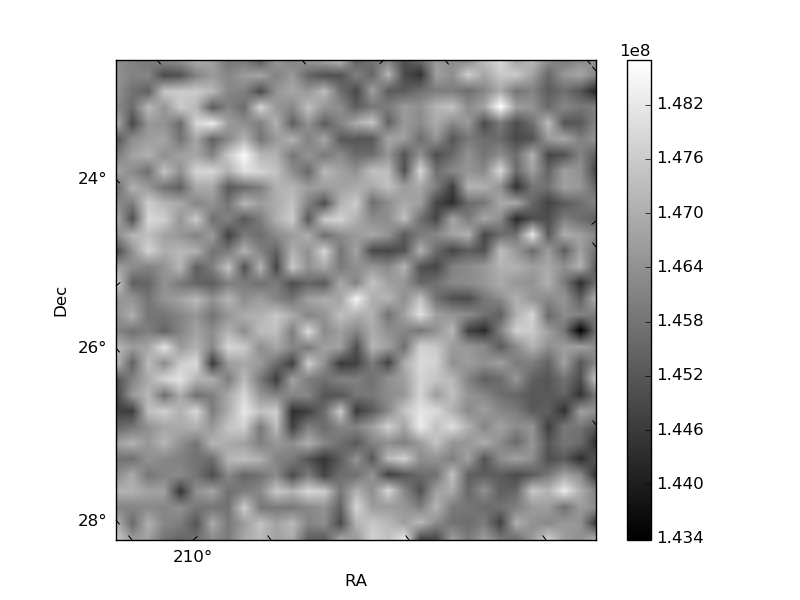
Quadrant B |
|---|---|---|---|
| Quadrant D | 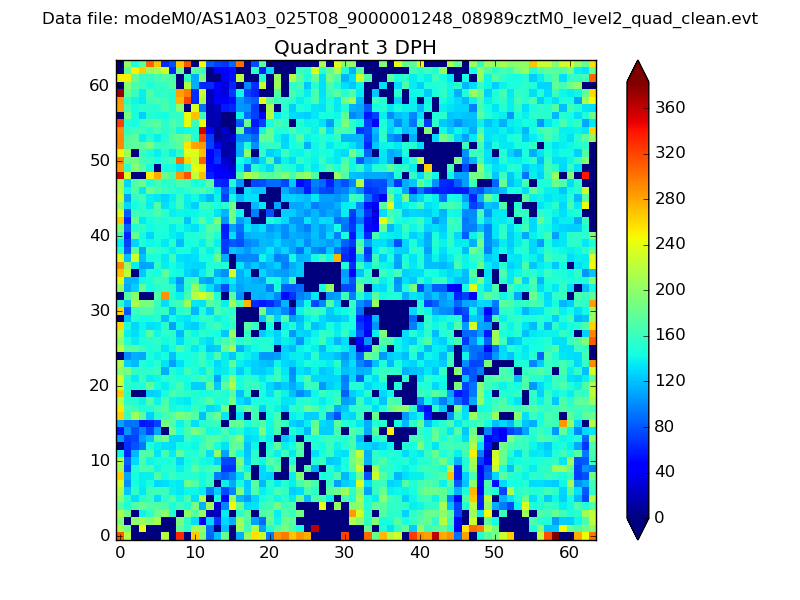 |
 |
Quadrant C |
| Plot type | Count rate plots | Images |
|---|---|---|
| Comparison with Poisson distribution Blue bars denote a histogram of data divided into 1 sec bins. Red curve is a Poisson curve with rate = median count rate of data. |
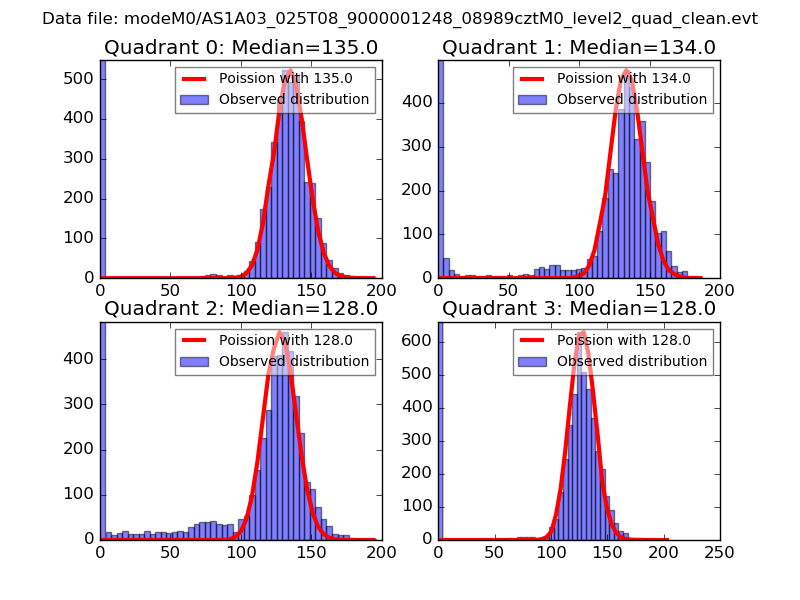 |
 |
| Quadrant-wise count rates Data is divided into 100 sec bins |
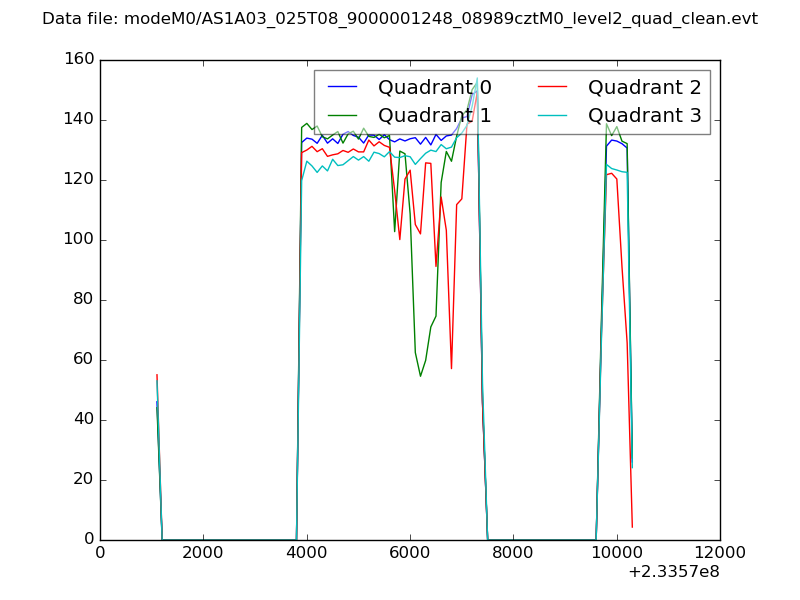 |
|
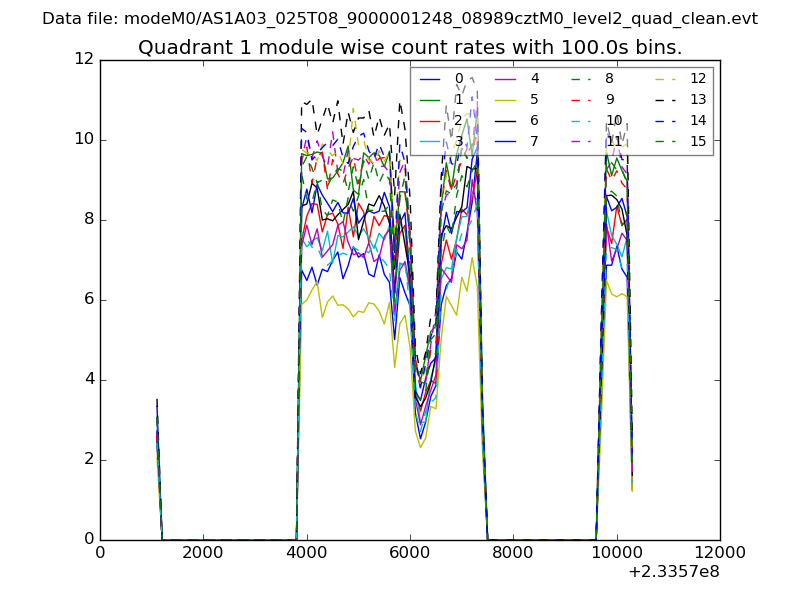
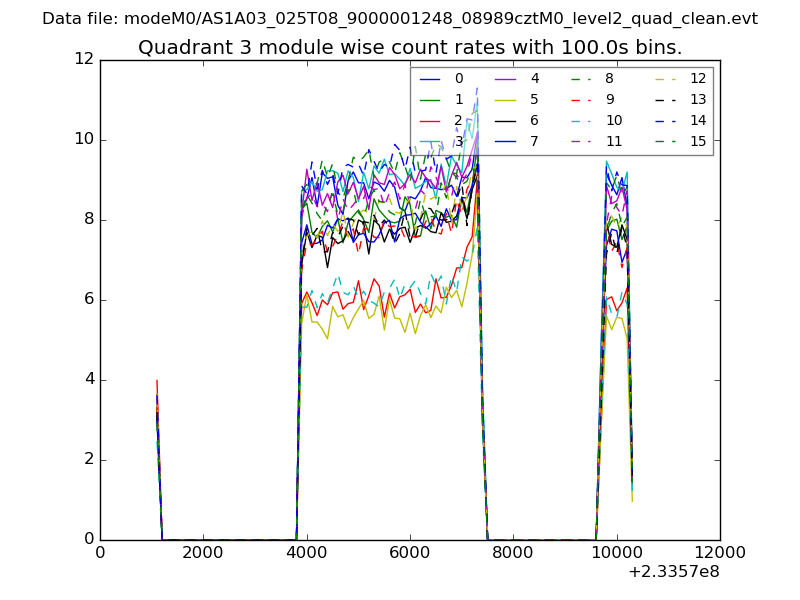
| Module-wise count rates for Quadrant A Data is divided into 100 sec bins |
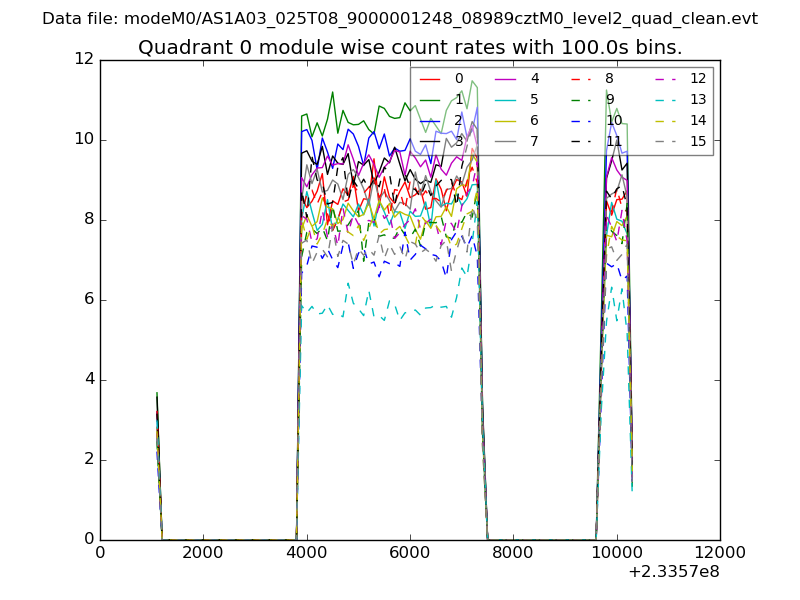 |
 |
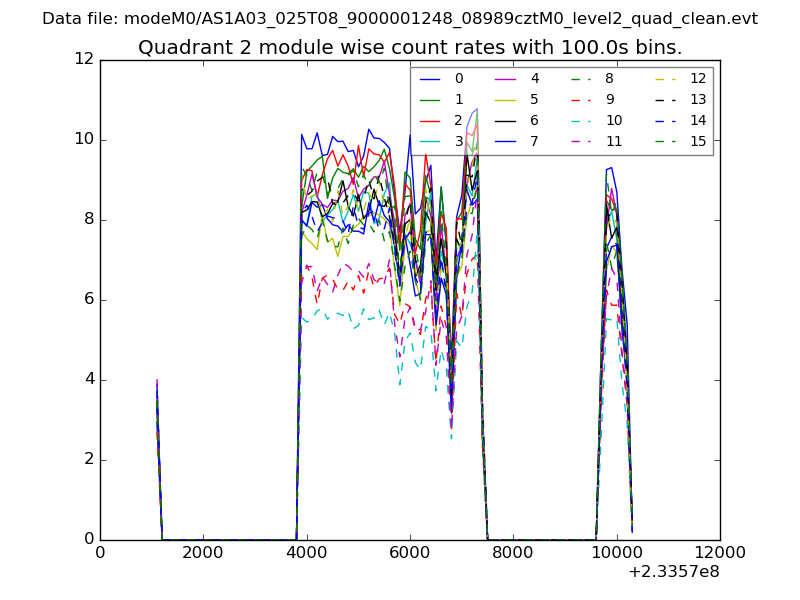
| Module-wise count rates for Quadrant B Data is divided into 100 sec bins |
 |
 |
| Module-wise count rates for Quadrant C Data is divided into 100 sec bins |
 |
 |
| Module-wise count rates for Quadrant D Data is divided into 100 sec bins |
 |
 |
| Parameter | Plot |
|---|---|
| CZT HV Monitor | 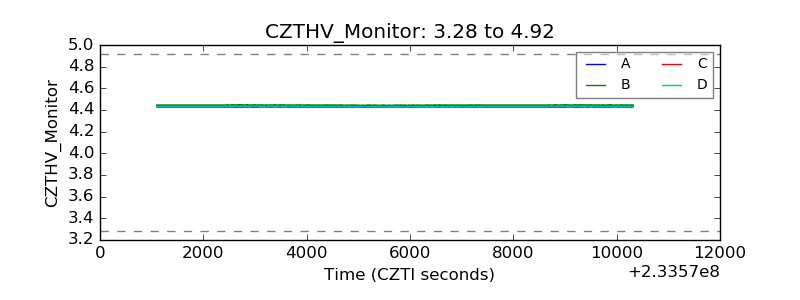 |
| D_VDD | 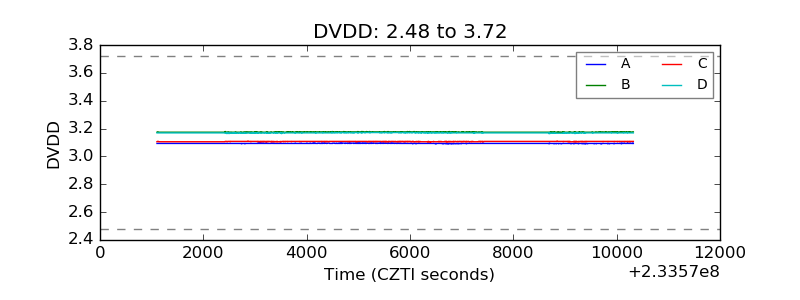 |
| Temperature 1 | 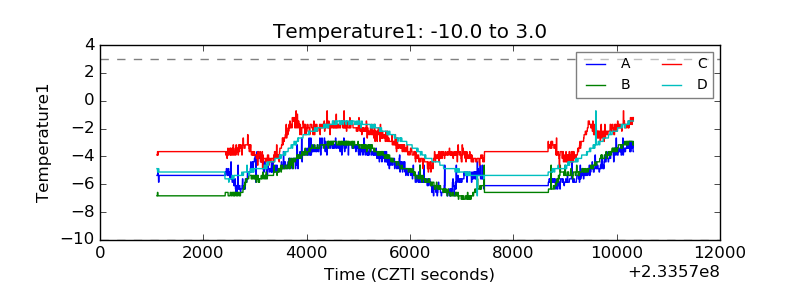 |
| Veto HV Monitor | 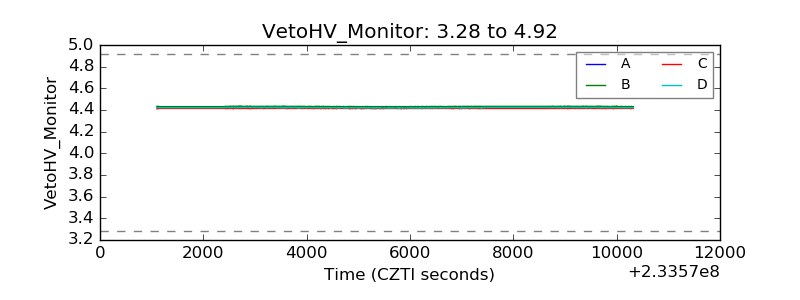 |
| Veto LLD | 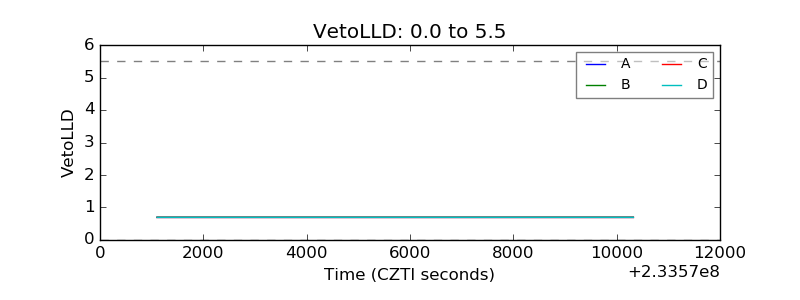 |
| Alpha Counter | 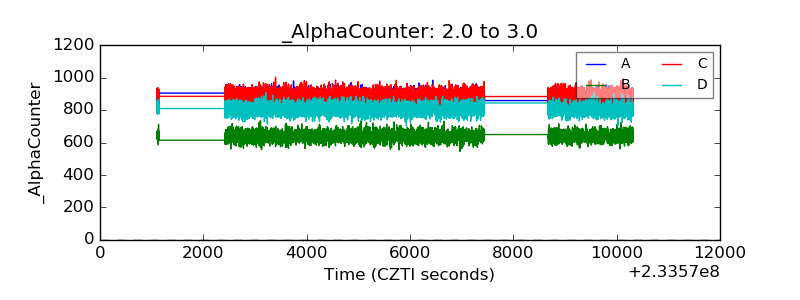 |
| _CPM_Rate | 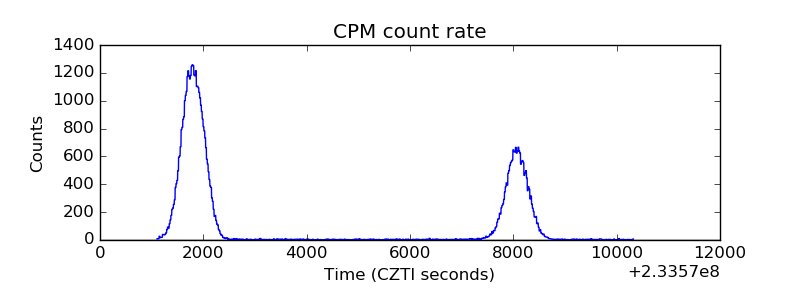 |
| CZT Counter |  |
| +2.5 Volts monitor |  |
| +5 Volts monitor |  |
| _ROLL_ROT | 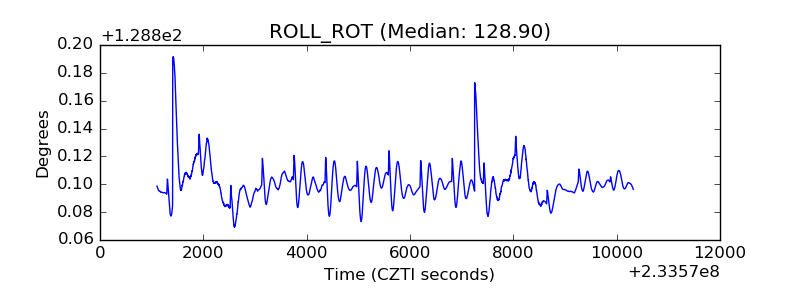 |
| _Roll_DEC | 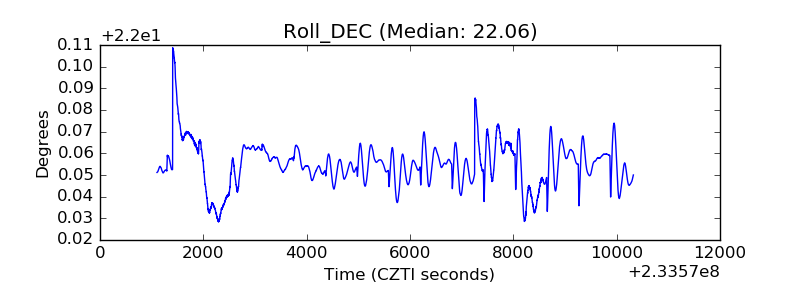 |
| _Roll_RA | 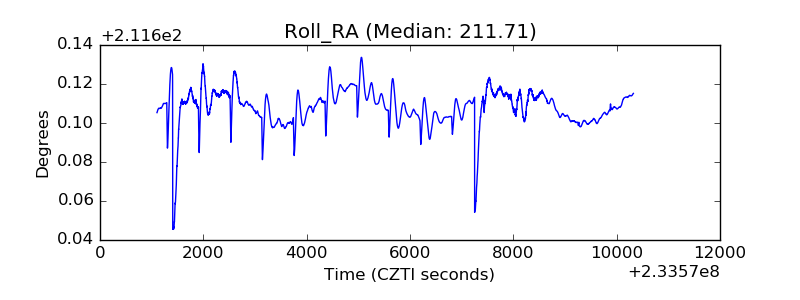 |
| Veto Counter | 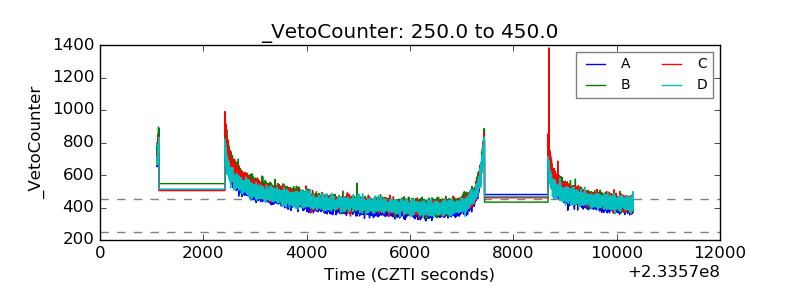 |