| Param | Original file | Final file |
|---|---|---|
| Filename | modeM0/AS1A03_025T08_9000001248_08990cztM0_level2.evt | modeM0/AS1A03_025T08_9000001248_08990cztM0_level2_quad_clean.evt |
| Size (bytes) | 568,080,000 | 88,355,520 |
| Size | 541.8 MB | 84.3 MB |
| Events in quadrant A | 3,666,949 | 586,464 |
| Events in quadrant B | 3,488,305 | 593,505 |
| Events in quadrant C | 5,946,905 | 458,734 |
| Events in quadrant D | 3,636,989 | 559,193 |
| Mode M9 | |||
|---|---|---|---|
| Quadrant | BADHDUFLAG | Total packets | Discarded packets |
| A | 0 | 16 | 0 |
| B | 0 | 16 | 0 |
| C | 0 | 16 | 0 |
| D | 0 | 17 | 0 |
| Mode M0 | |||
|---|---|---|---|
| Quadrant | BADHDUFLAG | Total packets | Discarded packets |
| A | 0 | 14986 | 3 |
| B | 0 | 14580 | 2 |
| C | 0 | 22196 | 2 |
| D | 0 | 15165 | 2 |
| Mode SS | |||
|---|---|---|---|
| Quadrant | BADHDUFLAG | Total packets | Discarded packets |
| A | 0 | 140 | 0 |
| B | 0 | 140 | 0 |
| C | 0 | 140 | 0 |
| D | 0 | 140 | 0 |
| Quadrant | Total seconds | Saturated seconds | Saturation percentage |
|---|---|---|---|
| A | 6846 | 175 | 2.556237% |
| B | 6846 | 161 | 2.351738% |
| C | 6846 | 1483 | 21.662285% |
| D | 6846 | 175 | 2.556237% |
Noise dominated data is calculated using 1-second bins in cleaned event files. If a bin has >2000 counts, and if more than 50% of those come from <1% of pixels, then it is considered to be noise-dominated and hence unusable.
| Quadrant | # 1 sec bins | Bins with >0 counts | Bins with >2000 counts | High rate bins dominated by noise | Noise dominated (total time) | Noise dominated (detector-on time) | Marked lightcurve |
|---|---|---|---|---|---|---|---|
| A | 7841 | 6846 | 22 | 22 | 0.28% | 0.32% | 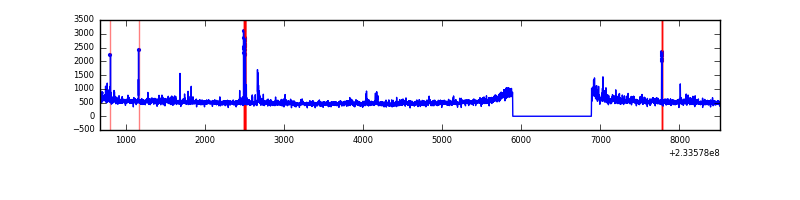 |
| B | 7841 | 6846 | 10 | 10 | 0.13% | 0.15% |  |
| C | 7841 | 6846 | 724 | 724 | 9.23% | 10.58% | 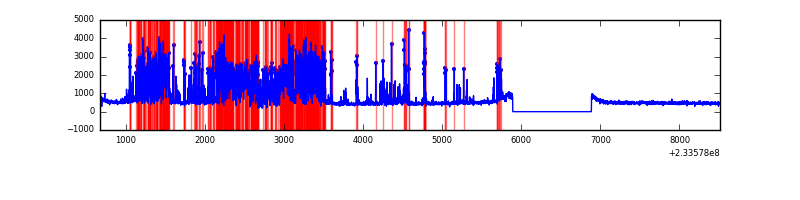 |
| D | 7841 | 6846 | 40 | 40 | 0.51% | 0.58% |  |
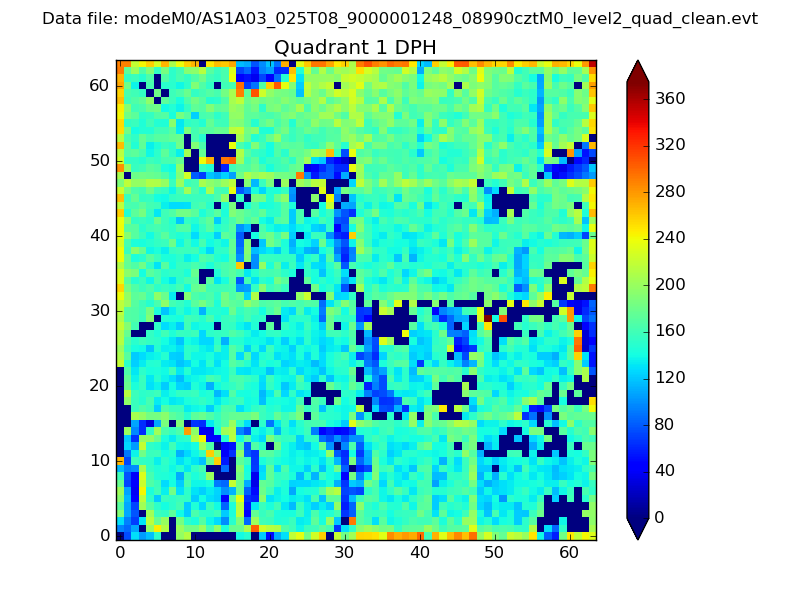
Top three noisy pixels from each quadrant. If the there are fewer than three noisy pixels in the level2.evt file, extra rows are filled as -1
| Pixel properties | Quadrant properties | ||||||
|---|---|---|---|---|---|---|---|
| Quadrant | DetID | PixID | Counts | Sigma | Mean | Median | Sigma |
| A | 8 | 5 | 244447 | 1370.98 | 870 | 851 | 177.7 |
| A | 15 | 174 | 65678 | 364.85 | 870 | 851 | 177.7 |
| A | 3 | 1 | 14844 | 78.75 | 870 | 851 | 177.7 |
| B | 10 | 16 | 32984 | 193.84 | 864 | 844 | 165.8 |
| B | 4 | 173 | 25124 | 146.43 | 864 | 844 | 165.8 |
| B | 0 | 198 | 23897 | 139.03 | 864 | 844 | 165.8 |
| C | 4 | 254 | 3070946 | 18093.35 | 727 | 730 | 169.7 |
| C | 4 | 238 | 35716 | 206.18 | 727 | 730 | 169.7 |
| C | 9 | 68 | 6314 | 32.91 | 727 | 730 | 169.7 |
| D | 1 | 52 | 366918 | 1758.71 | 835 | 814 | 208.2 |
| D | 7 | 71 | 55683 | 263.58 | 835 | 814 | 208.2 |
| D | 2 | 234 | 27790 | 129.59 | 835 | 814 | 208.2 |
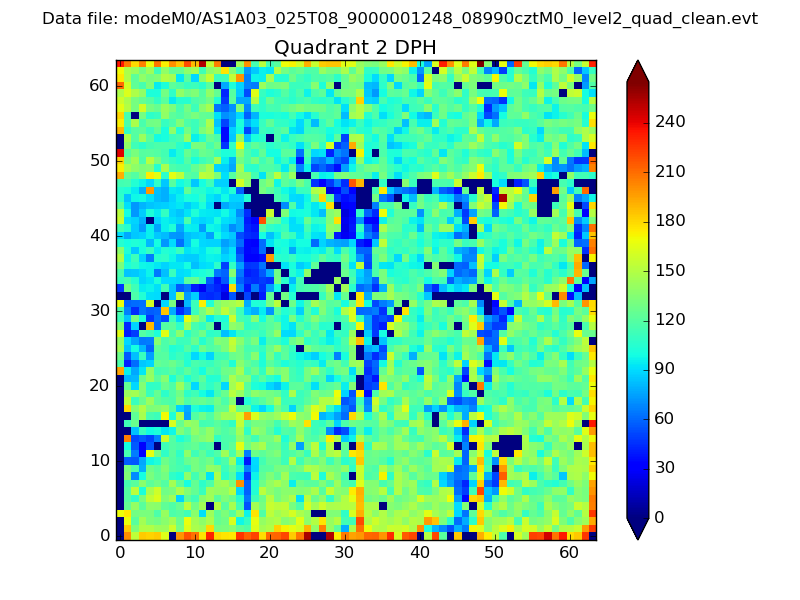
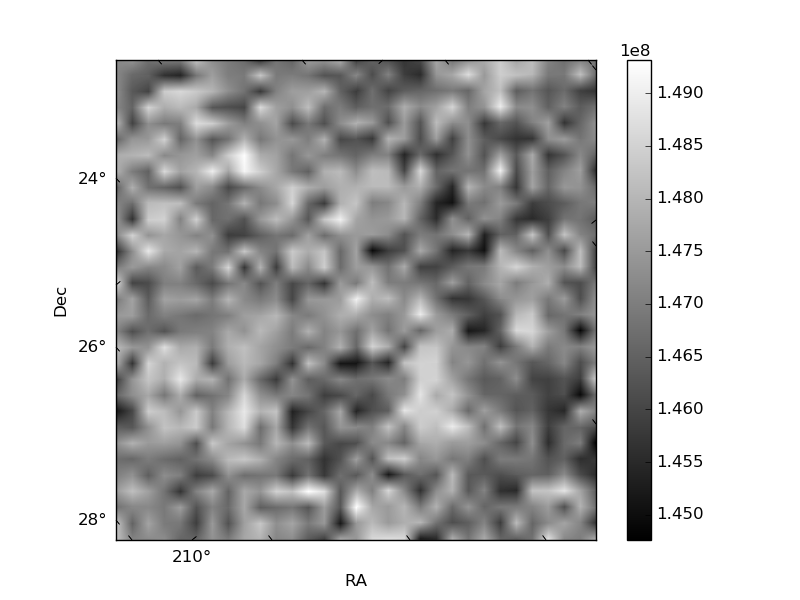
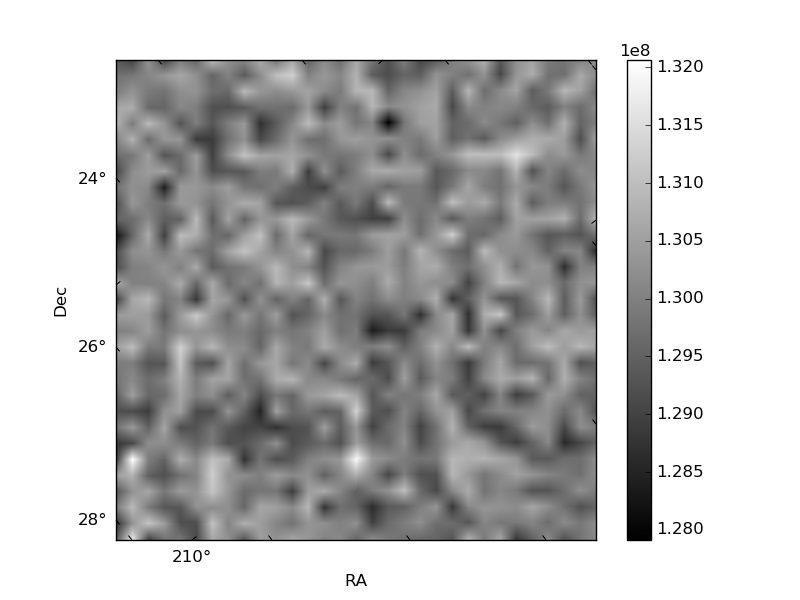
Histogram calculated using DETX and DETY for each event in the final _common_clean file
| Quadrant A | 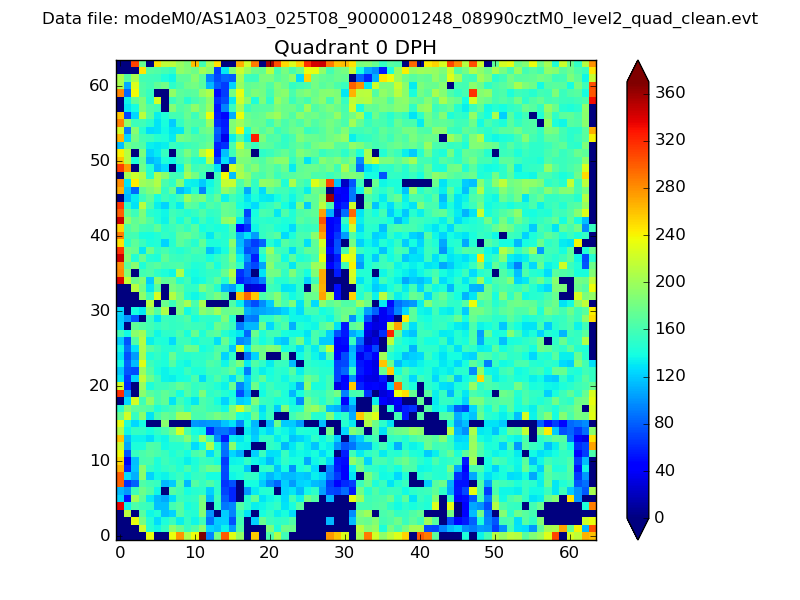 |
 |
Quadrant B |
|---|---|---|---|
| Quadrant D | 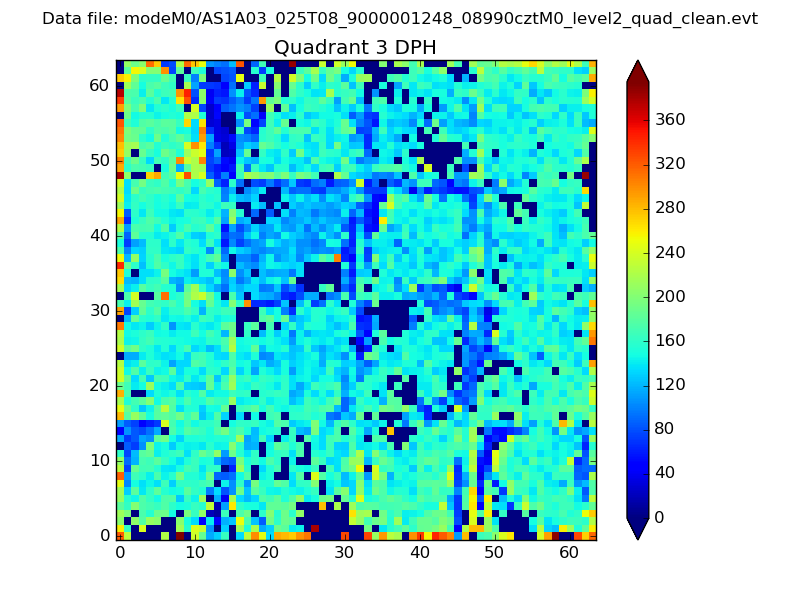 |
 |
Quadrant C |
| Plot type | Count rate plots | Images |
|---|---|---|
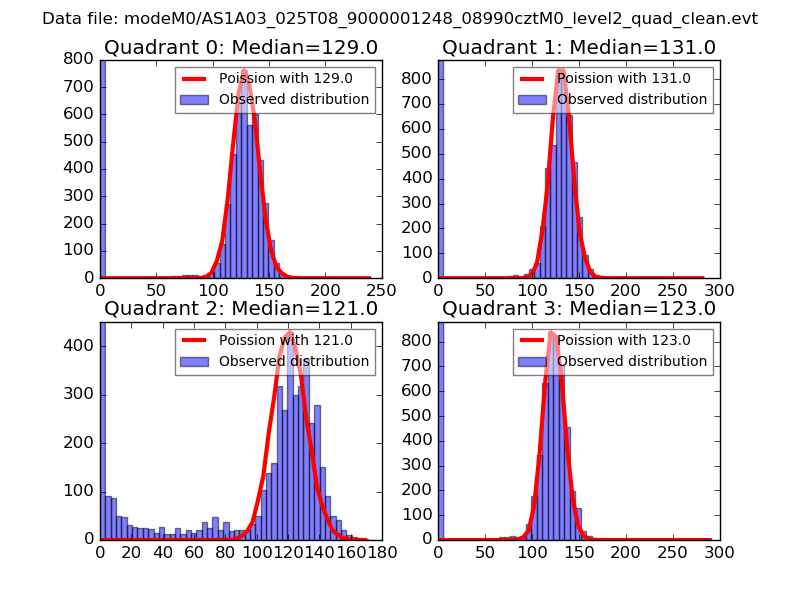
| Comparison with Poisson distribution Blue bars denote a histogram of data divided into 1 sec bins. Red curve is a Poisson curve with rate = median count rate of data. |
 |
 |
| Quadrant-wise count rates Data is divided into 100 sec bins |
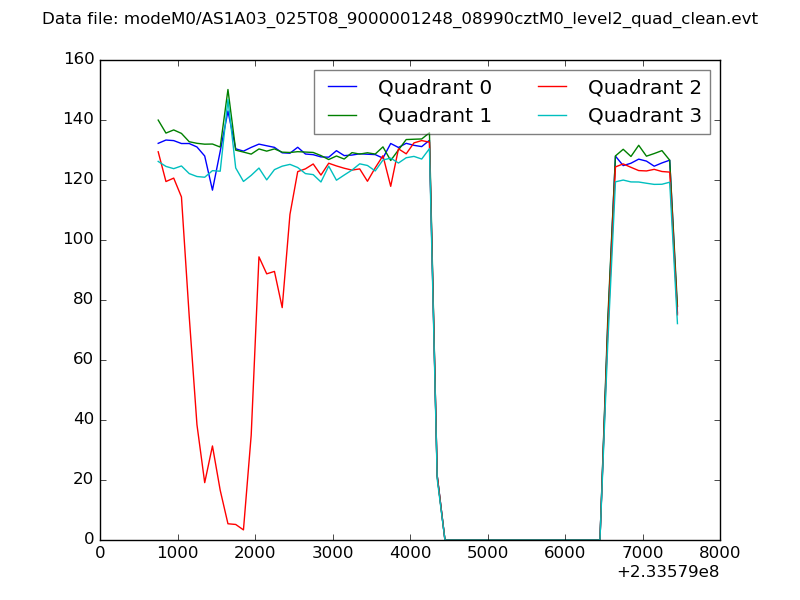 |
|
| Module-wise count rates for Quadrant A Data is divided into 100 sec bins |
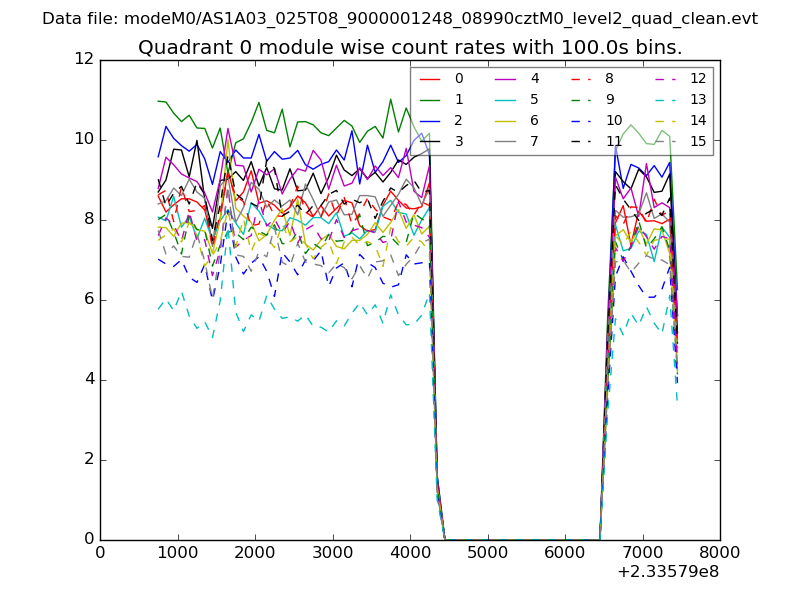 |
 |
| Module-wise count rates for Quadrant B Data is divided into 100 sec bins |
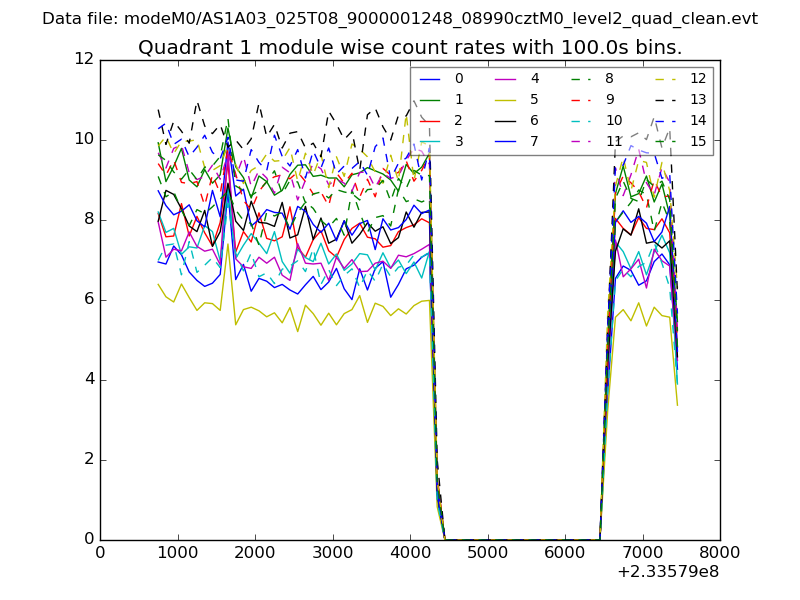 |
 |
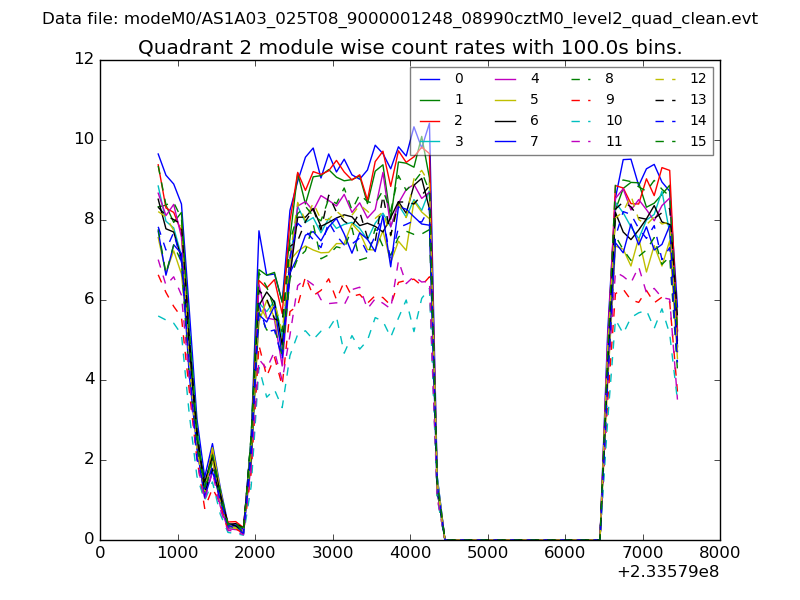
| Module-wise count rates for Quadrant C Data is divided into 100 sec bins |
 |
 |
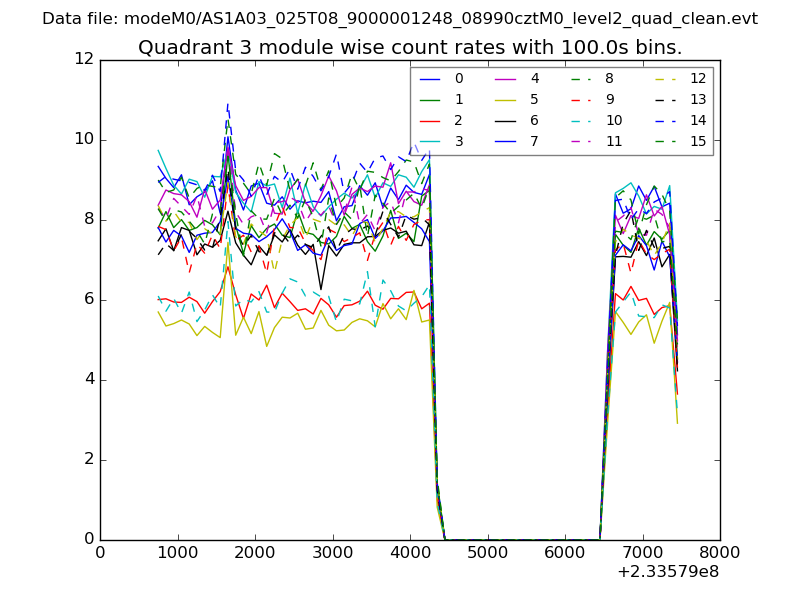
| Module-wise count rates for Quadrant D Data is divided into 100 sec bins |
 |
 |
| Parameter | Plot |
|---|---|
| CZT HV Monitor | 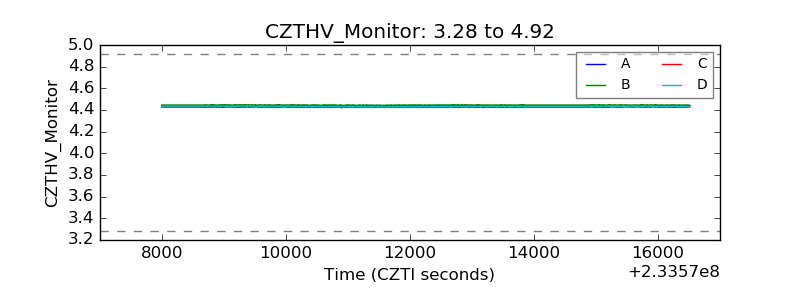 |
| D_VDD | 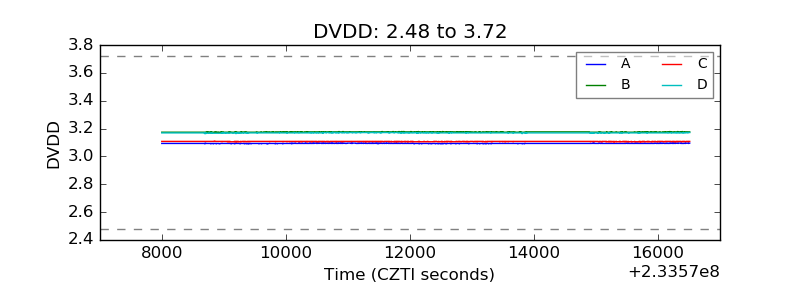 |
| Temperature 1 | 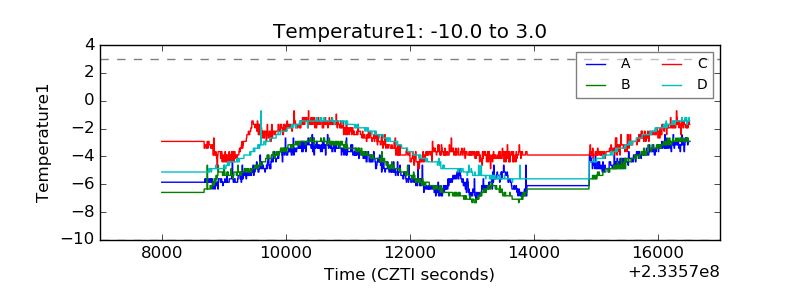 |
| Veto HV Monitor | 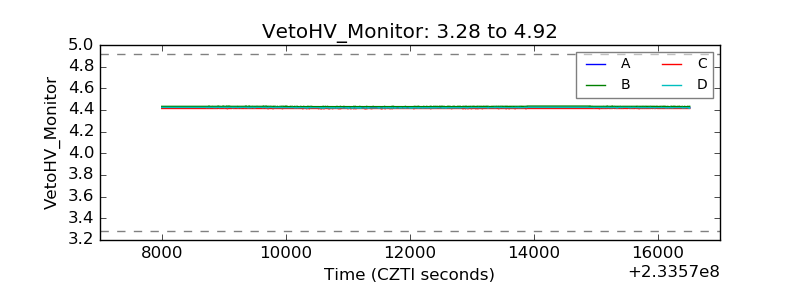 |
| Veto LLD | 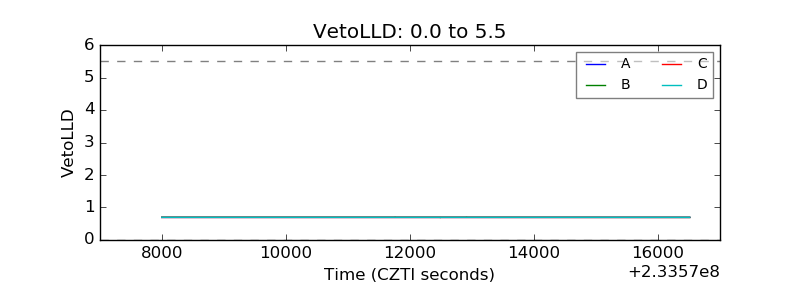 |
| Alpha Counter | 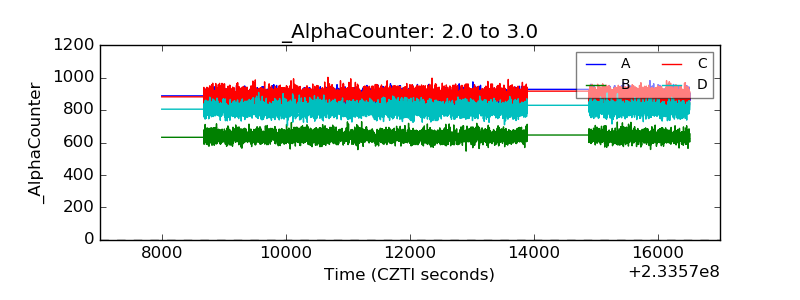 |
| _CPM_Rate | 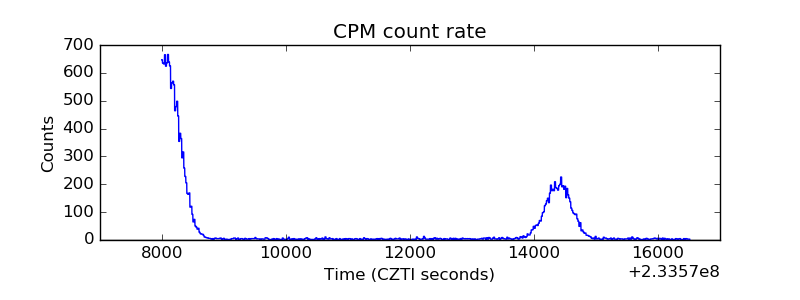 |
| CZT Counter | 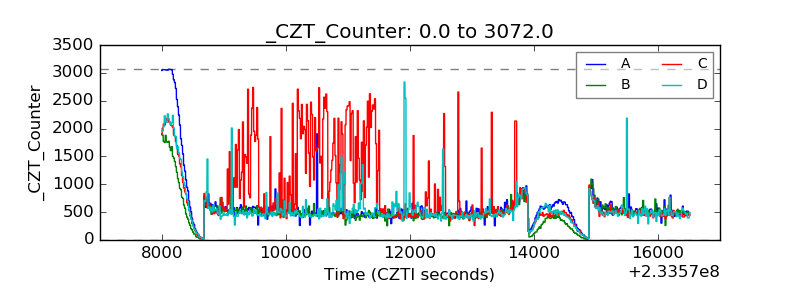 |
| +2.5 Volts monitor |  |
| +5 Volts monitor |  |
| _ROLL_ROT | 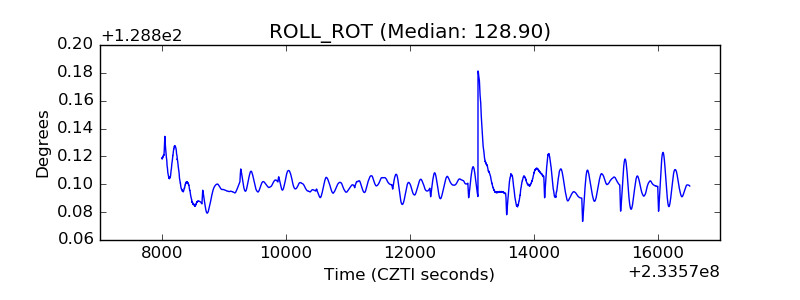 |
| _Roll_DEC | 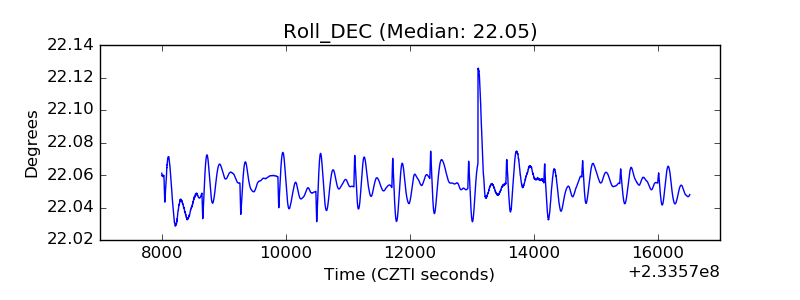 |
| _Roll_RA | 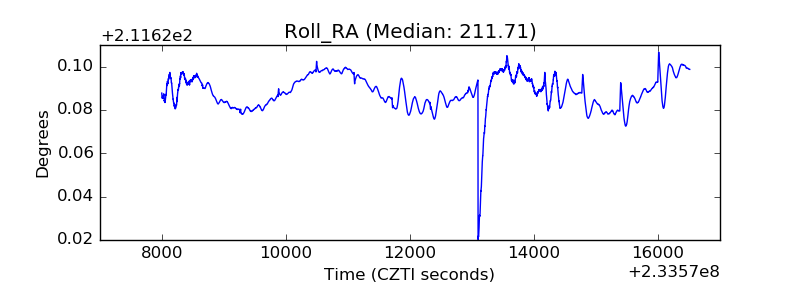 |
| Veto Counter | 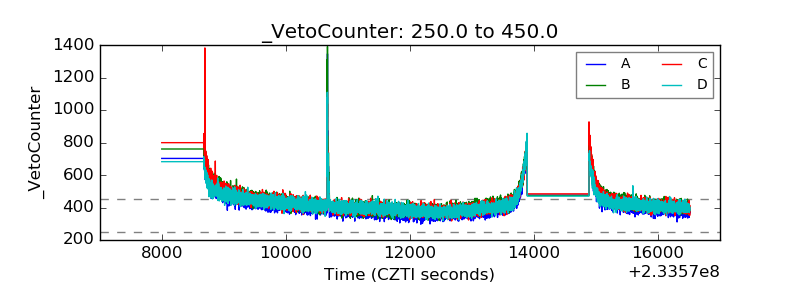 |