| Param | Original file | Final file |
|---|---|---|
| Filename | modeM0/AS1A03_025T08_9000001248_08992cztM0_level2.evt | modeM0/AS1A03_025T08_9000001248_08992cztM0_level2_quad_clean.evt |
| Size (bytes) | 189,817,920 | 37,054,080 |
| Size | 181.0 MB | 35.3 MB |
| Events in quadrant A | 1,465,500 | 236,979 |
| Events in quadrant B | 1,403,784 | 231,256 |
| Events in quadrant C | 1,311,068 | 226,149 |
| Events in quadrant D | 1,368,794 | 221,143 |
| Mode M9 | |||
|---|---|---|---|
| Quadrant | BADHDUFLAG | Total packets | Discarded packets |
| A | 0 | 12 | 6 |
| B | 0 | 12 | 7 |
| C | 0 | 11 | 5 |
| D | 0 | 12 | 6 |
| Mode M0 | |||
|---|---|---|---|
| Quadrant | BADHDUFLAG | Total packets | Discarded packets |
| A | 0 | 27762 | 21556 |
| B | 0 | 26223 | 20162 |
| C | 0 | 27720 | 21818 |
| D | 0 | 27597 | 21602 |
| Mode SS | |||
|---|---|---|---|
| Quadrant | BADHDUFLAG | Total packets | Discarded packets |
| A | 0 | 252 | 192 |
| B | 0 | 253 | 195 |
| C | 0 | 254 | 194 |
| D | 0 | 252 | 190 |
| Quadrant | Total seconds | Saturated seconds | Saturation percentage |
|---|---|---|---|
| A | 2871 | 64 | 2.229188% |
| B | 2874 | 64 | 2.226862% |
| C | 2868 | 35 | 1.220363% |
| D | 2820 | 38 | 1.347518% |
Noise dominated data is calculated using 1-second bins in cleaned event files. If a bin has >2000 counts, and if more than 50% of those come from <1% of pixels, then it is considered to be noise-dominated and hence unusable.
| Quadrant | # 1 sec bins | Bins with >0 counts | Bins with >2000 counts | High rate bins dominated by noise | Noise dominated (total time) | Noise dominated (detector-on time) | Marked lightcurve |
|---|---|---|---|---|---|---|---|
| A | 13438 | 4161 | 6 | 6 | 0.04% | 0.14% | 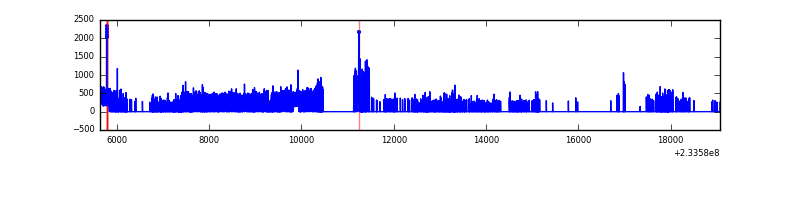 |
| B | 13305 | 4232 | 1 | 1 | 0.01% | 0.02% | 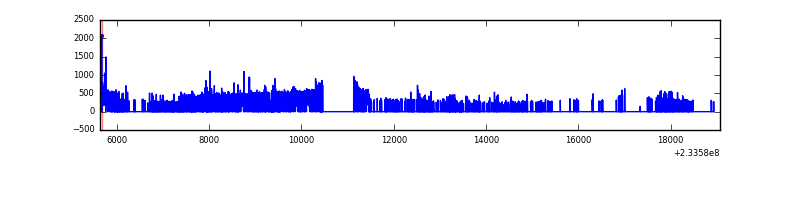 |
| C | 13401 | 4189 | 0 | 0 | 0.00% | 0.00% | 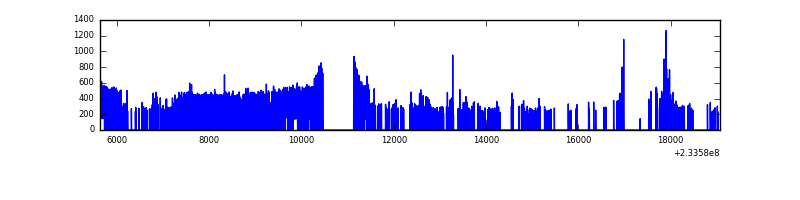 |
| D | 13371 | 4154 | 3 | 3 | 0.02% | 0.07% | 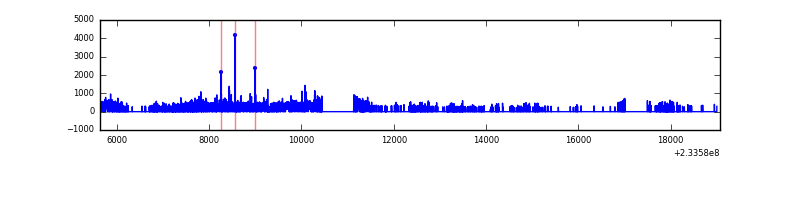 |
Top three noisy pixels from each quadrant. If the there are fewer than three noisy pixels in the level2.evt file, extra rows are filled as -1
| Pixel properties | Quadrant properties | ||||||
|---|---|---|---|---|---|---|---|
| Quadrant | DetID | PixID | Counts | Sigma | Mean | Median | Sigma |
| A | 8 | 5 | 131315 | 1826.95 | 341 | 333 | 71.7 |
| A | 15 | 174 | 13996 | 190.57 | 341 | 333 | 71.7 |
| A | 3 | 1 | 5663 | 74.34 | 341 | 333 | 71.7 |
| B | 4 | 173 | 15263 | 220.23 | 345 | 336 | 67.8 |
| B | 0 | 198 | 12407 | 178.09 | 345 | 336 | 67.8 |
| B | 10 | 16 | 11690 | 167.52 | 345 | 336 | 67.8 |
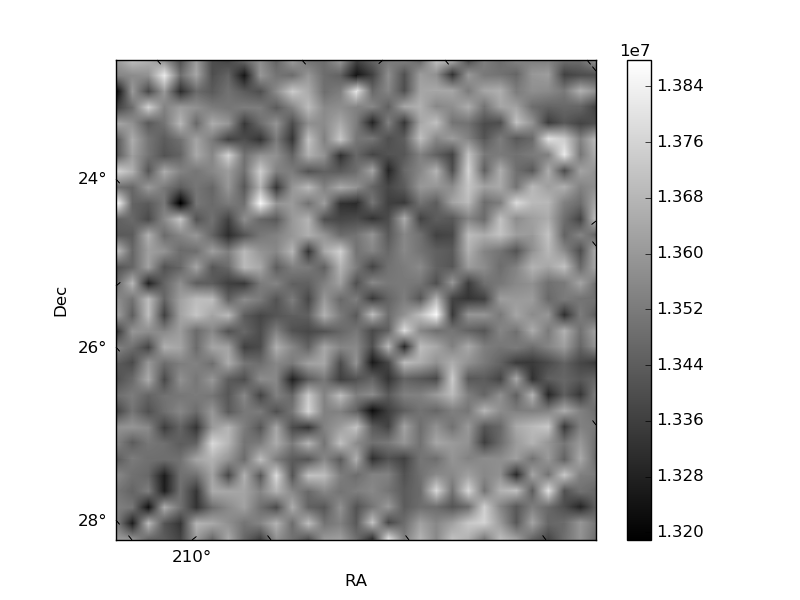
| C | 4 | 254 | 11311 | 138.47 | 333 | 335 | 79.3 |
| C | 13 | 61 | 2455 | 26.74 | 333 | 335 | 79.3 |
| C | 14 | 67 | 1515 | 14.89 | 333 | 335 | 79.3 |
| D | 1 | 52 | 69230 | 821.46 | 326 | 317 | 83.9 |
| D | 6 | 225 | 28976 | 341.62 | 326 | 317 | 83.9 |
| D | 7 | 71 | 13784 | 160.53 | 326 | 317 | 83.9 |
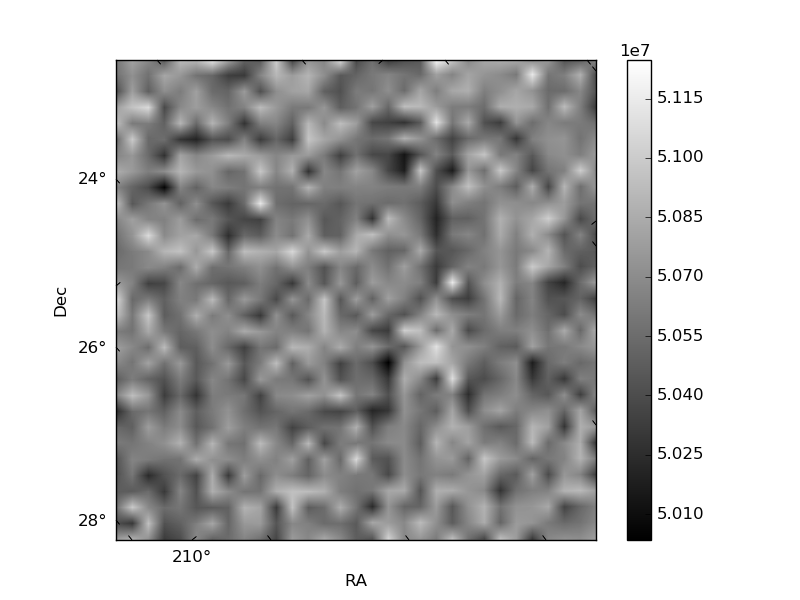
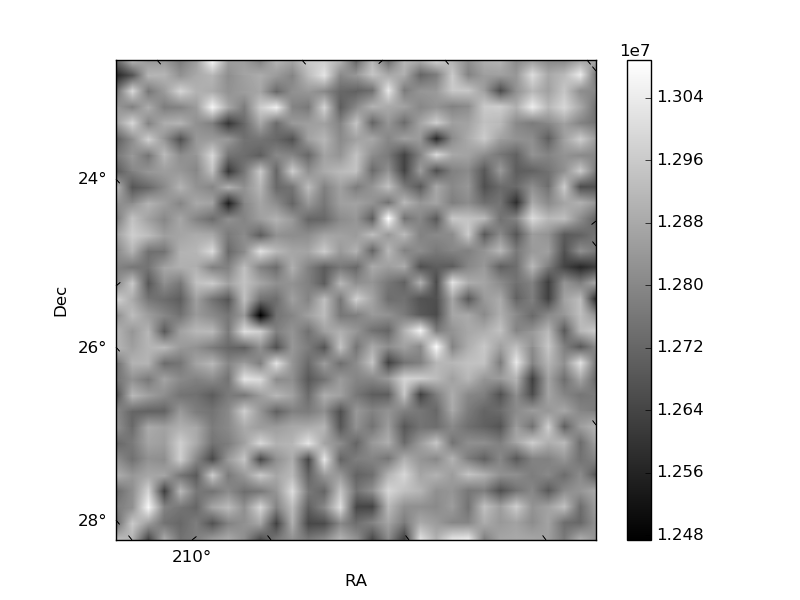
Histogram calculated using DETX and DETY for each event in the final _common_clean file
| Quadrant A | 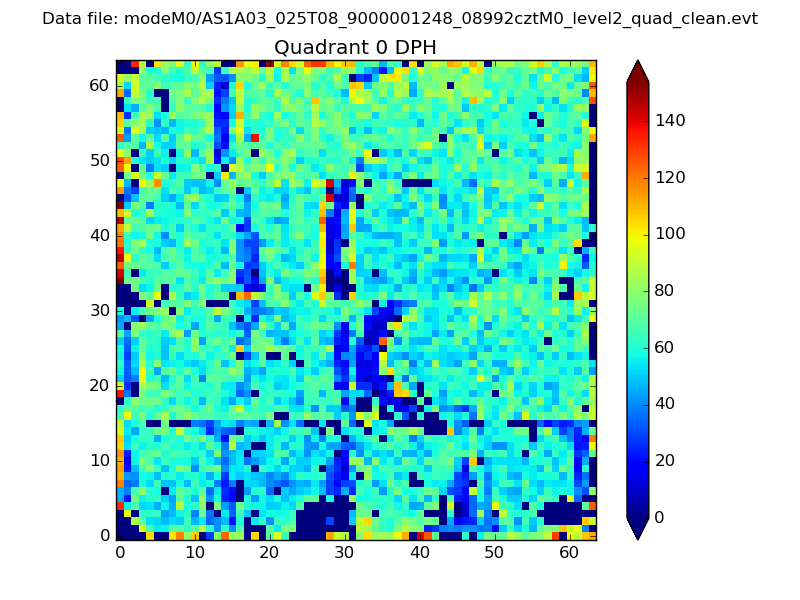 |
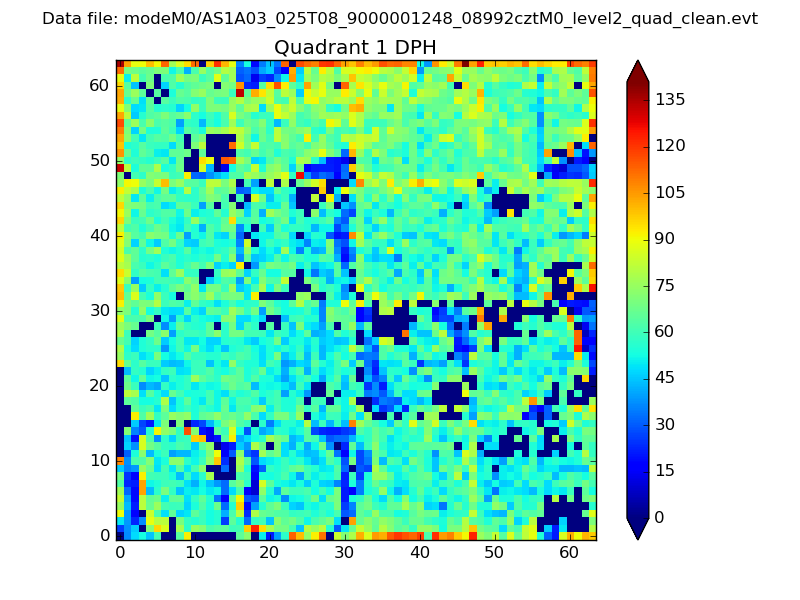 |
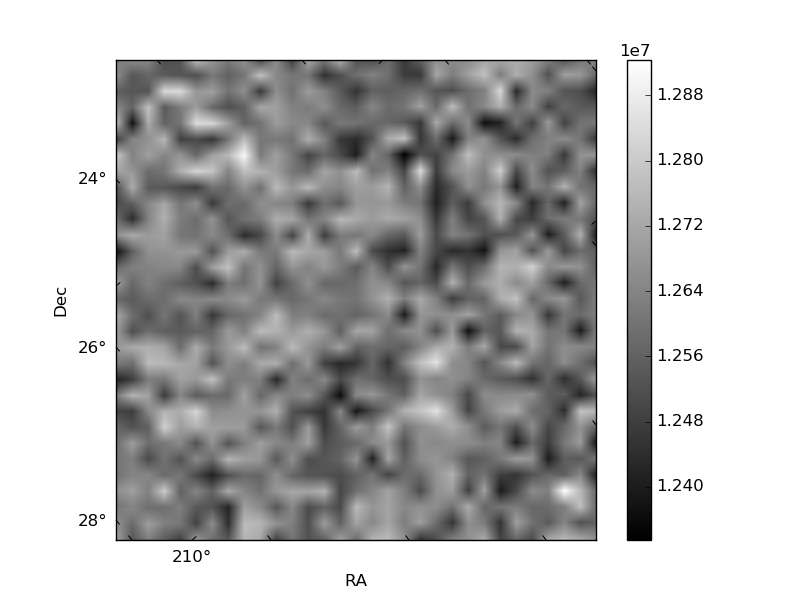
Quadrant B |
|---|---|---|---|
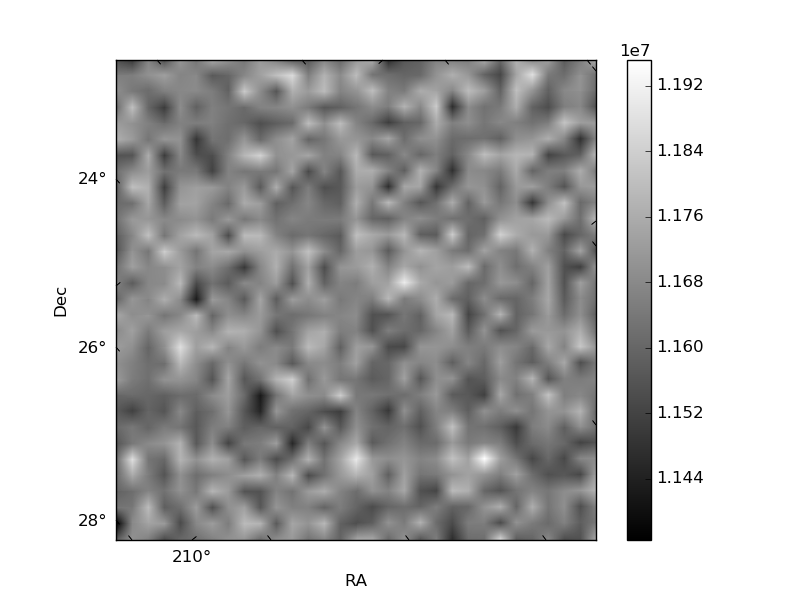
| Quadrant D | 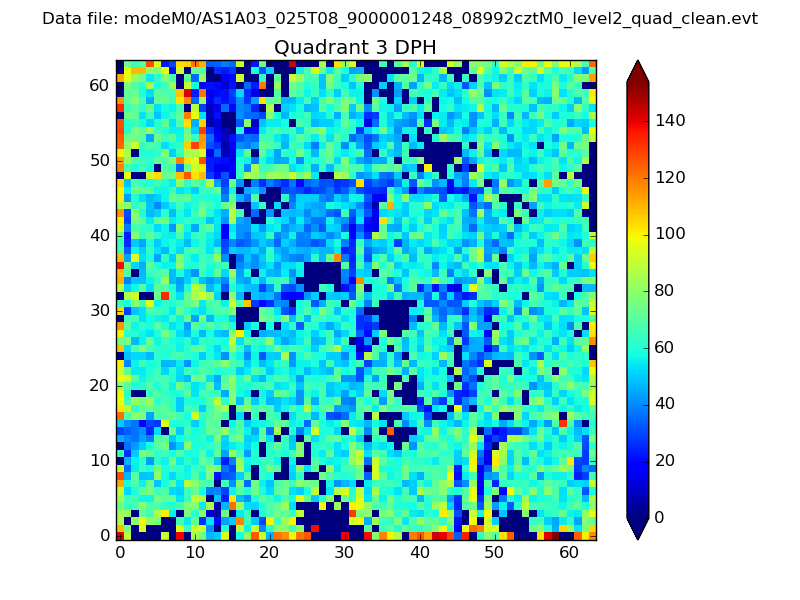 |
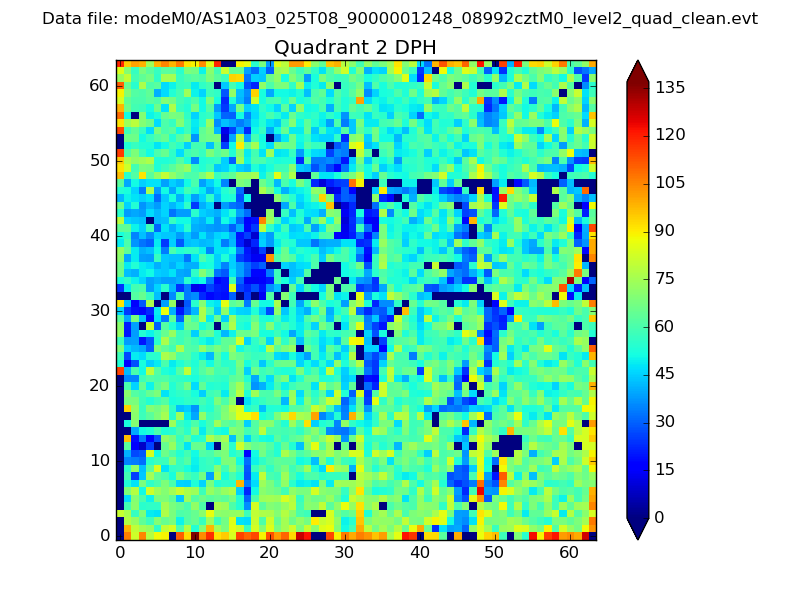 |
Quadrant C |
| Plot type | Count rate plots | Images |
|---|---|---|
| Comparison with Poisson distribution Blue bars denote a histogram of data divided into 1 sec bins. Red curve is a Poisson curve with rate = median count rate of data. |
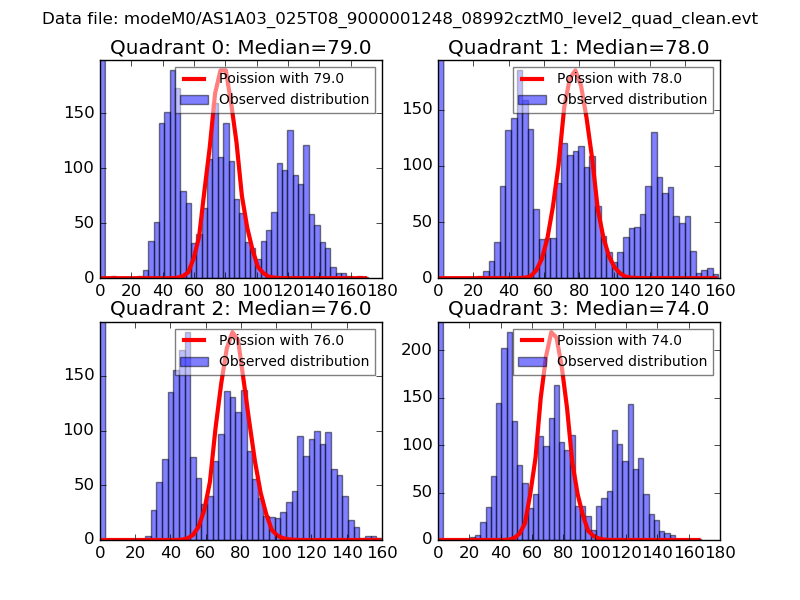 |
 |
| Quadrant-wise count rates Data is divided into 100 sec bins |
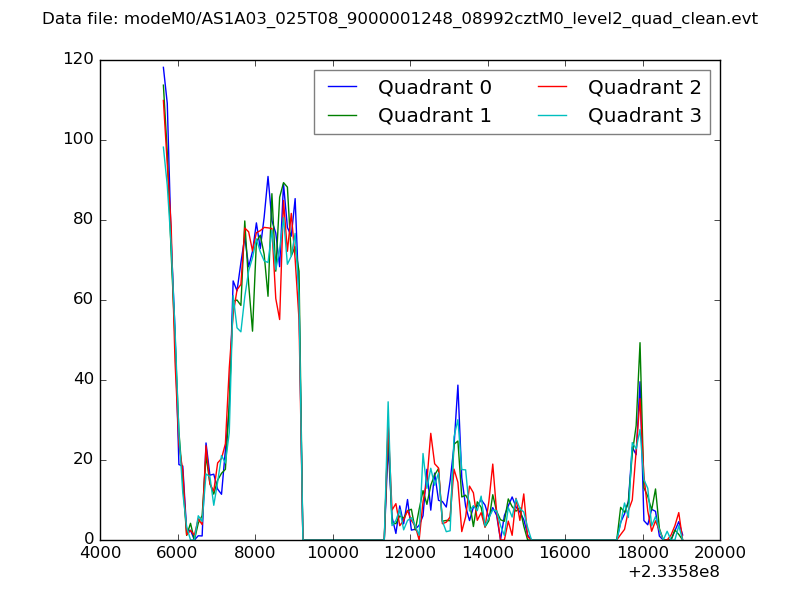 |
|
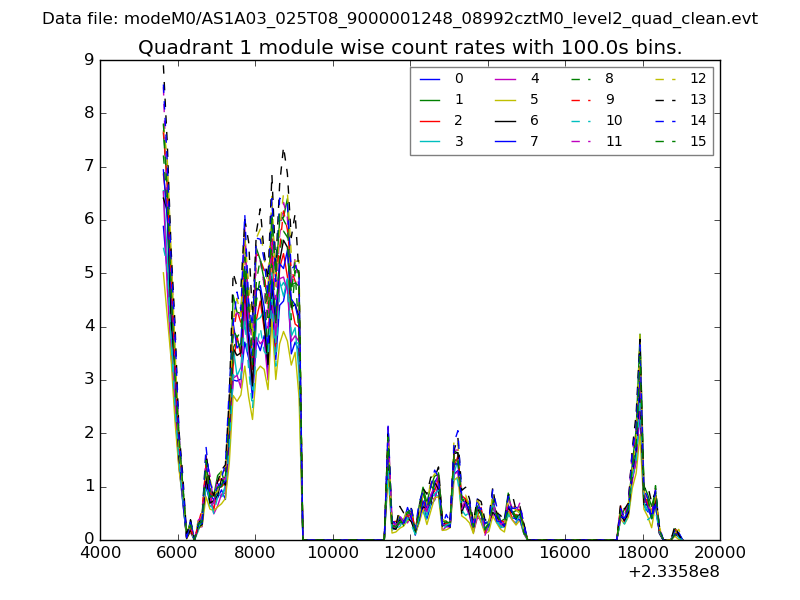
| Module-wise count rates for Quadrant A Data is divided into 100 sec bins |
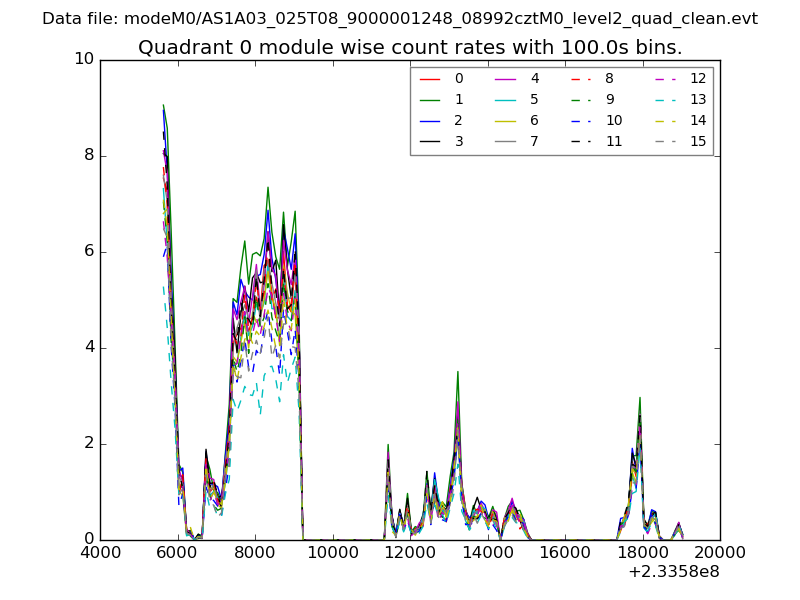 |
 |
| Module-wise count rates for Quadrant B Data is divided into 100 sec bins |
 |
 |
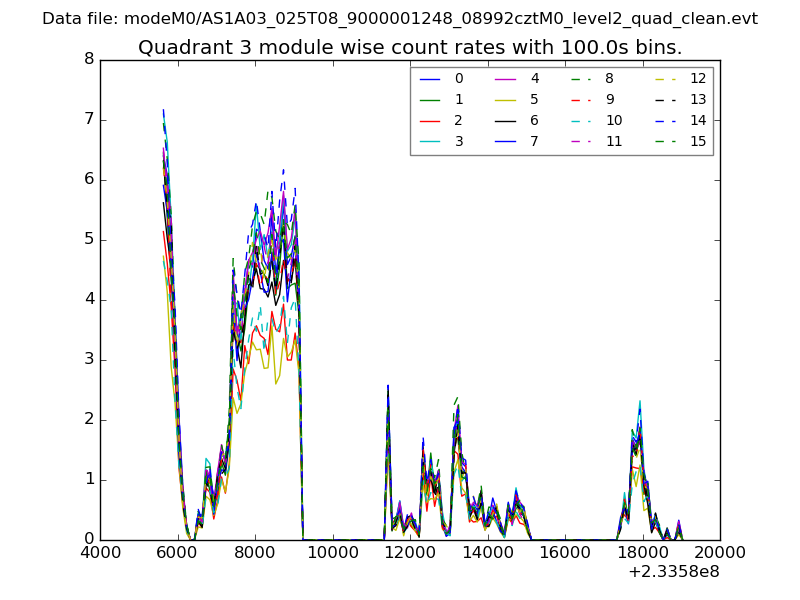
| Module-wise count rates for Quadrant C Data is divided into 100 sec bins |
 |
 |
| Module-wise count rates for Quadrant D Data is divided into 100 sec bins |
 |
 |
| Parameter | Plot |
|---|---|
| CZT HV Monitor |  |
| D_VDD | 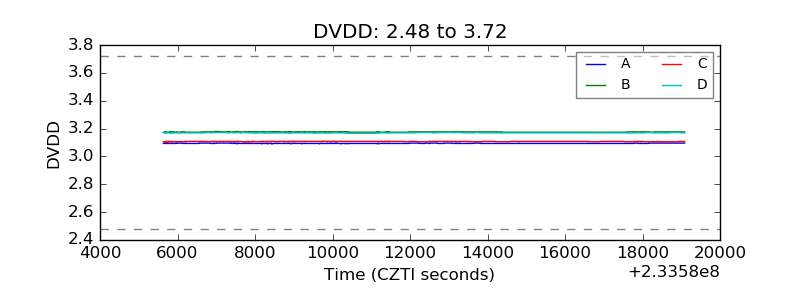 |
| Temperature 1 | 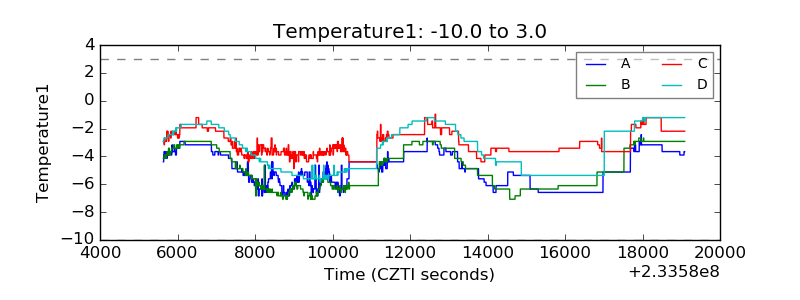 |
| Veto HV Monitor | 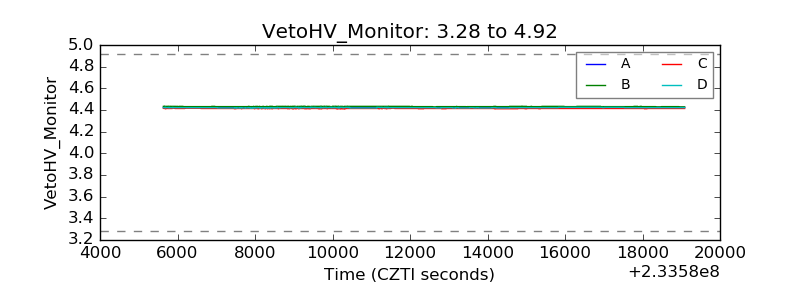 |
| Veto LLD | 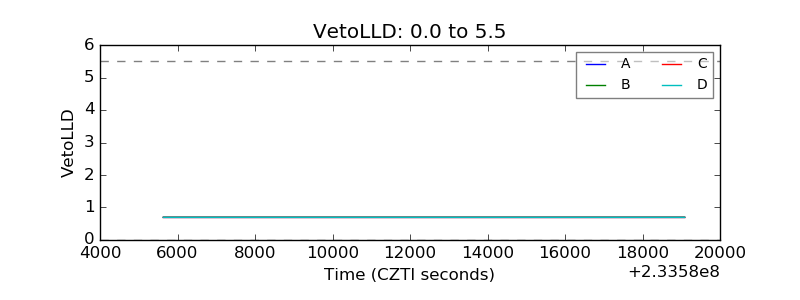 |
| Alpha Counter | 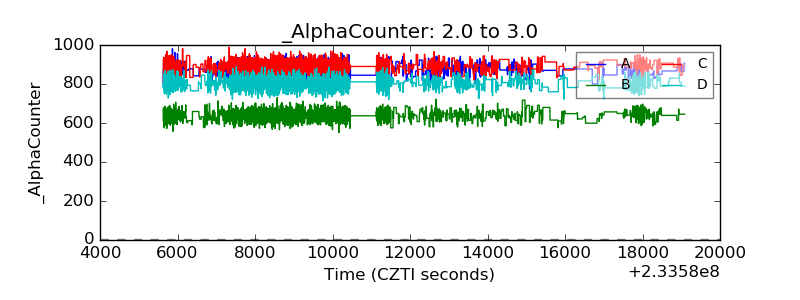 |
| _CPM_Rate | 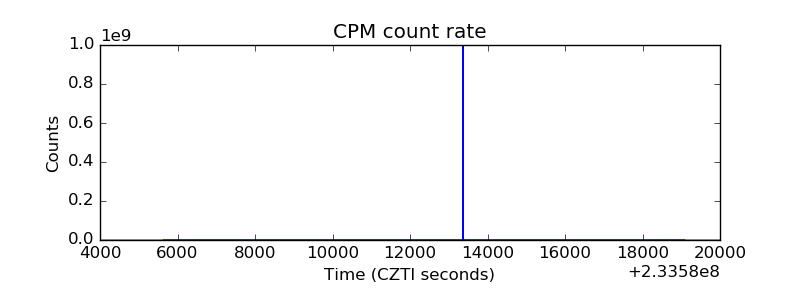 |
| CZT Counter |  |
| +2.5 Volts monitor |  |
| +5 Volts monitor |  |
| _ROLL_ROT | 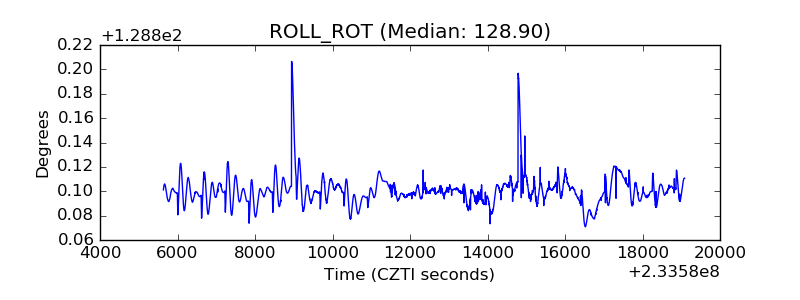 |
| _Roll_DEC | 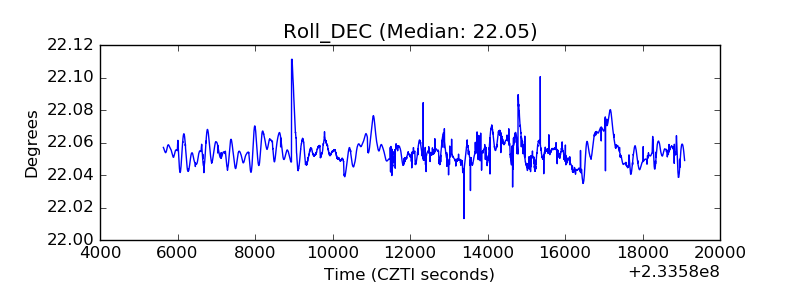 |
| _Roll_RA | 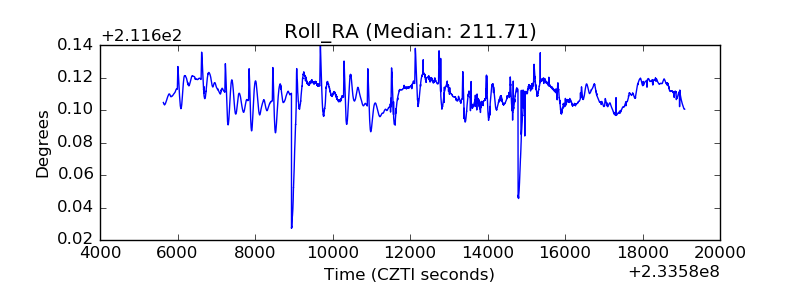 |
| Veto Counter | 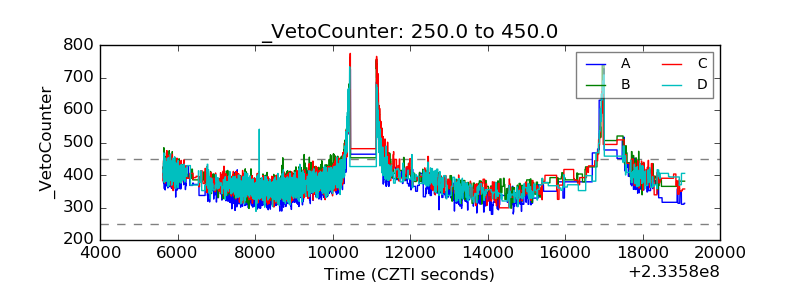 |