| Param | Original file | Final file |
|---|---|---|
| Filename | modeM0/AS1A03_025T08_9000001248_08993cztM0_level2.evt | modeM0/AS1A03_025T08_9000001248_08993cztM0_level2_quad_clean.evt |
| Size (bytes) | 192,363,840 | 45,892,800 |
| Size | 183.5 MB | 43.8 MB |
| Events in quadrant A | 1,468,459 | 305,715 |
| Events in quadrant B | 1,253,082 | 311,611 |
| Events in quadrant C | 1,532,928 | 294,749 |
| Events in quadrant D | 1,395,166 | 293,865 |
| Mode M9 | |||
|---|---|---|---|
| Quadrant | BADHDUFLAG | Total packets | Discarded packets |
| A | 0 | 3 | 0 |
| B | 0 | 3 | 0 |
| C | 0 | 3 | 0 |
| D | 0 | 3 | 0 |
| Mode M0 | |||
|---|---|---|---|
| Quadrant | BADHDUFLAG | Total packets | Discarded packets |
| A | 0 | 6047 | 1 |
| B | 0 | 5453 | 1 |
| C | 0 | 6359 | 1 |
| D | 0 | 5906 | 1 |
| Mode SS | |||
|---|---|---|---|
| Quadrant | BADHDUFLAG | Total packets | Discarded packets |
| A | 0 | 54 | 0 |
| B | 0 | 54 | 0 |
| C | 0 | 54 | 0 |
| D | 0 | 54 | 0 |
| Quadrant | Total seconds | Saturated seconds | Saturation percentage |
|---|---|---|---|
| A | 2556 | 109 | 4.264476% |
| B | 2556 | 95 | 3.716745% |
| C | 2556 | 194 | 7.589984% |
| D | 2556 | 107 | 4.186228% |
Noise dominated data is calculated using 1-second bins in cleaned event files. If a bin has >2000 counts, and if more than 50% of those come from <1% of pixels, then it is considered to be noise-dominated and hence unusable.
| Quadrant | # 1 sec bins | Bins with >0 counts | Bins with >2000 counts | High rate bins dominated by noise | Noise dominated (total time) | Noise dominated (detector-on time) | Marked lightcurve |
|---|---|---|---|---|---|---|---|
| A | 2851 | 2557 | 1 | 1 | 0.04% | 0.04% | 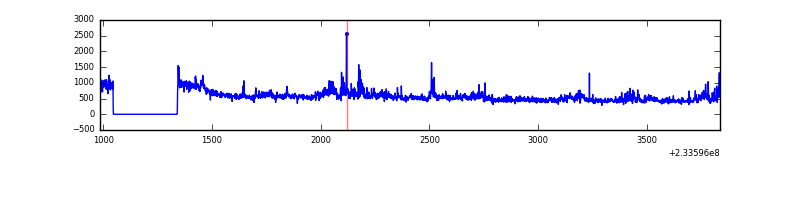 |
| B | 2851 | 2557 | 0 | 0 | 0.00% | 0.00% | 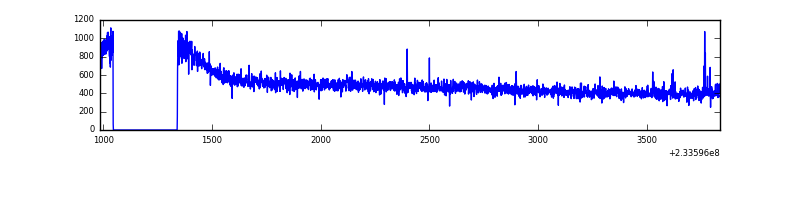 |
| C | 2851 | 2557 | 57 | 57 | 2.00% | 2.23% | 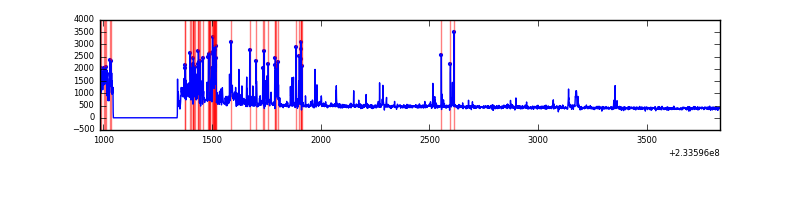 |
| D | 2851 | 2557 | 25 | 25 | 0.88% | 0.98% |  |
Top three noisy pixels from each quadrant. If the there are fewer than three noisy pixels in the level2.evt file, extra rows are filled as -1
| Pixel properties | Quadrant properties | ||||||
|---|---|---|---|---|---|---|---|
| Quadrant | DetID | PixID | Counts | Sigma | Mean | Median | Sigma |
| A | 8 | 5 | 232054 | 3470.46 | 318 | 309 | 66.8 |
| A | 5 | 16 | 8305 | 119.74 | 318 | 309 | 66.8 |
| A | 3 | 1 | 4053 | 56.06 | 318 | 309 | 66.8 |
| B | 0 | 219 | 12744 | 195.5 | 317 | 309 | 63.6 |
| B | 12 | 111 | 6775 | 101.65 | 317 | 309 | 63.6 |
| B | 11 | 111 | 5494 | 81.52 | 317 | 309 | 63.6 |
| C | 4 | 254 | 364829 | 5125.27 | 298 | 299 | 71.1 |
| C | 4 | 238 | 2527 | 31.33 | 298 | 299 | 71.1 |
| C | 13 | 61 | 2274 | 27.77 | 298 | 299 | 71.1 |
| D | 1 | 52 | 120618 | 1429.75 | 314 | 307 | 84.1 |
| D | 7 | 71 | 56517 | 667.99 | 314 | 307 | 84.1 |
| D | 2 | 234 | 11647 | 134.76 | 314 | 307 | 84.1 |
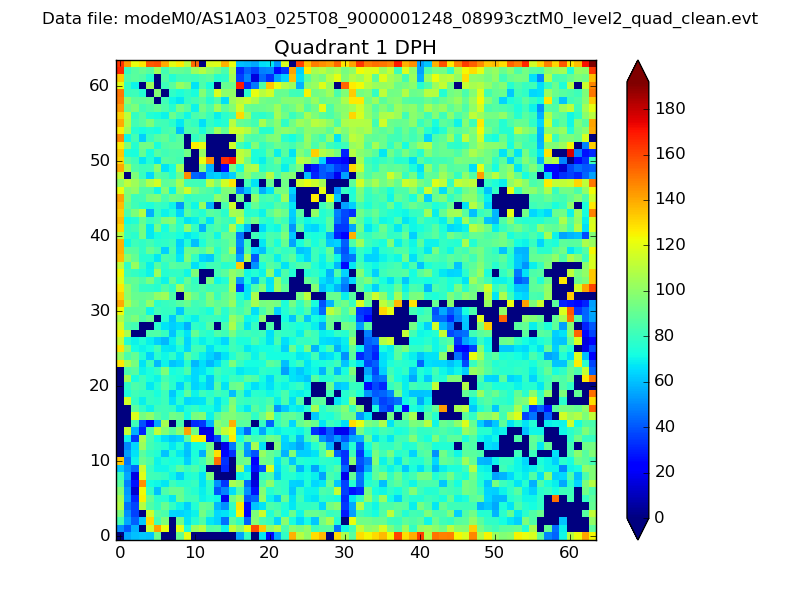
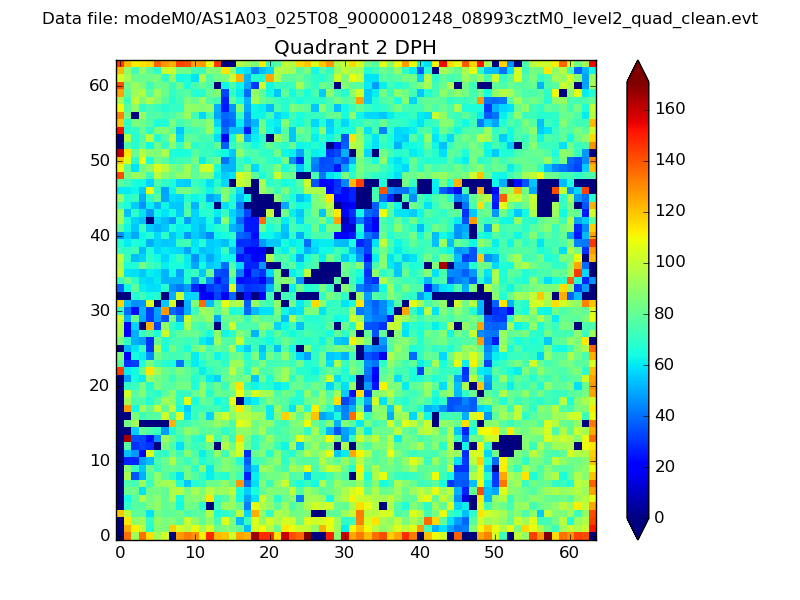
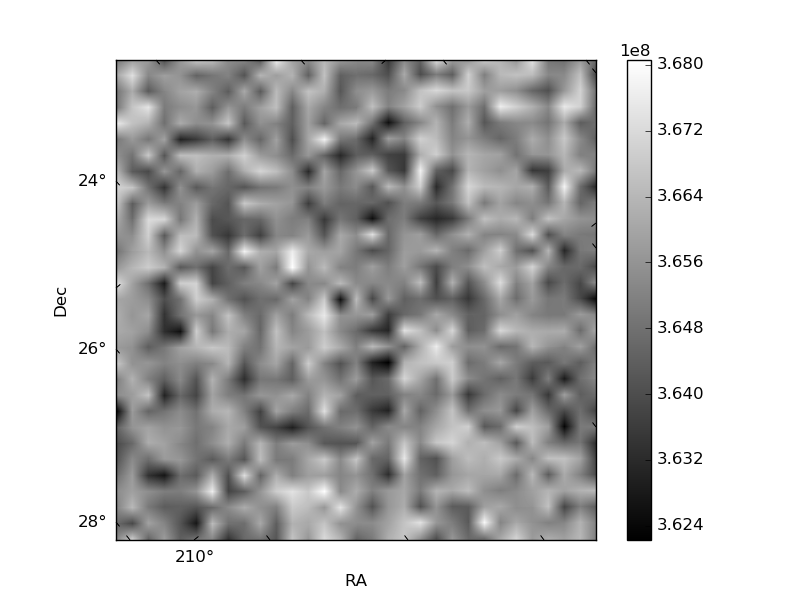
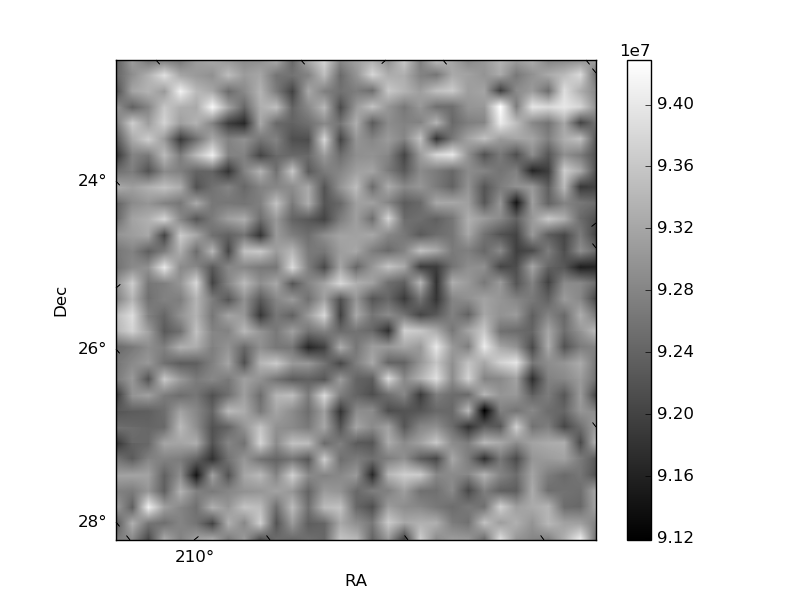
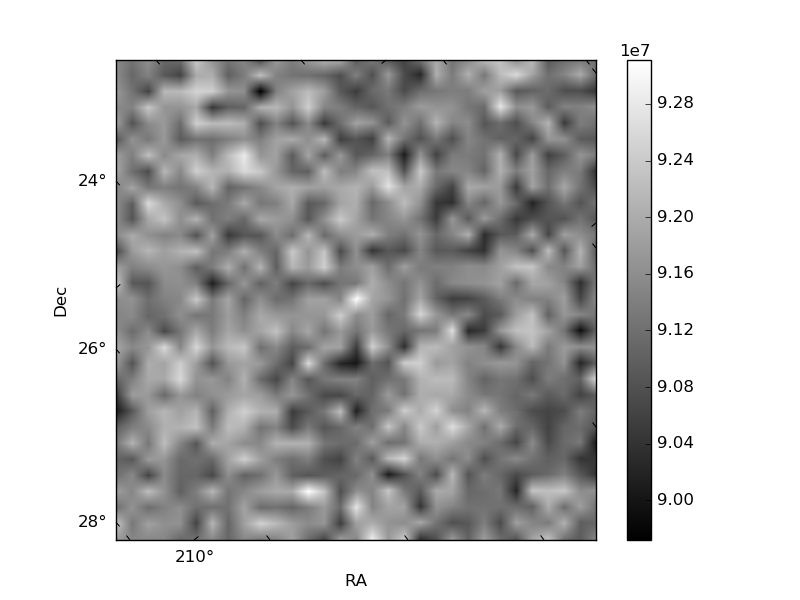
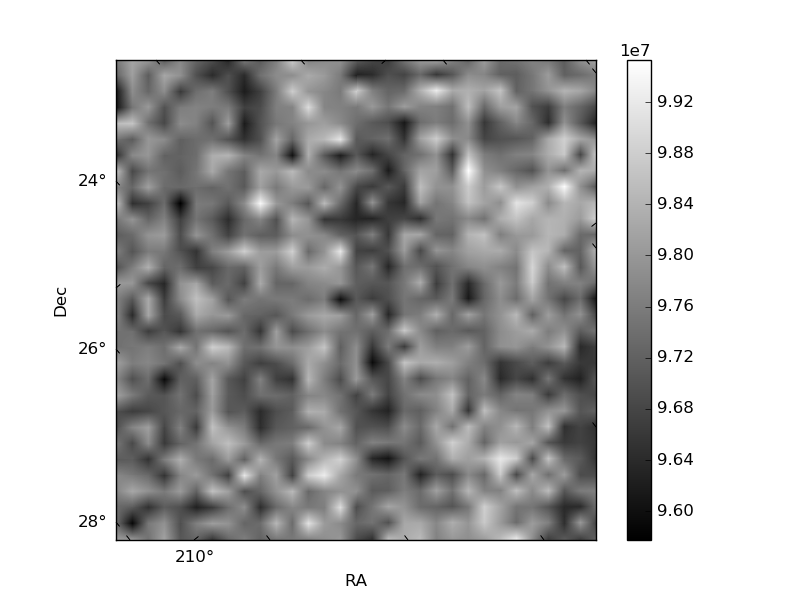
Histogram calculated using DETX and DETY for each event in the final _common_clean file
| Quadrant A | 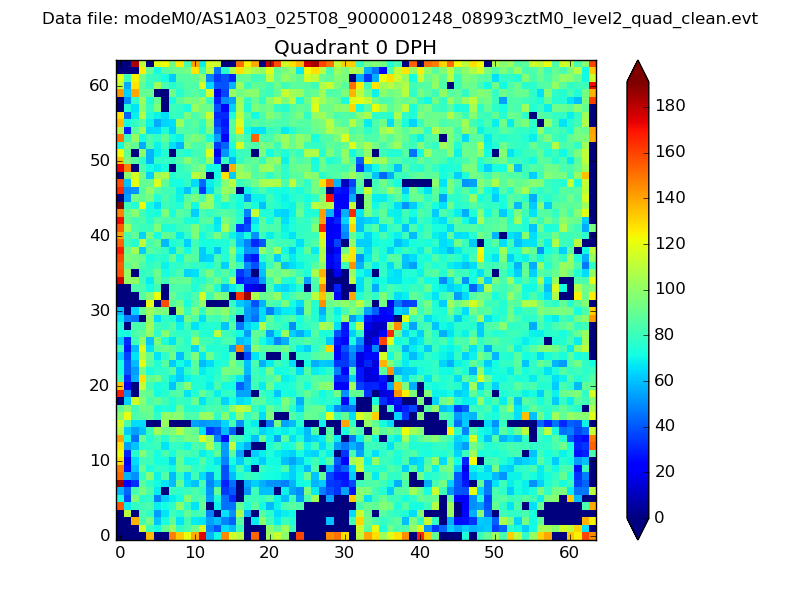 |
 |
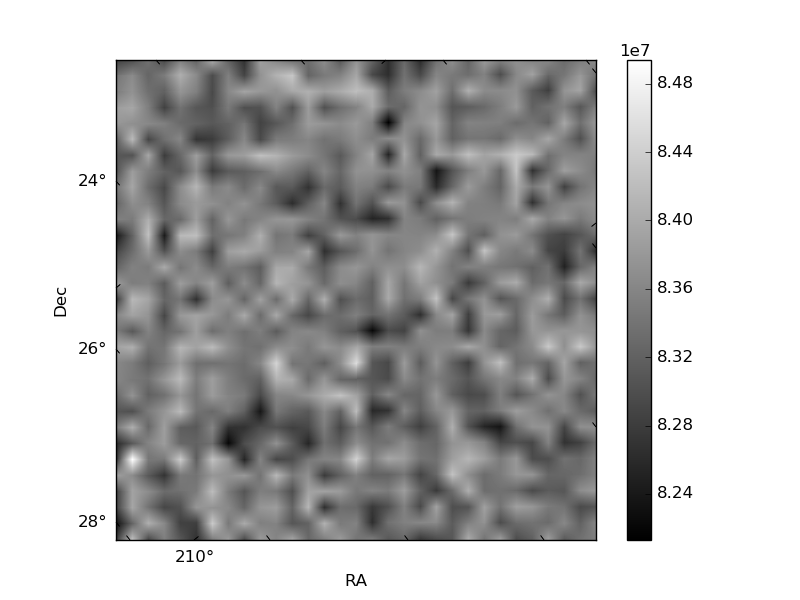
Quadrant B |
|---|---|---|---|
| Quadrant D | 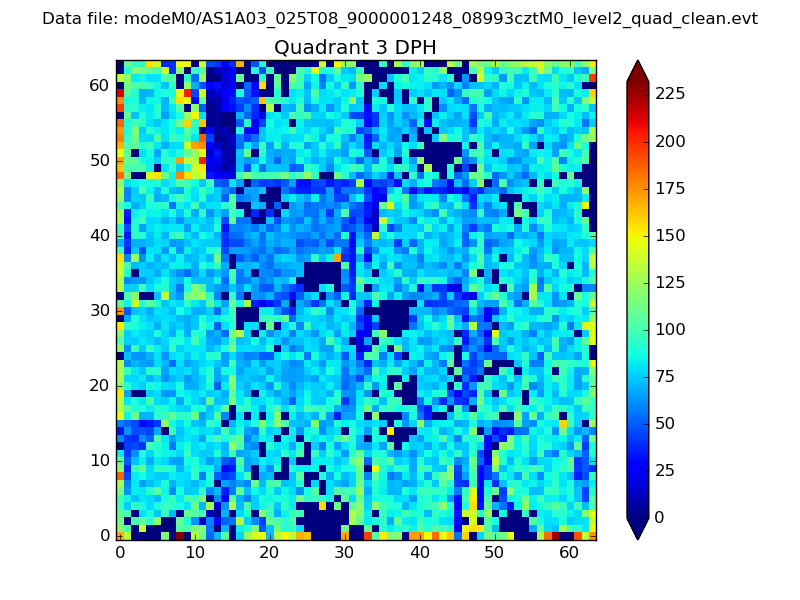 |
 |
Quadrant C |
| Plot type | Count rate plots | Images |
|---|---|---|
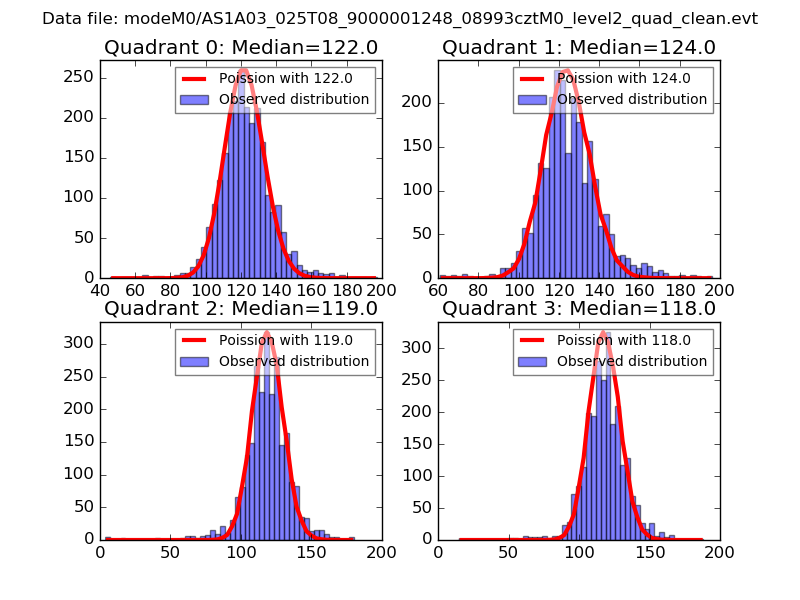
| Comparison with Poisson distribution Blue bars denote a histogram of data divided into 1 sec bins. Red curve is a Poisson curve with rate = median count rate of data. |
 |
 |
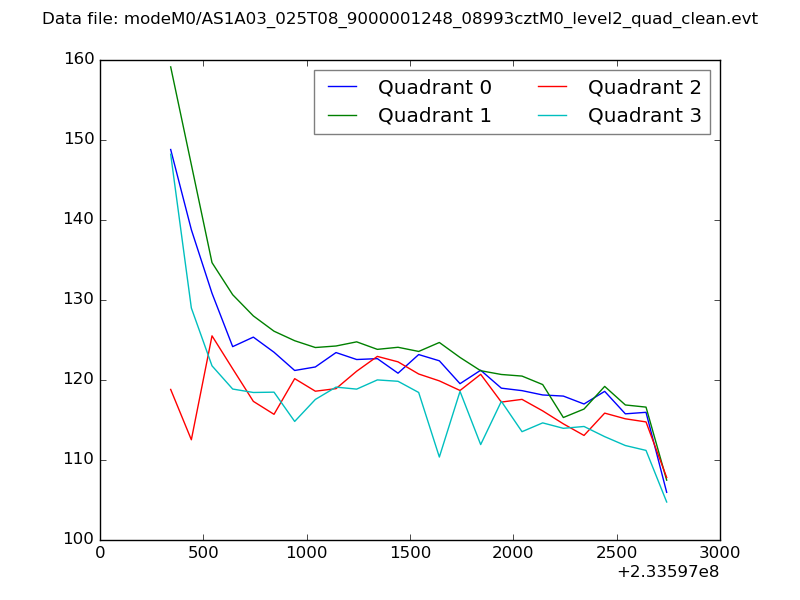
| Quadrant-wise count rates Data is divided into 100 sec bins |
 |
|
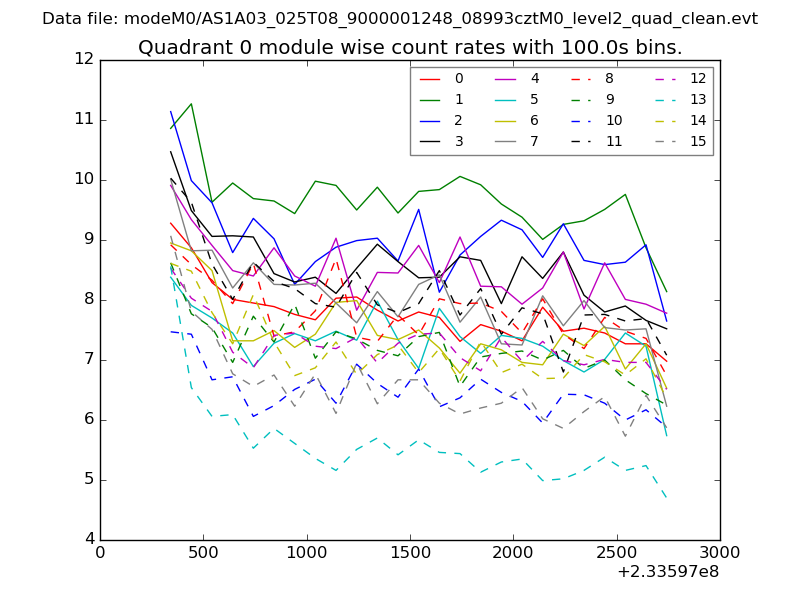
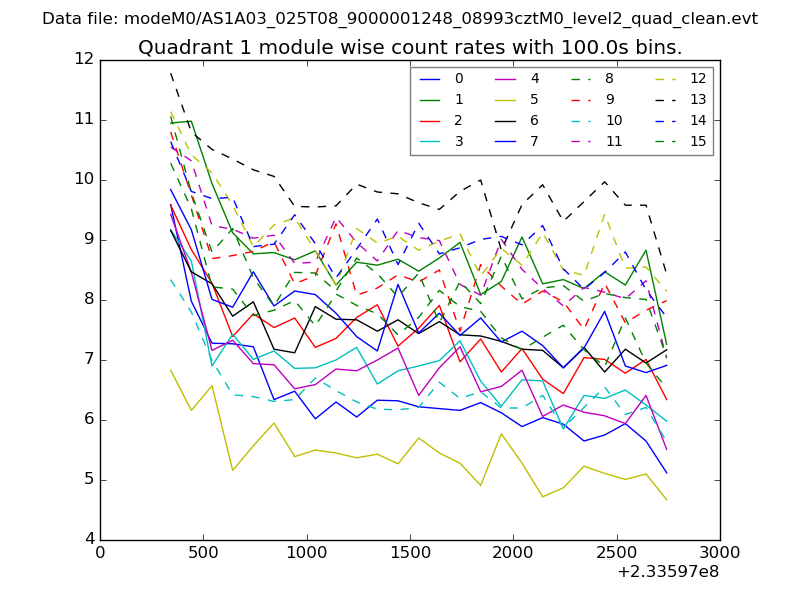
| Module-wise count rates for Quadrant A Data is divided into 100 sec bins |
 |
 |
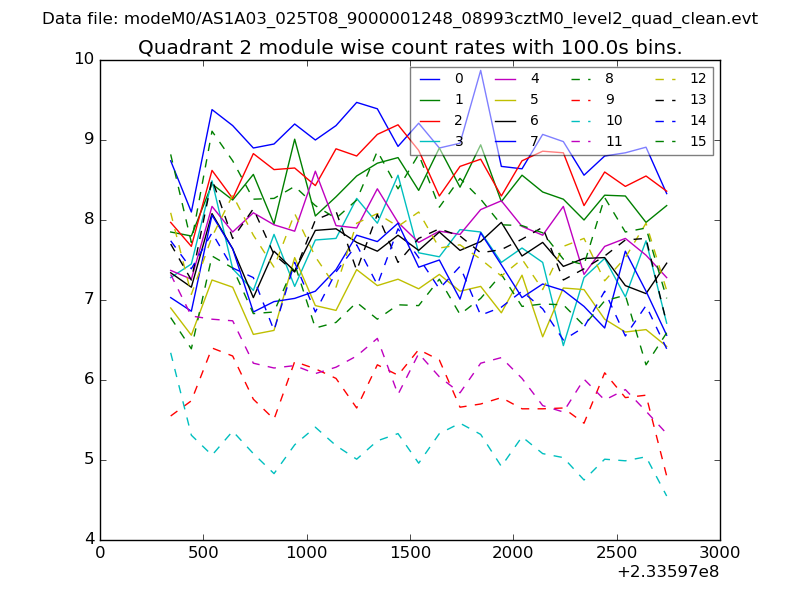
| Module-wise count rates for Quadrant B Data is divided into 100 sec bins |
 |
 |
| Module-wise count rates for Quadrant C Data is divided into 100 sec bins |
 |
 |
| Module-wise count rates for Quadrant D Data is divided into 100 sec bins |
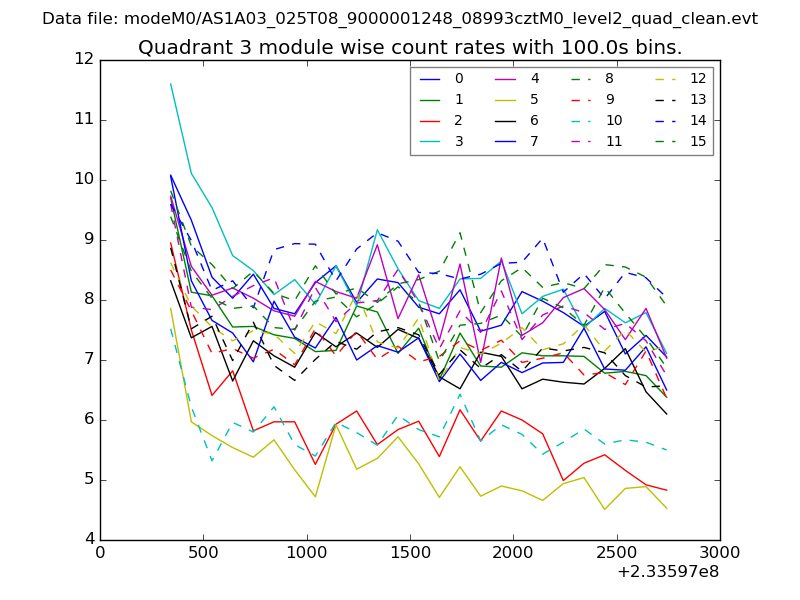 |
 |
| Parameter | Plot |
|---|---|
| CZT HV Monitor | 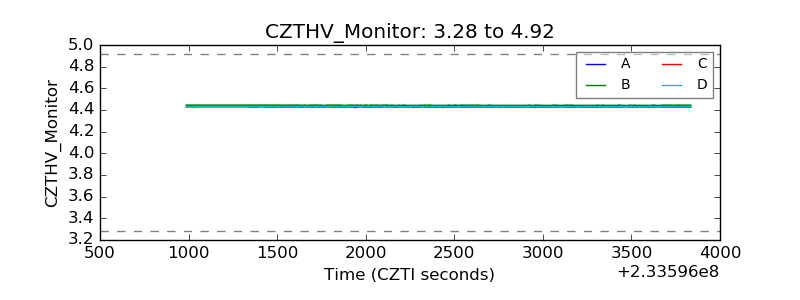 |
| D_VDD | 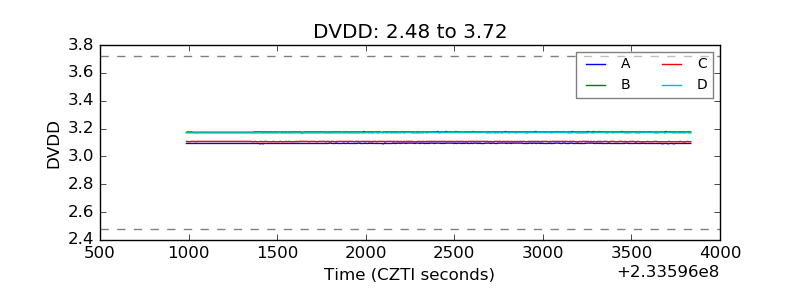 |
| Temperature 1 | 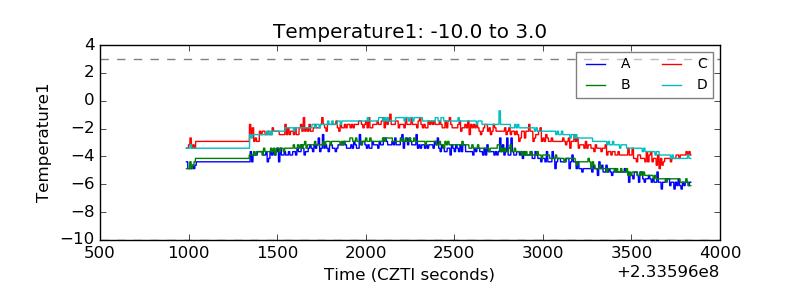 |
| Veto HV Monitor | 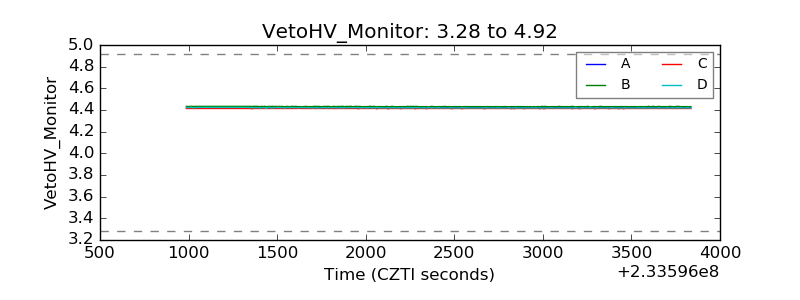 |
| Veto LLD | 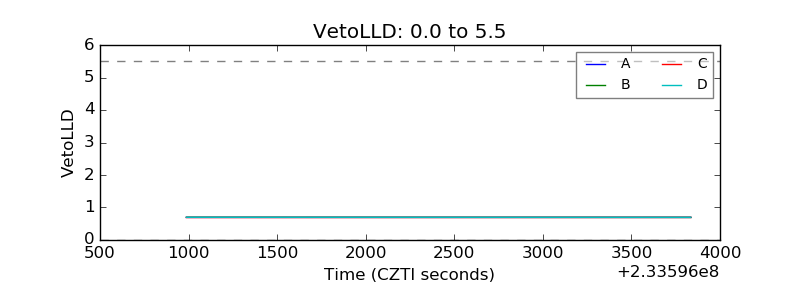 |
| Alpha Counter | 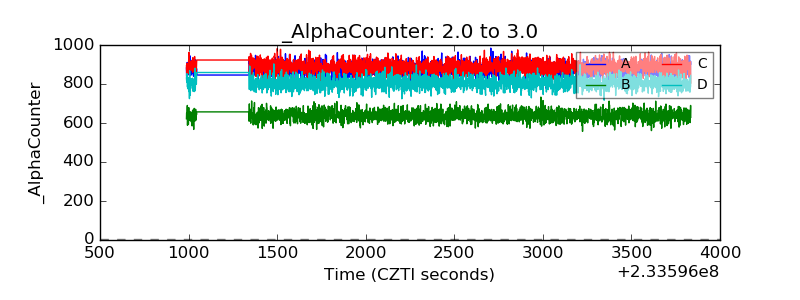 |
| _CPM_Rate | 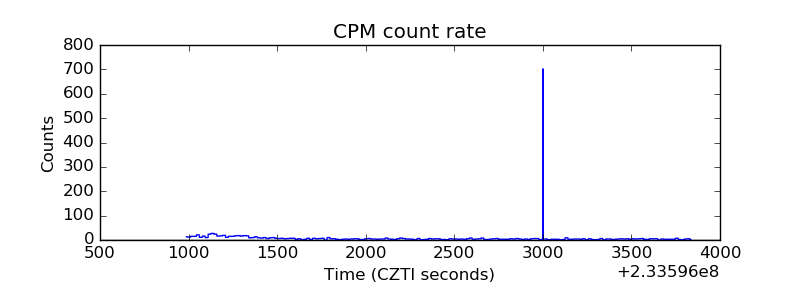 |
| CZT Counter | 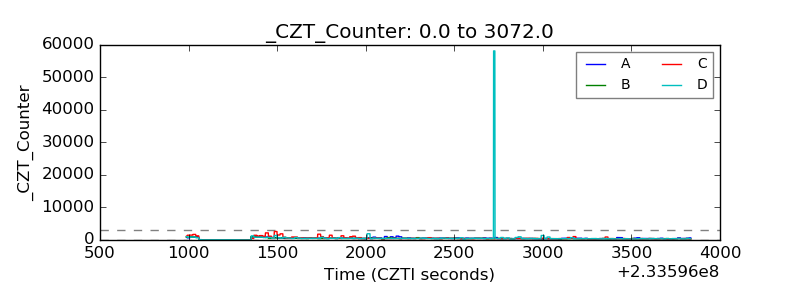 |
| +2.5 Volts monitor |  |
| +5 Volts monitor |  |
| _ROLL_ROT | 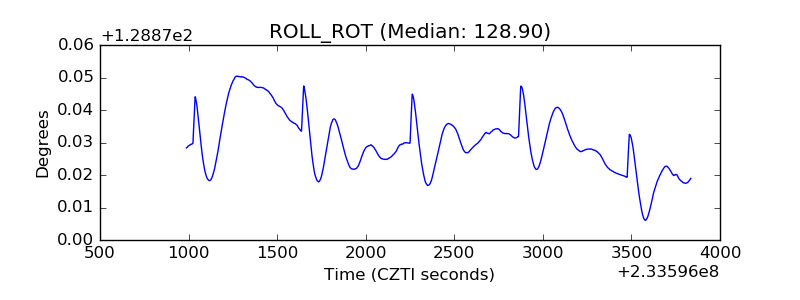 |
| _Roll_DEC | 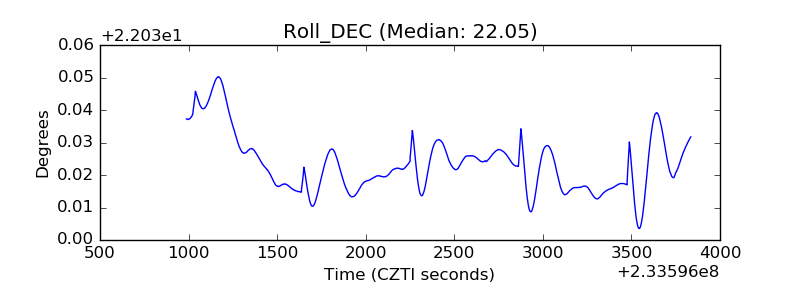 |
| _Roll_RA | 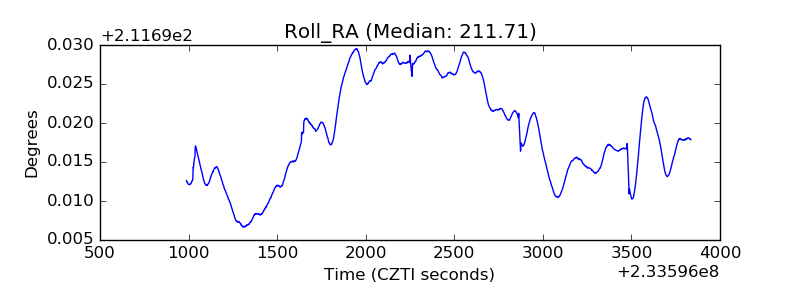 |
| Veto Counter | 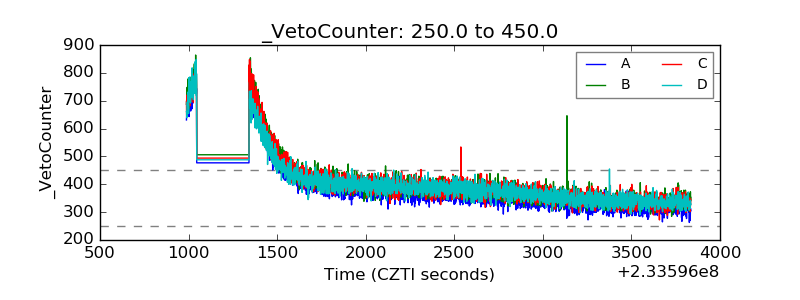 |