| Param | Original file | Final file |
|---|---|---|
| Filename | modeM0/AS1A03_107T01_9000001246cztM0_level2.fits | modeM0/AS1A03_107T01_9000001246cztM0_level2_quad_clean.evt |
| Size (bytes) | 298,408,320 | 315,167,040 |
| Size | 284.6 MB | 300.6 MB |
| Events in quadrant A | 1,817,832 | 1,995,521 |
| Events in quadrant B | 1,600,118 | 1,689,928 |
| Events in quadrant C | 1,775,854 | 1,858,362 |
| Events in quadrant D | 1,556,534 | 1,718,530 |
| Mode M9 | |||
|---|---|---|---|
| Quadrant | BADHDUFLAG | Total packets | Discarded packets |
| A | 0 | 38 | 0 |
| B | 0 | 38 | 0 |
| C | 0 | 38 | 0 |
| D | 0 | 38 | 0 |
| Mode M0 | |||
|---|---|---|---|
| Quadrant | BADHDUFLAG | Total packets | Discarded packets |
| A | 0 | 77573 | 0 |
| B | 0 | 128059 | 0 |
| C | 0 | 81680 | 0 |
| D | 0 | 79155 | 0 |
| Mode SS | |||
|---|---|---|---|
| Quadrant | BADHDUFLAG | Total packets | Discarded packets |
| A | 0 | 676 | 0 |
| B | 0 | 676 | 0 |
| C | 0 | 676 | 0 |
| D | 0 | 676 | 0 |
| Quadrant | Total seconds | Saturated seconds | Saturation percentage |
|---|---|---|---|
| A | 33215 | 1001 | 3.013699% |
| B | 33212 | 8079 | 24.325545% |
| C | 33213 | 1565 | 4.712010% |
| D | 33213 | 1087 | 3.272815% |
Noise dominated data is calculated using 1-second bins in cleaned event files. If a bin has >2000 counts, and if more than 50% of those come from <1% of pixels, then it is considered to be noise-dominated and hence unusable.
| Quadrant | # 1 sec bins | Bins with >0 counts | Bins with >2000 counts | High rate bins dominated by noise | Noise dominated (total time) | Noise dominated (detector-on time) | Marked lightcurve |
|---|---|---|---|---|---|---|---|
| A | 37002 | 33209 | 0 | 0 | 0.00% | 0.00% | 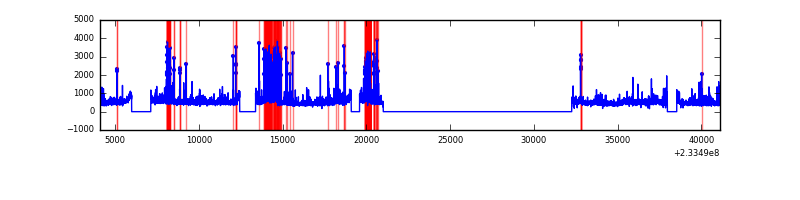 |
| B | 37002 | 33212 | 0 | 0 | 0.00% | 0.00% |  |
| C | 37002 | 33200 | 0 | 0 | 0.00% | 0.00% | 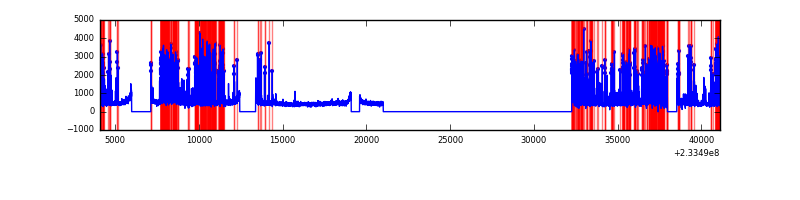 |
| D | 37002 | 33212 | 0 | 0 | 0.00% | 0.00% | 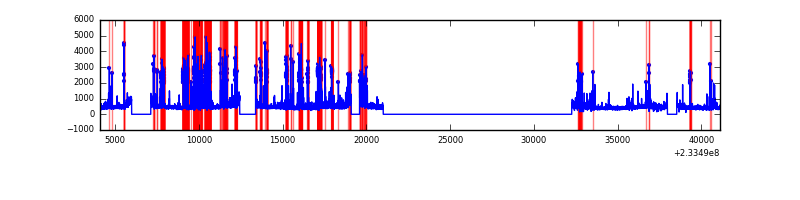 |
Top three noisy pixels from each quadrant. If the there are fewer than three noisy pixels in the level2.evt file, extra rows are filled as -1
| Pixel properties | Quadrant properties | ||||||
|---|---|---|---|---|---|---|---|
| Quadrant | DetID | PixID | Counts | Sigma | Mean | Median | Sigma |
| A | 0 | 29 | 1767 | 10.96 | 471 | 438 | 121.2 |
| A | 7 | 110 | 1478 | 8.57 | 471 | 438 | 121.2 |
| A | 0 | 30 | 1351 | 7.53 | 471 | 438 | 121.2 |
| B | 2 | 9 | 1371 | 11.11 | 421 | 400 | 87.4 |
| B | 14 | 254 | 1137 | 8.43 | 421 | 400 | 87.4 |
| B | 12 | 226 | 1113 | 8.16 | 421 | 400 | 87.4 |
| C | 1 | 81 | 1316 | 7.07 | 468 | 432 | 125.0 |
| C | 1 | 80 | 1268 | 6.69 | 468 | 432 | 125.0 |
| C | 12 | 241 | 1253 | 6.57 | 468 | 432 | 125.0 |
| D | 6 | 231 | 1146 | 6.15 | 443 | 403 | 120.9 |
| D | 3 | 31 | 1143 | 6.12 | 443 | 403 | 120.9 |
| D | 3 | 14 | 1126 | 5.98 | 443 | 403 | 120.9 |
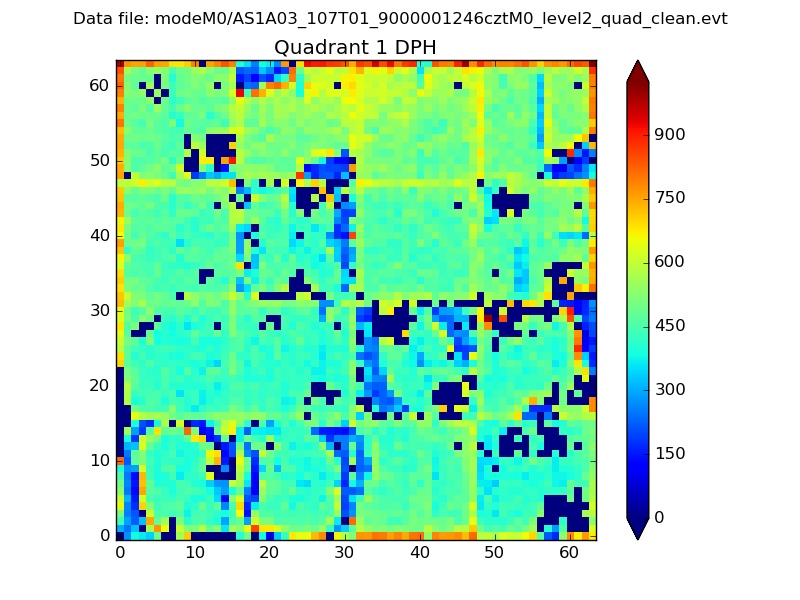
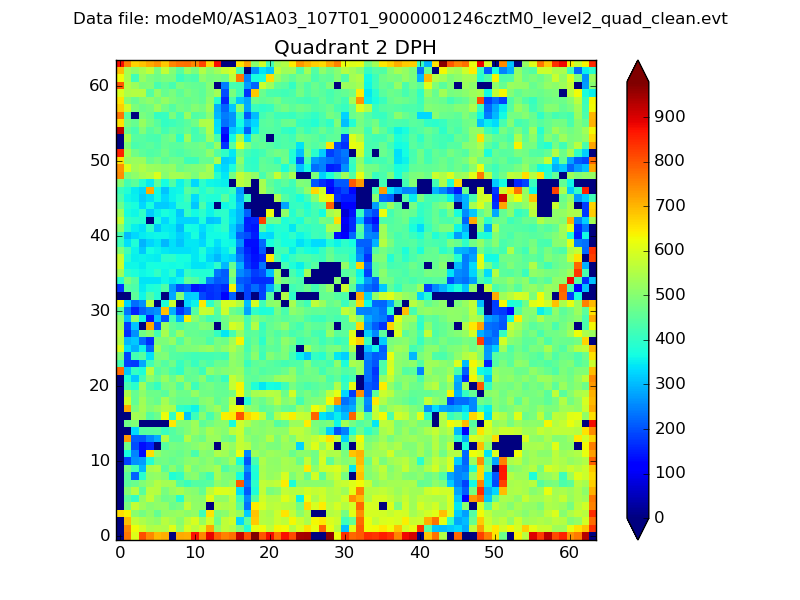
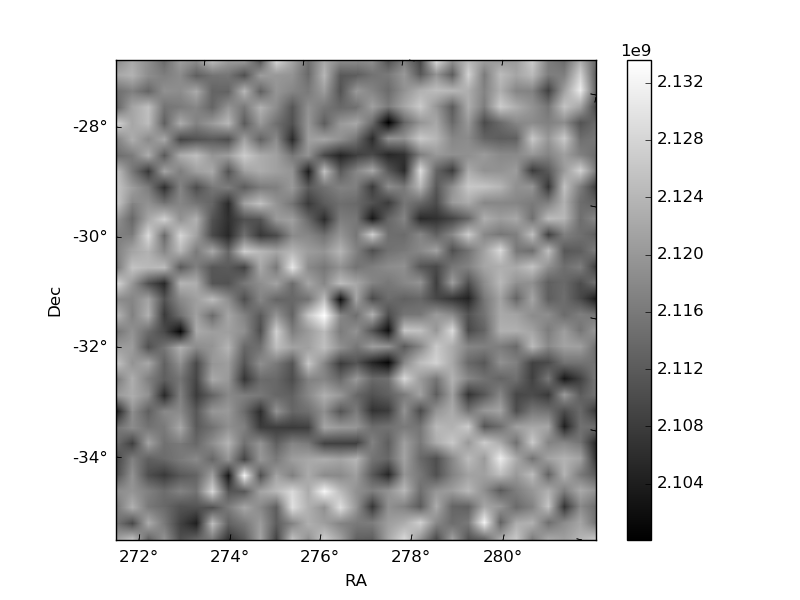
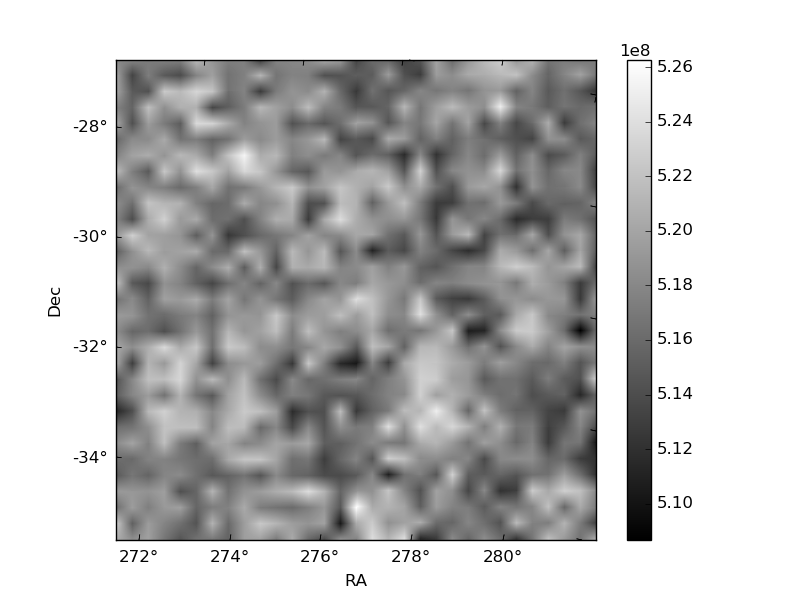
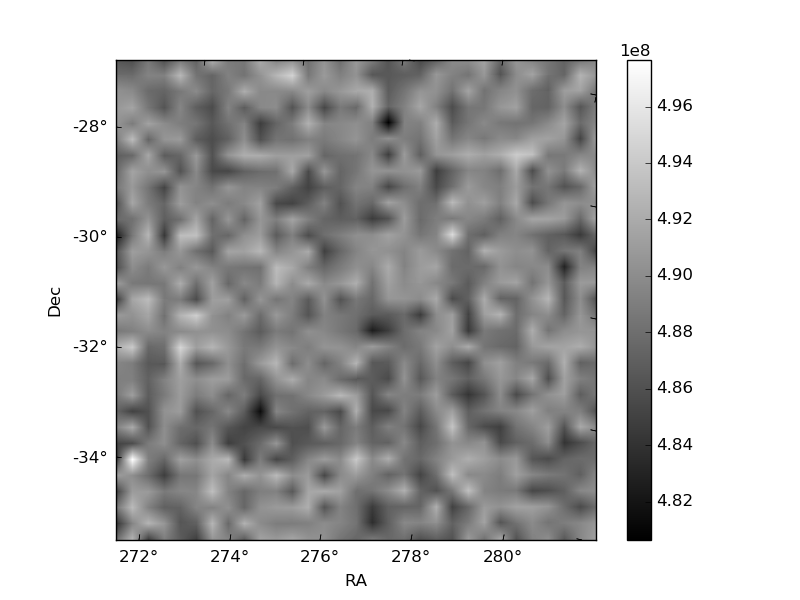
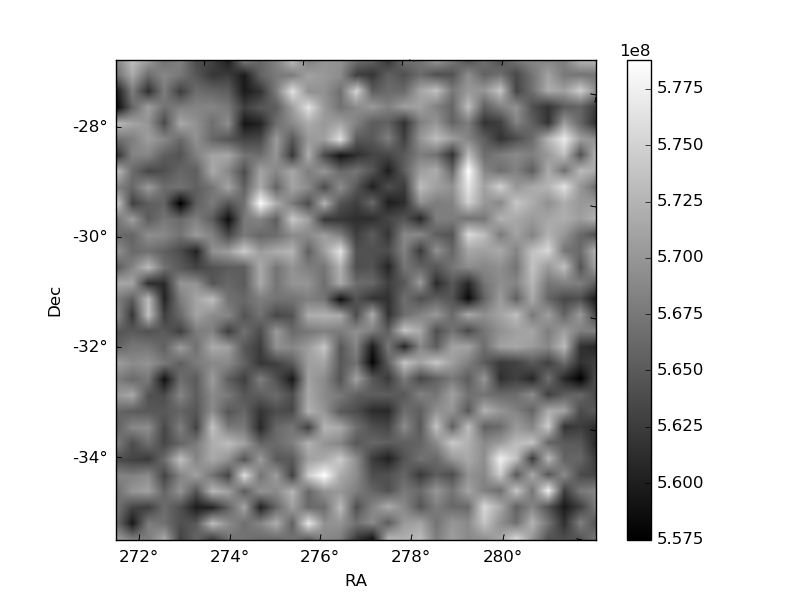
Histogram calculated using DETX and DETY for each event in the final _common_clean file
| Quadrant A | 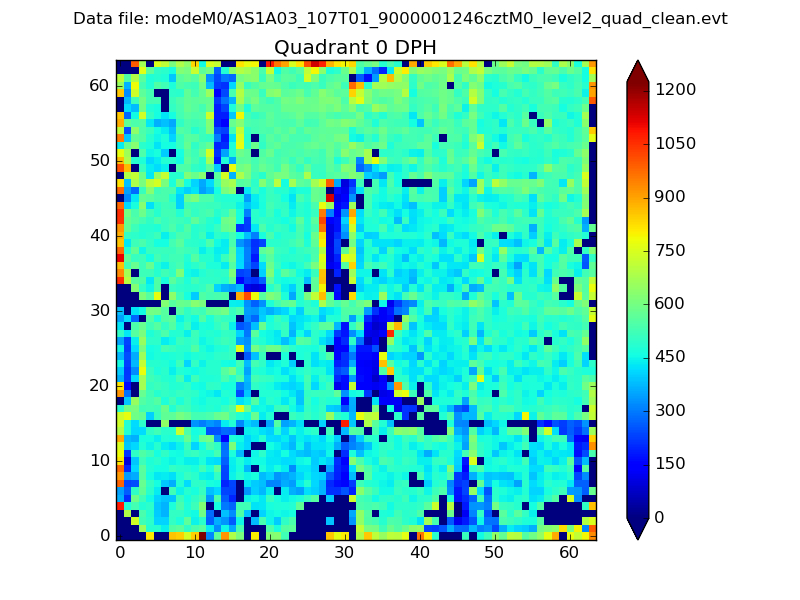 |
 |
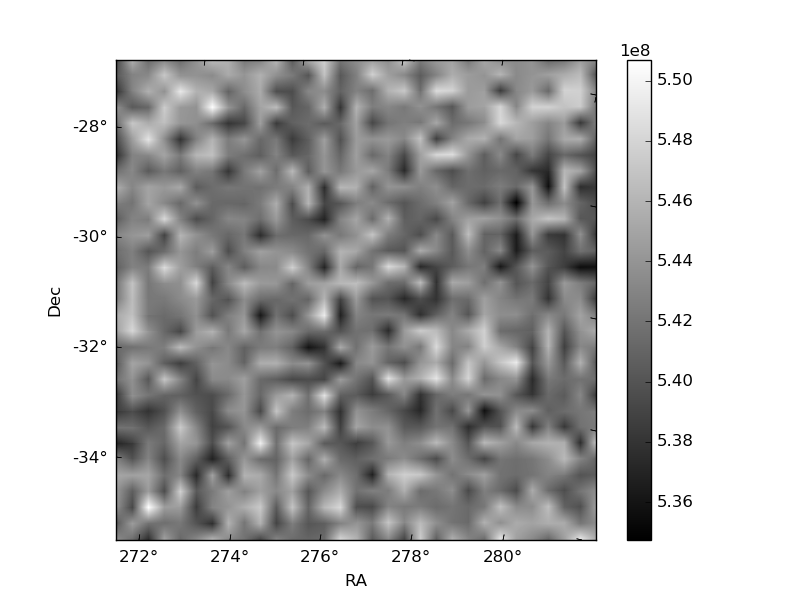
Quadrant B |
|---|---|---|---|
| Quadrant D | 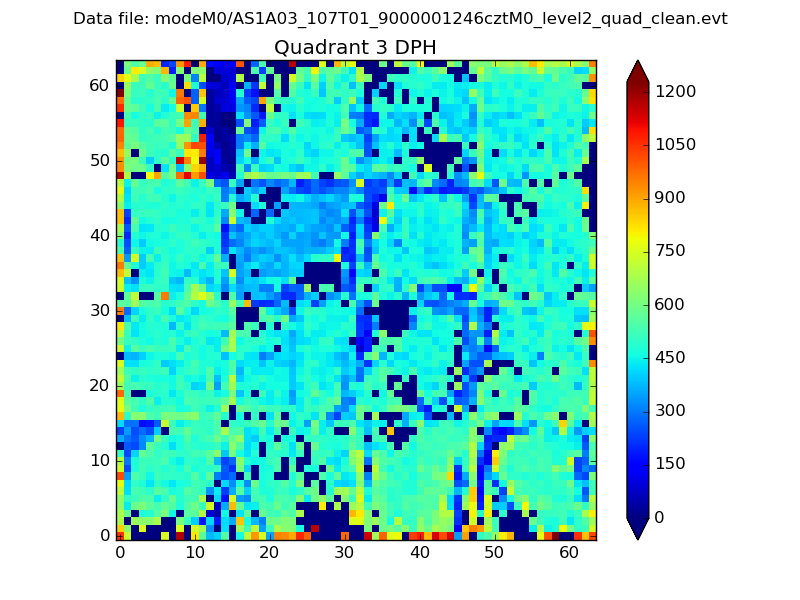 |
 |
Quadrant C |
| Plot type | Count rate plots | Images |
|---|---|---|
| Comparison with Poisson distribution Blue bars denote a histogram of data divided into 1 sec bins. Red curve is a Poisson curve with rate = median count rate of data. |
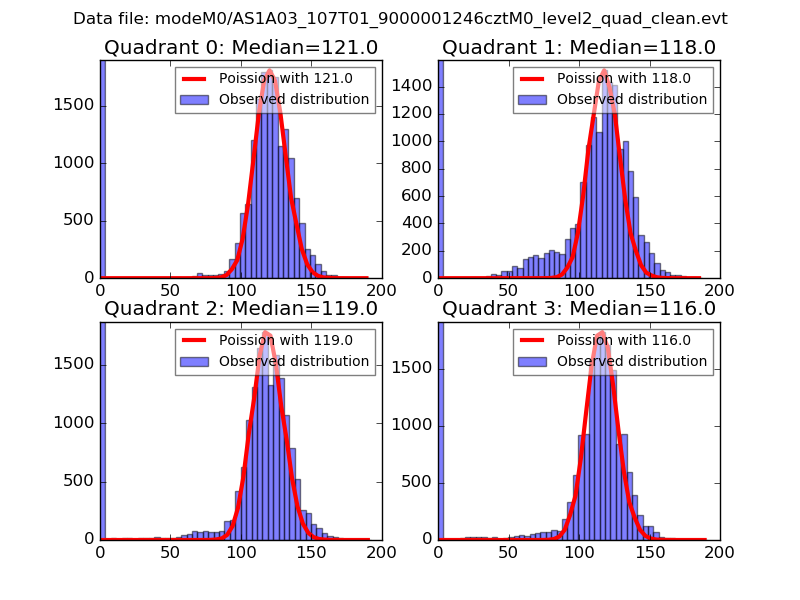 |
 |
| Quadrant-wise count rates Data is divided into 100 sec bins |
 |
|
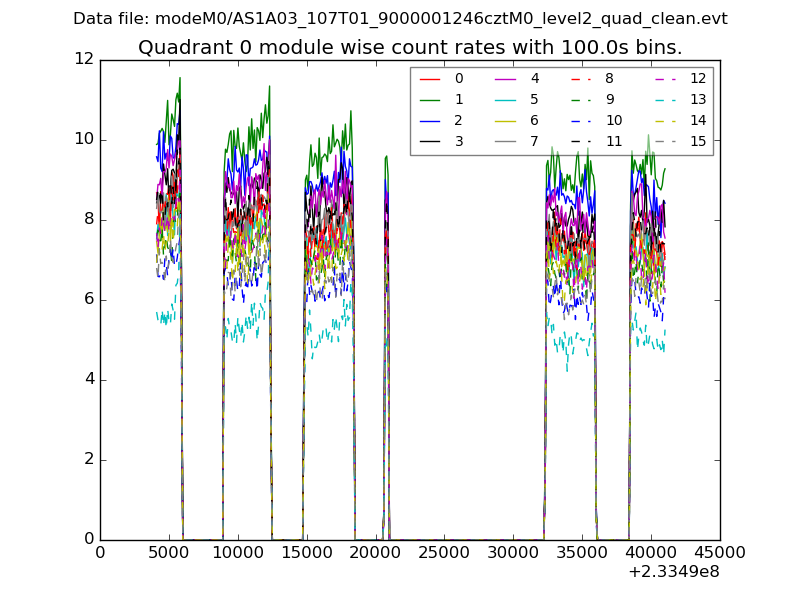
| Module-wise count rates for Quadrant A Data is divided into 100 sec bins |
 |
 |
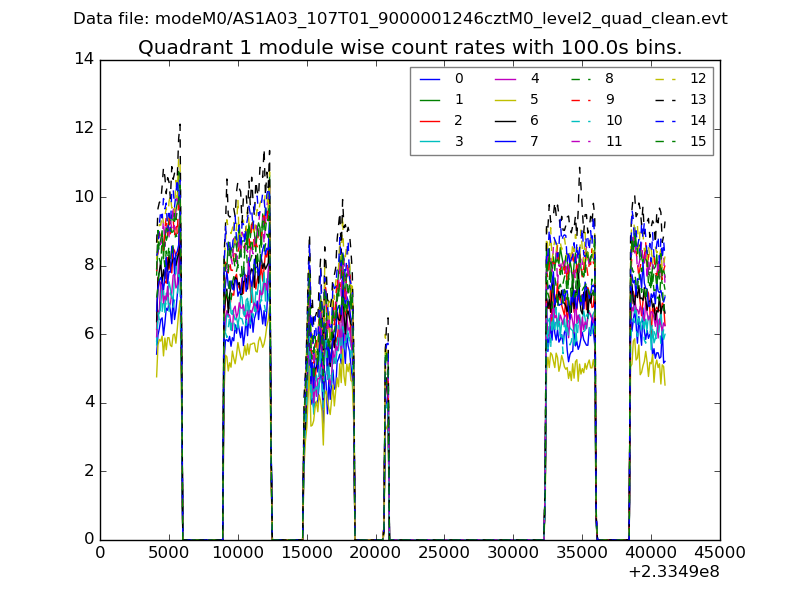
| Module-wise count rates for Quadrant B Data is divided into 100 sec bins |
 |
 |
| Module-wise count rates for Quadrant C Data is divided into 100 sec bins |
 |
 |
| Module-wise count rates for Quadrant D Data is divided into 100 sec bins |
 |
 |
| Parameter | Plot |
|---|---|
| CZT HV Monitor | 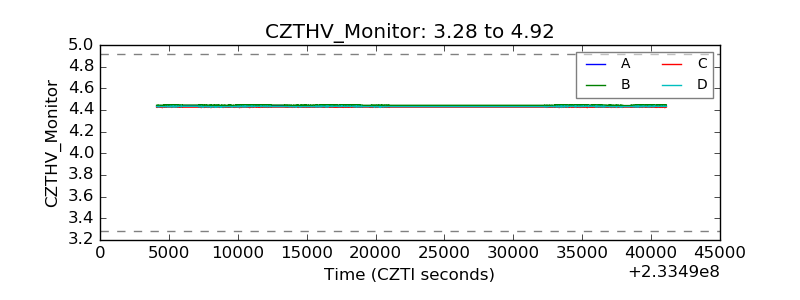 |
| D_VDD | 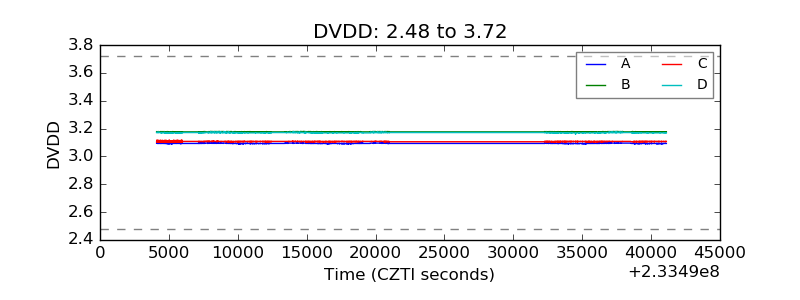 |
| Temperature 1 | 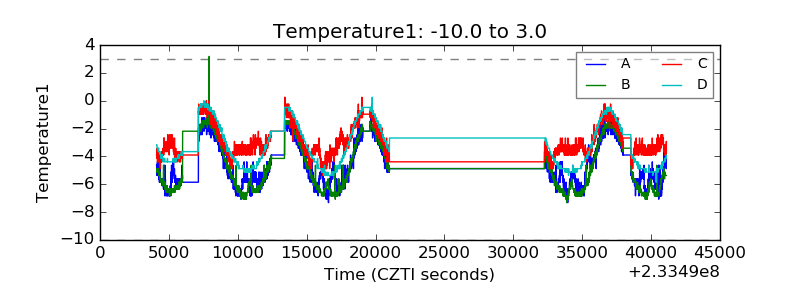 |
| Veto HV Monitor |  |
| Veto LLD | 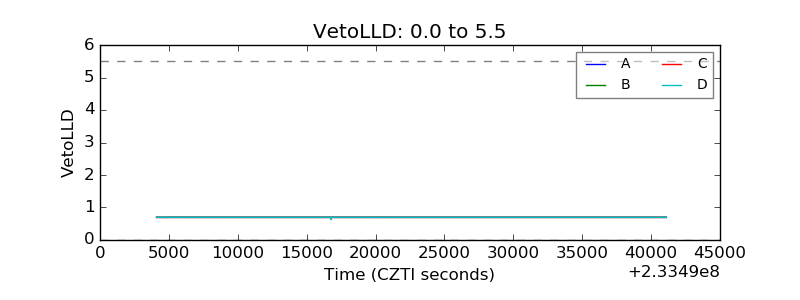 |
| Alpha Counter |  |
| _CPM_Rate | 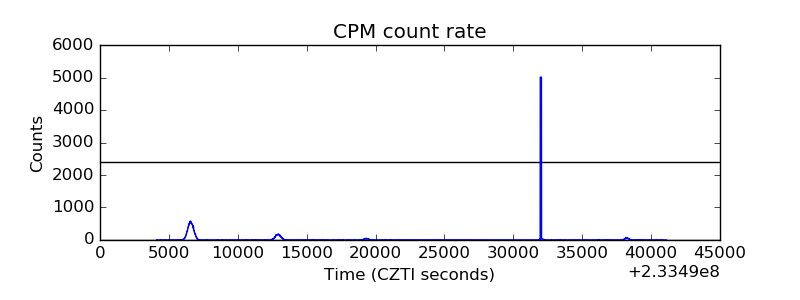 |
| CZT Counter | 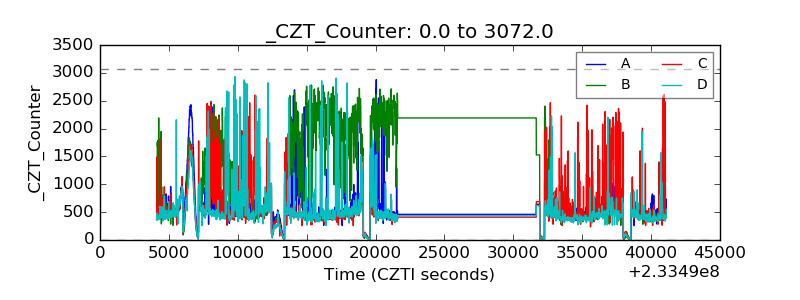 |
| +2.5 Volts monitor | 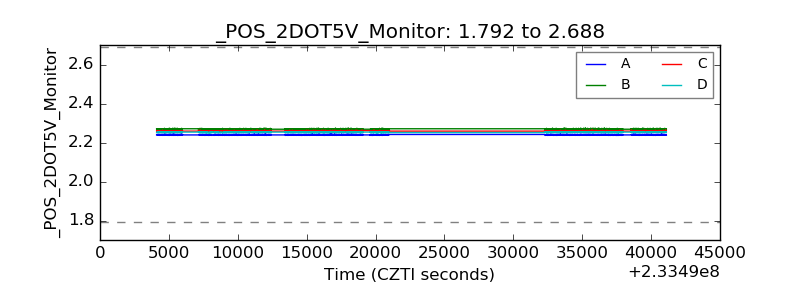 |
| +5 Volts monitor |  |
| _ROLL_ROT | 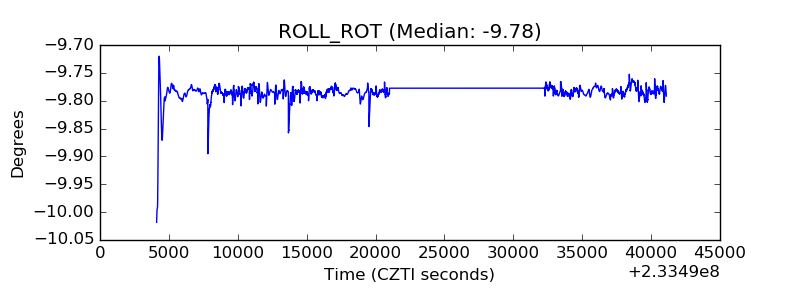 |
| _Roll_DEC | 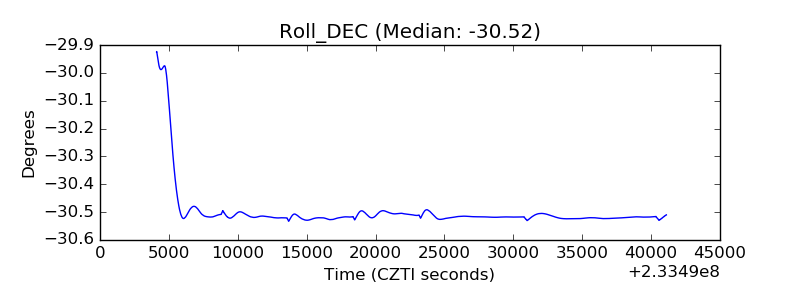 |
| _Roll_RA | 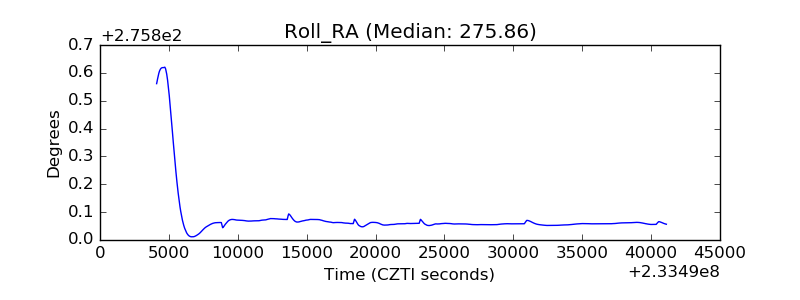 |
| Veto Counter |  |