| Param | Original file | Final file |
|---|---|---|
| Filename | modeM0/AS1A03_107T01_9000001246_08975cztM0_level2.evt | modeM0/AS1A03_107T01_9000001246_08975cztM0_level2_quad_clean.evt |
| Size (bytes) | 347,065,920 | 40,487,040 |
| Size | 331.0 MB | 38.6 MB |
| Events in quadrant A | 2,186,494 | 248,574 |
| Events in quadrant B | 3,474,586 | 248,024 |
| Events in quadrant C | 2,661,251 | 245,967 |
| Events in quadrant D | 1,955,385 | 240,326 |
| Mode M9 | |||
|---|---|---|---|
| Quadrant | BADHDUFLAG | Total packets | Discarded packets |
| A | 0 | 12 | 0 |
| B | 0 | 12 | 0 |
| C | 0 | 12 | 0 |
| D | 0 | 12 | 0 |
| Mode M0 | |||
|---|---|---|---|
| Quadrant | BADHDUFLAG | Total packets | Discarded packets |
| A | 0 | 8702 | 2 |
| B | 0 | 12621 | 1 |
| C | 0 | 10158 | 1 |
| D | 0 | 8073 | 1 |
| Mode SS | |||
|---|---|---|---|
| Quadrant | BADHDUFLAG | Total packets | Discarded packets |
| A | 0 | 68 | 0 |
| B | 0 | 68 | 0 |
| C | 0 | 68 | 0 |
| D | 0 | 68 | 0 |
| Quadrant | Total seconds | Saturated seconds | Saturation percentage |
|---|---|---|---|
| A | 3430 | 203 | 5.918367% |
| B | 3430 | 586 | 17.084548% |
| C | 3430 | 308 | 8.979592% |
| D | 3430 | 160 | 4.664723% |
Noise dominated data is calculated using 1-second bins in cleaned event files. If a bin has >2000 counts, and if more than 50% of those come from <1% of pixels, then it is considered to be noise-dominated and hence unusable.
| Quadrant | # 1 sec bins | Bins with >0 counts | Bins with >2000 counts | High rate bins dominated by noise | Noise dominated (total time) | Noise dominated (detector-on time) | Marked lightcurve |
|---|---|---|---|---|---|---|---|
| A | 4575 | 3430 | 45 | 45 | 0.98% | 1.31% | 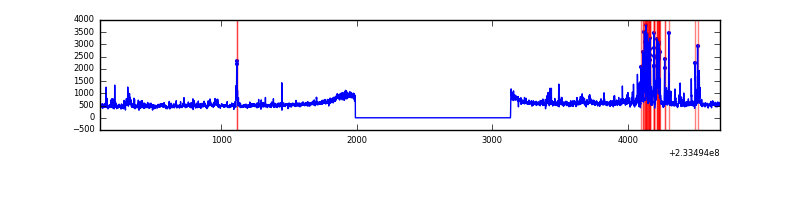 |
| B | 4575 | 3430 | 280 | 280 | 6.12% | 8.16% | 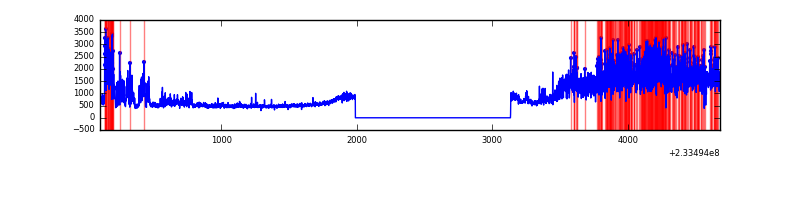 |
| C | 4575 | 3431 | 172 | 172 | 3.76% | 5.01% | 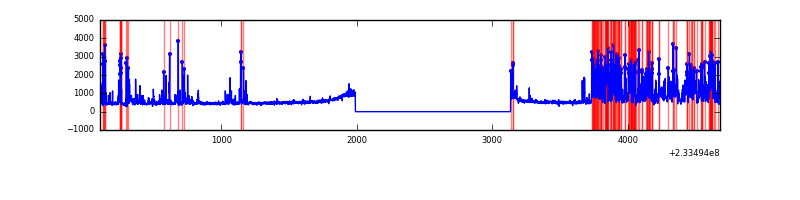 |
| D | 4575 | 3430 | 58 | 58 | 1.27% | 1.69% | 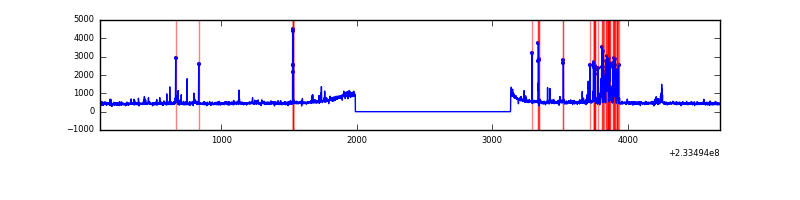 |
Top three noisy pixels from each quadrant. If the there are fewer than three noisy pixels in the level2.evt file, extra rows are filled as -1
| Pixel properties | Quadrant properties | ||||||
|---|---|---|---|---|---|---|---|
| Quadrant | DetID | PixID | Counts | Sigma | Mean | Median | Sigma |
| A | 5 | 16 | 238644 | 2569.16 | 443 | 432 | 92.7 |
| A | 8 | 5 | 169356 | 1821.88 | 443 | 432 | 92.7 |
| A | 13 | 251 | 68478 | 733.89 | 443 | 432 | 92.7 |
| B | 0 | 85 | 1730211 | 20126.04 | 435 | 425 | 85.9 |
| B | 0 | 214 | 38595 | 444.11 | 435 | 425 | 85.9 |
| B | 12 | 111 | 8482 | 93.74 | 435 | 425 | 85.9 |
| C | 4 | 254 | 999501 | 10071.57 | 423 | 426 | 99.2 |
| C | 8 | 128 | 3469 | 30.68 | 423 | 426 | 99.2 |
| C | 13 | 61 | 3197 | 27.93 | 423 | 426 | 99.2 |
| D | 12 | 233 | 158272 | 1456.13 | 434 | 420 | 108.4 |
| D | 1 | 52 | 60282 | 552.2 | 434 | 420 | 108.4 |
| D | 7 | 71 | 29155 | 265.07 | 434 | 420 | 108.4 |
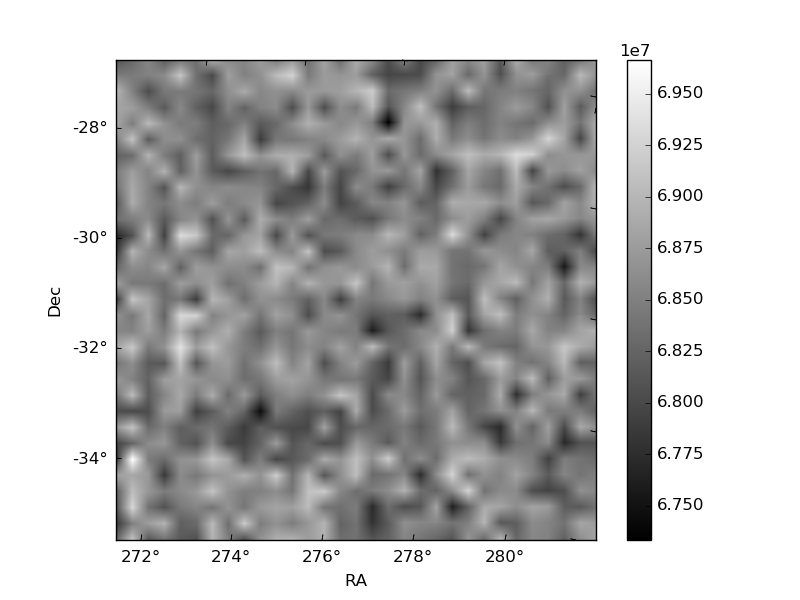
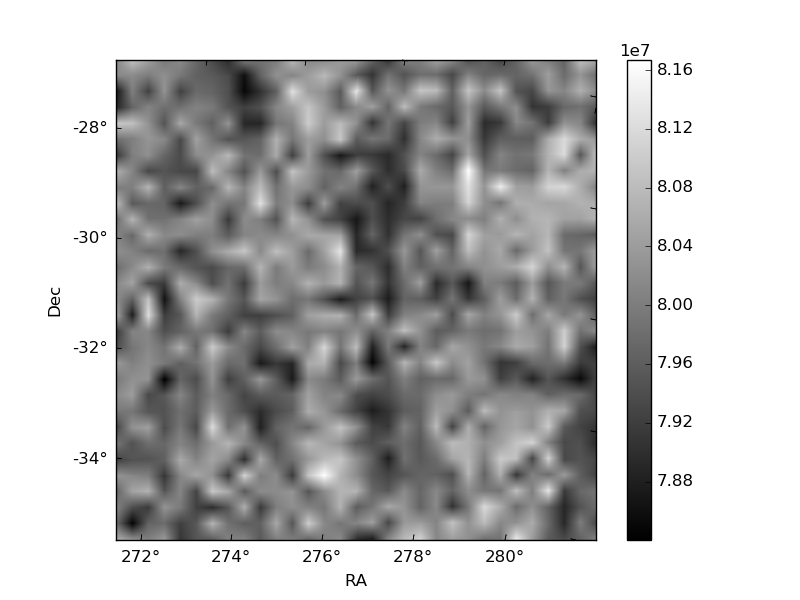
Histogram calculated using DETX and DETY for each event in the final _common_clean file
| Quadrant A | 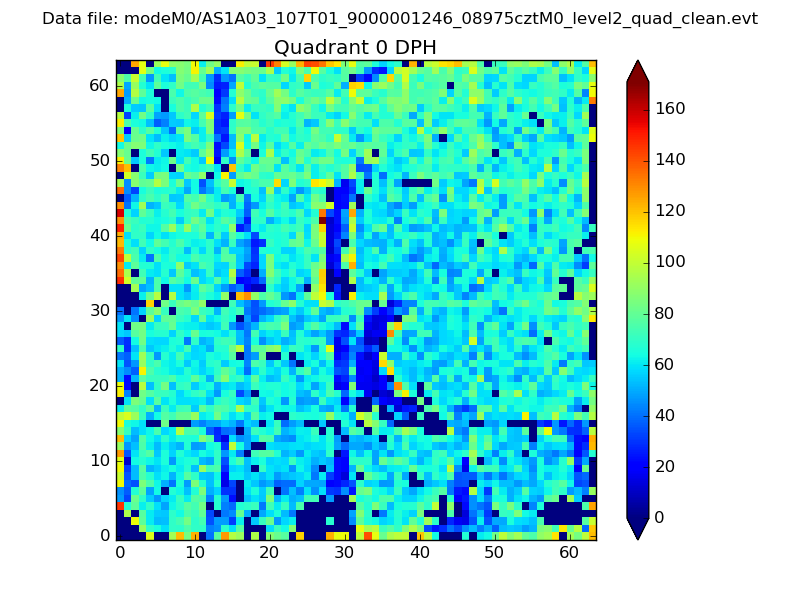 |
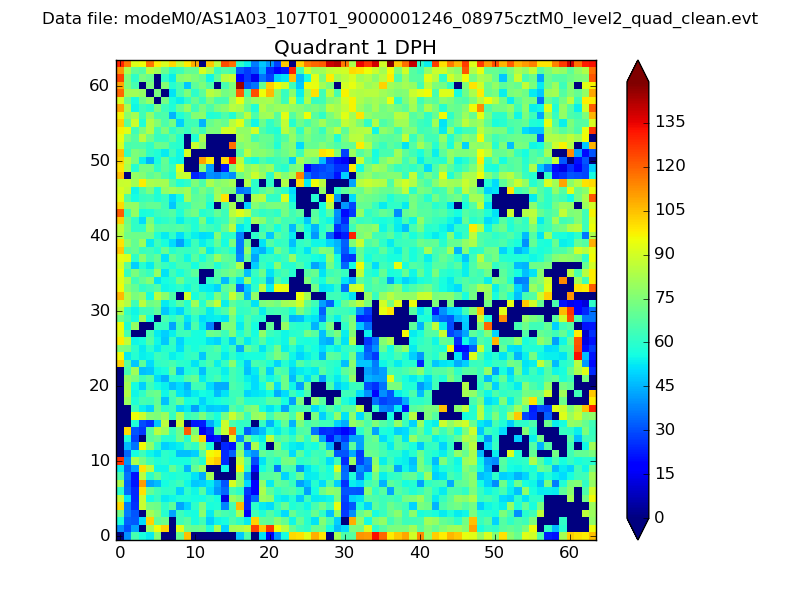 |
Quadrant B |
|---|---|---|---|
| Quadrant D | 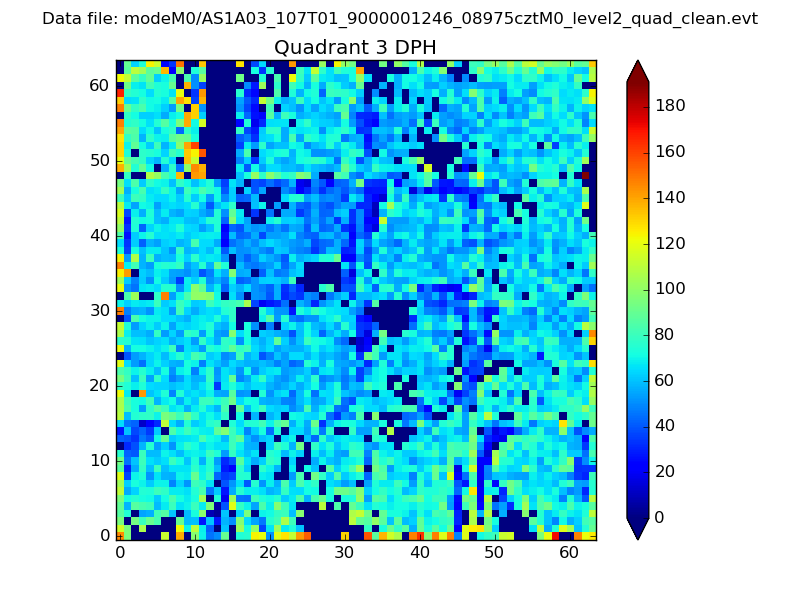 |
 |
Quadrant C |
| Plot type | Count rate plots | Images |
|---|---|---|
| Comparison with Poisson distribution Blue bars denote a histogram of data divided into 1 sec bins. Red curve is a Poisson curve with rate = median count rate of data. |
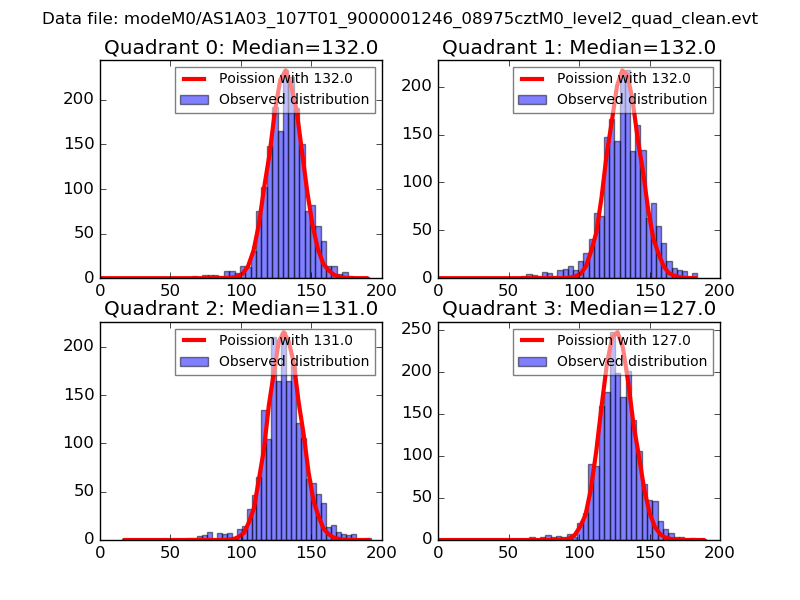 |
 |
| Quadrant-wise count rates Data is divided into 100 sec bins |
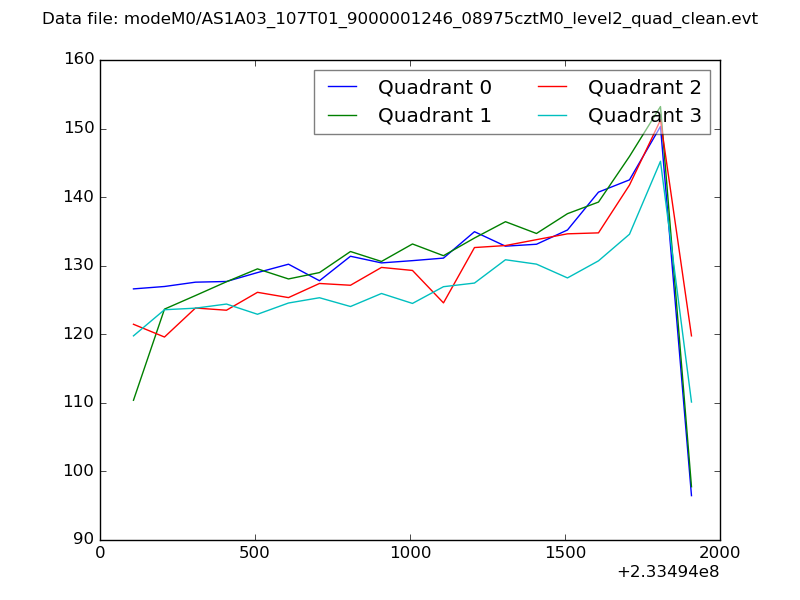 |
|
| Module-wise count rates for Quadrant A Data is divided into 100 sec bins |
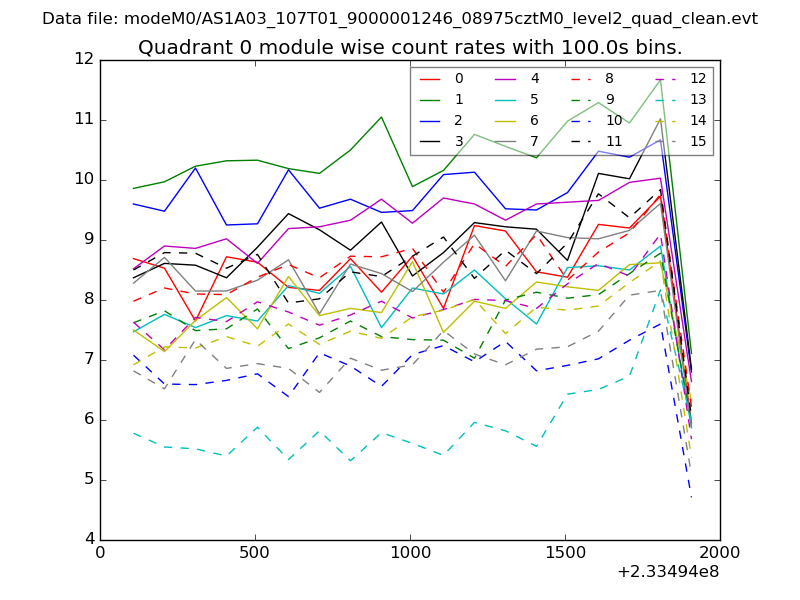 |
 |
| Module-wise count rates for Quadrant B Data is divided into 100 sec bins |
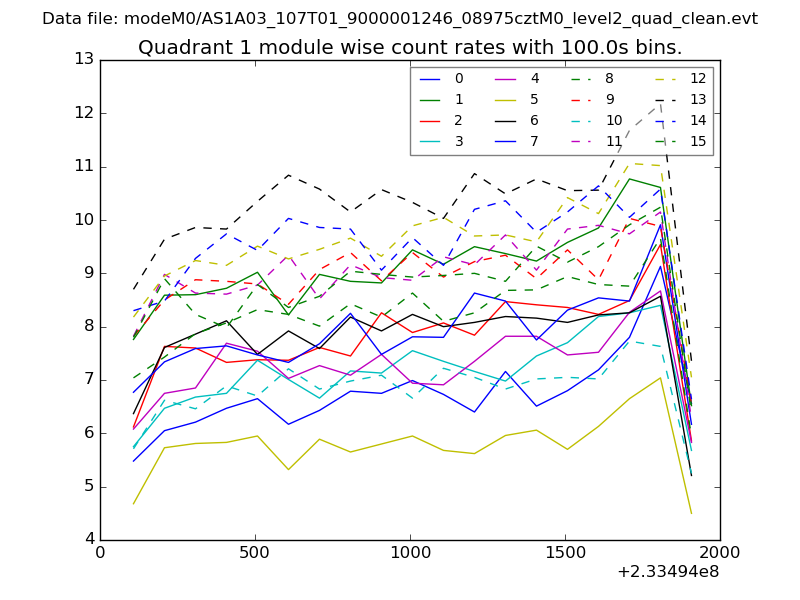 |
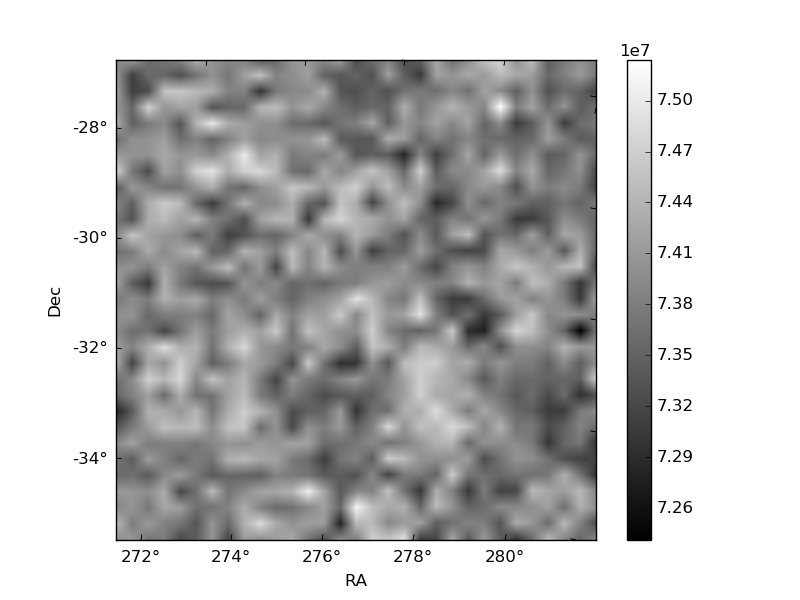 |
| Module-wise count rates for Quadrant C Data is divided into 100 sec bins |
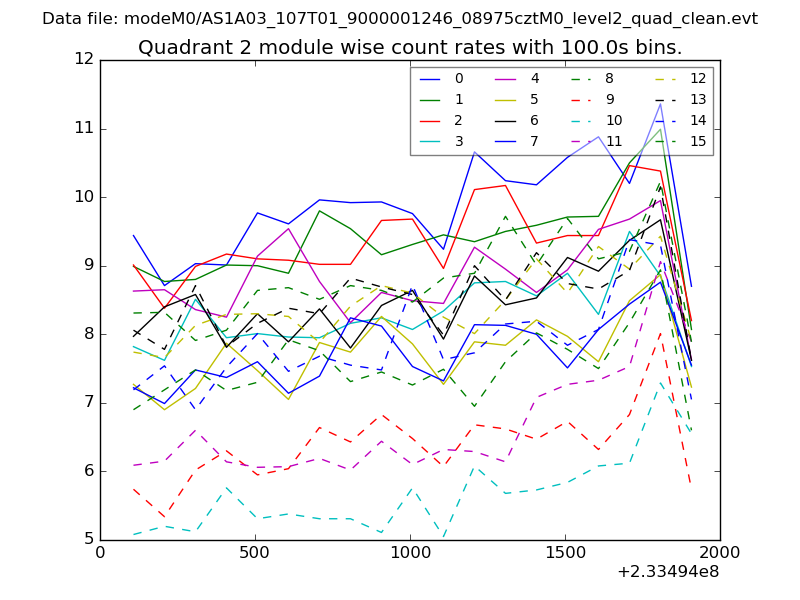 |
 |
| Module-wise count rates for Quadrant D Data is divided into 100 sec bins |
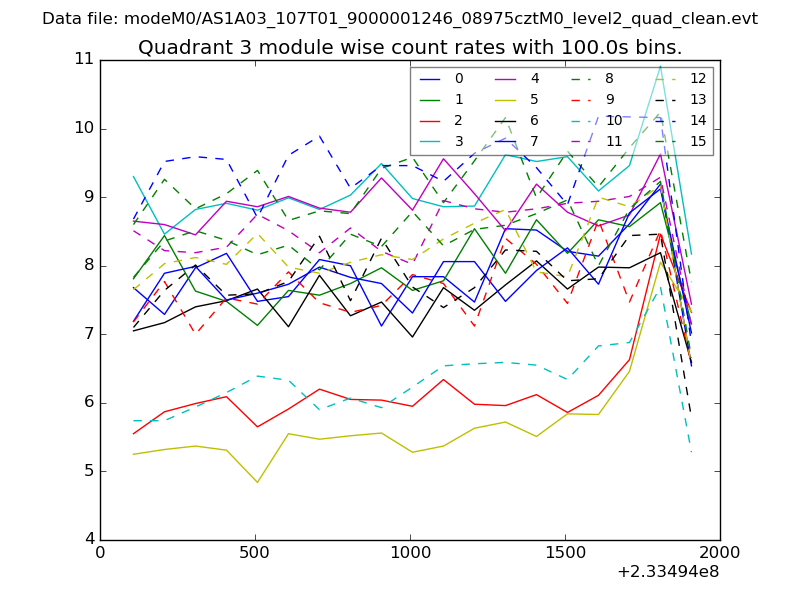 |
 |
| Parameter | Plot |
|---|---|
| CZT HV Monitor | 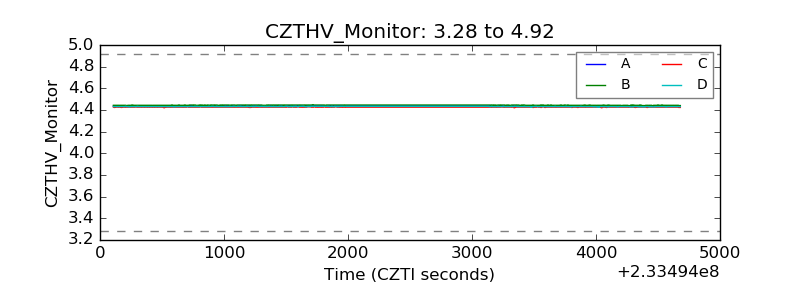 |
| D_VDD |  |
| Temperature 1 | 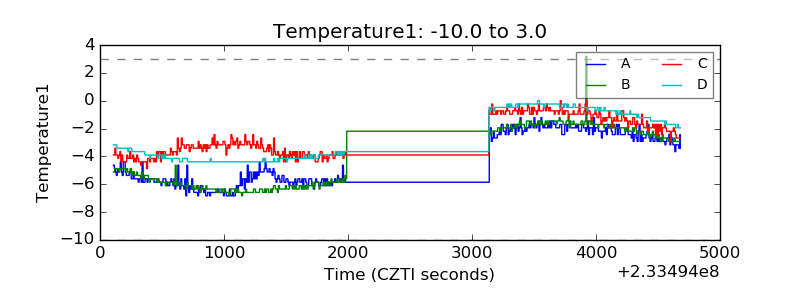 |
| Veto HV Monitor | 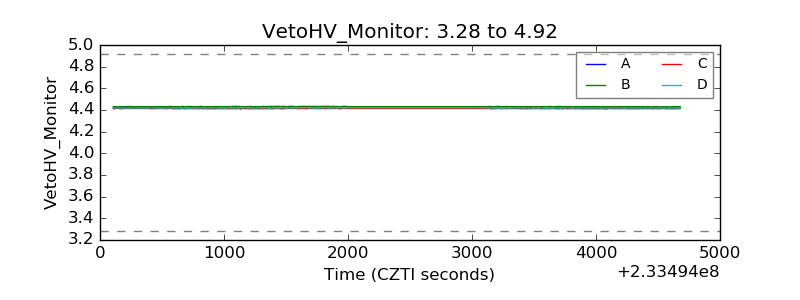 |
| Veto LLD | 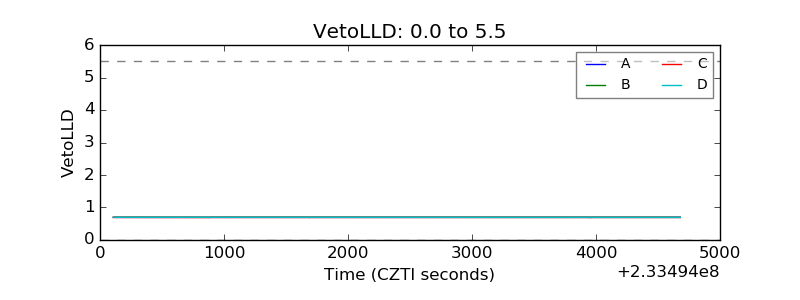 |
| Alpha Counter | 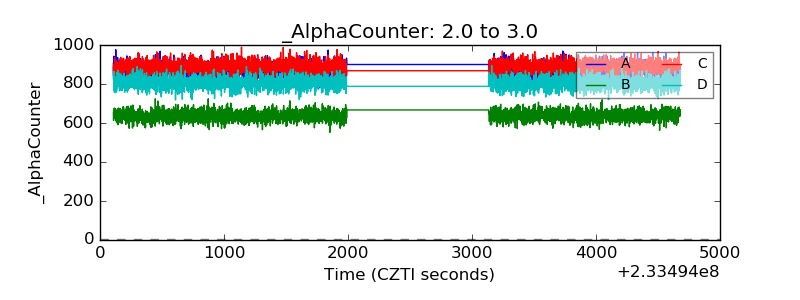 |
| _CPM_Rate | 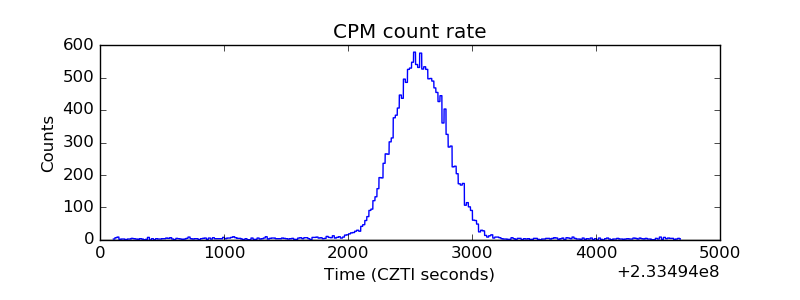 |
| CZT Counter |  |
| +2.5 Volts monitor |  |
| +5 Volts monitor |  |
| _ROLL_ROT | 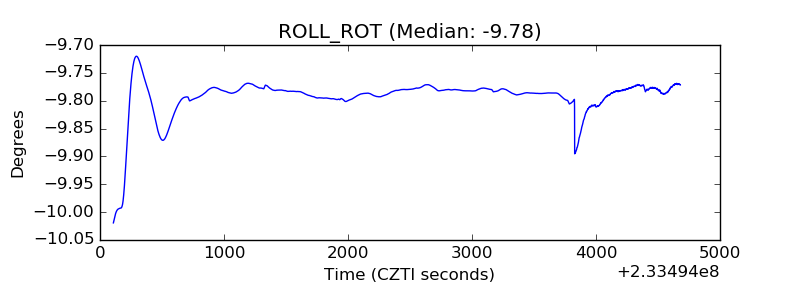 |
| _Roll_DEC | 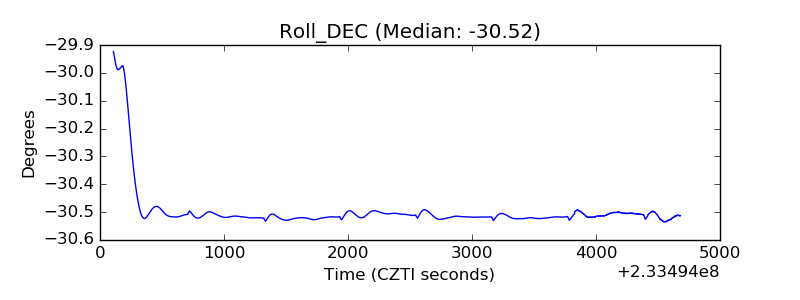 |
| _Roll_RA |  |
| Veto Counter | 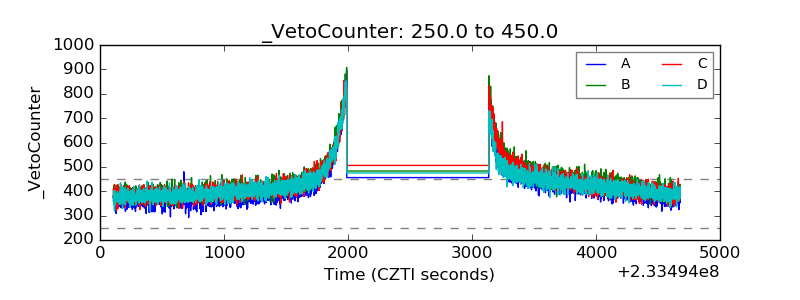 |