| Param | Original file | Final file |
|---|---|---|
| Filename | modeM0/AS1A03_107T01_9000001246_08976cztM0_level2.evt | modeM0/AS1A03_107T01_9000001246_08976cztM0_level2_quad_clean.evt |
| Size (bytes) | 743,322,240 | 69,960,960 |
| Size | 708.9 MB | 66.7 MB |
| Events in quadrant A | 4,626,623 | 432,906 |
| Events in quadrant B | 6,952,109 | 435,402 |
| Events in quadrant C | 5,374,096 | 398,378 |
| Events in quadrant D | 5,108,783 | 386,741 |
| Mode M9 | |||
|---|---|---|---|
| Quadrant | BADHDUFLAG | Total packets | Discarded packets |
| A | 0 | 12 | 0 |
| B | 0 | 12 | 0 |
| C | 0 | 12 | 0 |
| D | 0 | 13 | 0 |
| Mode M0 | |||
|---|---|---|---|
| Quadrant | BADHDUFLAG | Total packets | Discarded packets |
| A | 0 | 17927 | 18 |
| B | 0 | 25317 | 56 |
| C | 0 | 20448 | 45 |
| D | 0 | 19667 | 39 |
| Mode SS | |||
|---|---|---|---|
| Quadrant | BADHDUFLAG | Total packets | Discarded packets |
| A | 0 | 136 | 0 |
| B | 0 | 136 | 0 |
| C | 0 | 136 | 0 |
| D | 0 | 136 | 0 |
| Quadrant | Total seconds | Saturated seconds | Saturation percentage |
|---|---|---|---|
| A | 6663 | 405 | 6.078343% |
| B | 6657 | 1057 | 15.878023% |
| C | 6658 | 677 | 10.168219% |
| D | 6662 | 573 | 8.601021% |
Noise dominated data is calculated using 1-second bins in cleaned event files. If a bin has >2000 counts, and if more than 50% of those come from <1% of pixels, then it is considered to be noise-dominated and hence unusable.
| Quadrant | # 1 sec bins | Bins with >0 counts | Bins with >2000 counts | High rate bins dominated by noise | Noise dominated (total time) | Noise dominated (detector-on time) | Marked lightcurve |
|---|---|---|---|---|---|---|---|
| A | 7617 | 6667 | 220 | 220 | 2.89% | 3.30% | 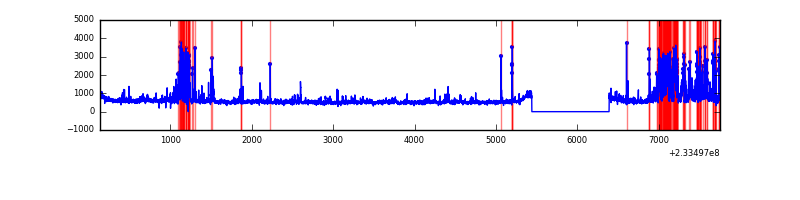 |
| B | 7617 | 6667 | 553 | 553 | 7.26% | 8.29% | 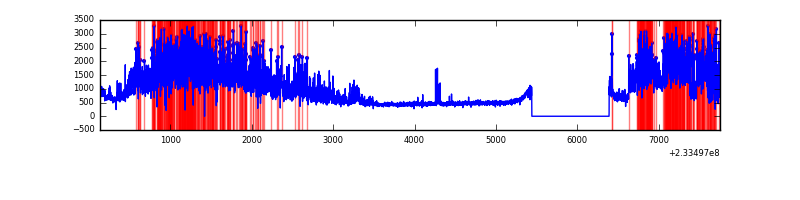 |
| C | 7617 | 6667 | 425 | 425 | 5.58% | 6.37% | 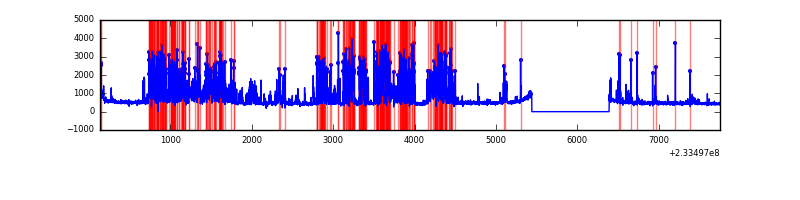 |
| D | 7617 | 6668 | 502 | 502 | 6.59% | 7.53% | 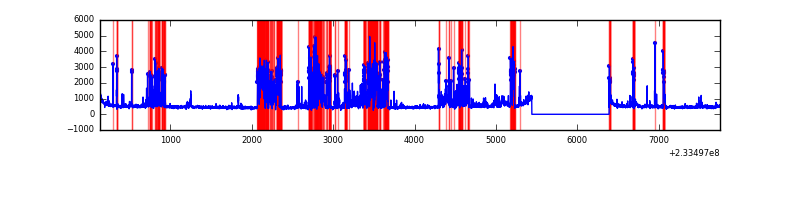 |
Top three noisy pixels from each quadrant. If the there are fewer than three noisy pixels in the level2.evt file, extra rows are filled as -1
| Pixel properties | Quadrant properties | ||||||
|---|---|---|---|---|---|---|---|
| Quadrant | DetID | PixID | Counts | Sigma | Mean | Median | Sigma |
| A | 5 | 16 | 715620 | 4404.9 | 802 | 786 | 162.3 |
| A | 8 | 5 | 468883 | 2884.48 | 802 | 786 | 162.3 |
| A | 13 | 251 | 331151 | 2035.75 | 802 | 786 | 162.3 |
| B | 0 | 85 | 3795535 | 25152.41 | 793 | 774 | 150.9 |
| B | 0 | 214 | 59775 | 391.07 | 793 | 774 | 150.9 |
| B | 12 | 111 | 15114 | 95.05 | 793 | 774 | 150.9 |
| C | 4 | 254 | 2408757 | 13685.4 | 758 | 761 | 176.0 |
| C | 4 | 238 | 8545 | 44.24 | 758 | 761 | 176.0 |
| C | 13 | 61 | 5803 | 28.66 | 758 | 761 | 176.0 |
| D | 1 | 52 | 971044 | 5110.43 | 770 | 747 | 189.9 |
| D | 12 | 233 | 526028 | 2766.59 | 770 | 747 | 189.9 |
| D | 13 | 29 | 429670 | 2259.08 | 770 | 747 | 189.9 |
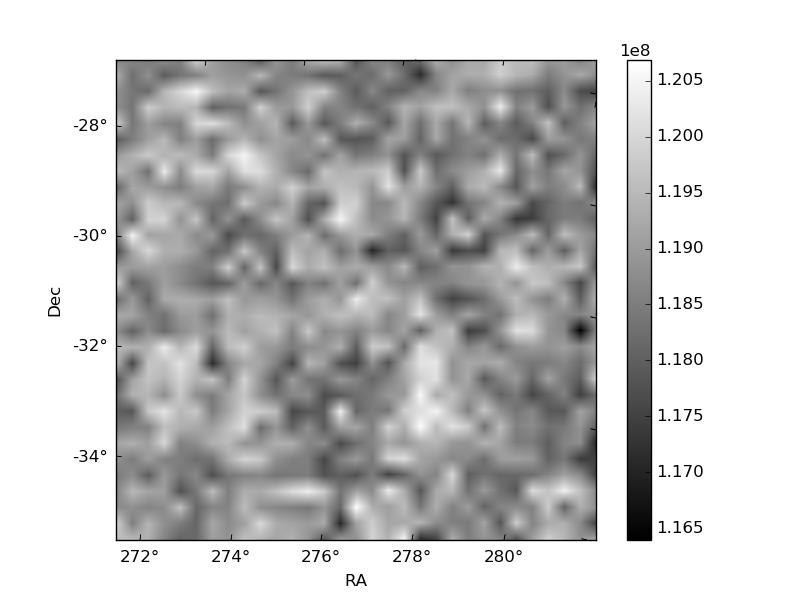
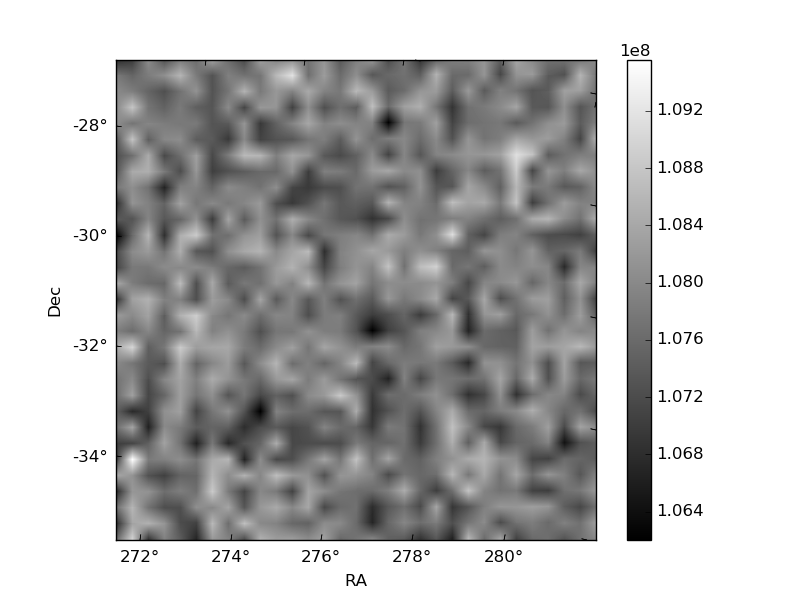
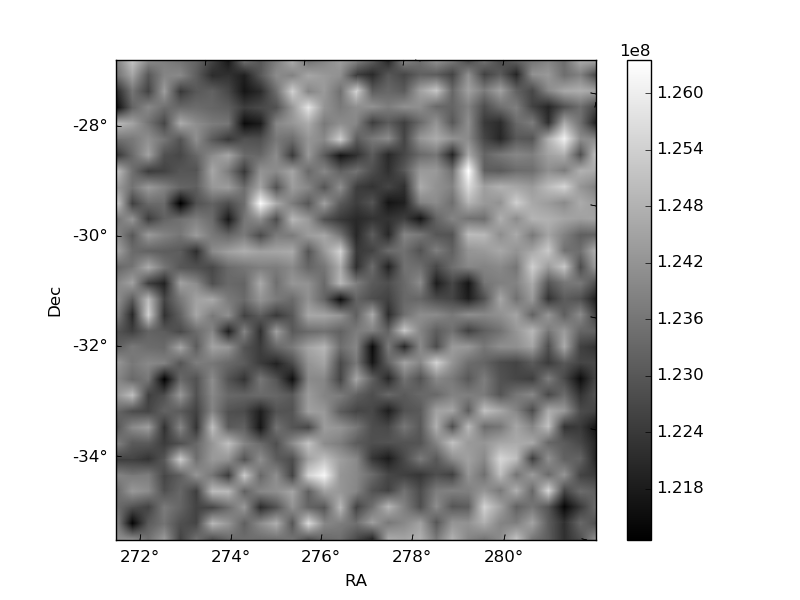
Histogram calculated using DETX and DETY for each event in the final _common_clean file
| Quadrant A | 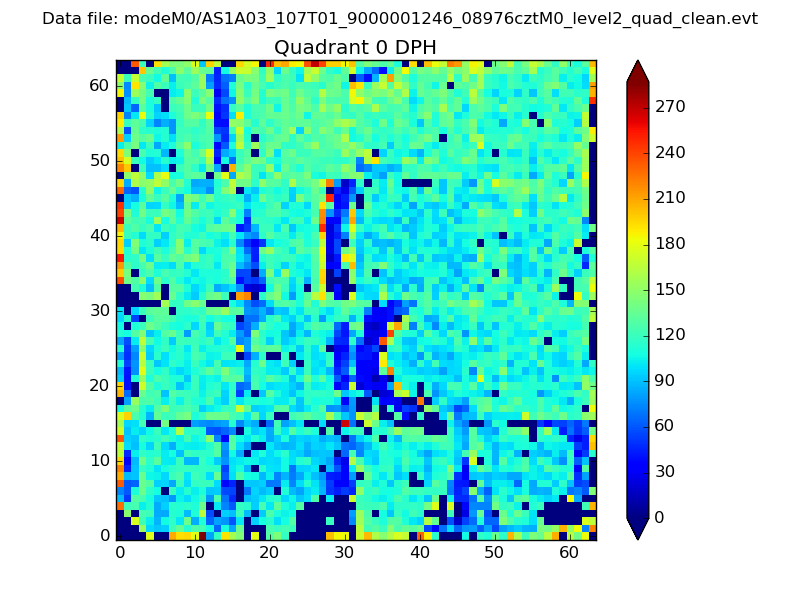 |
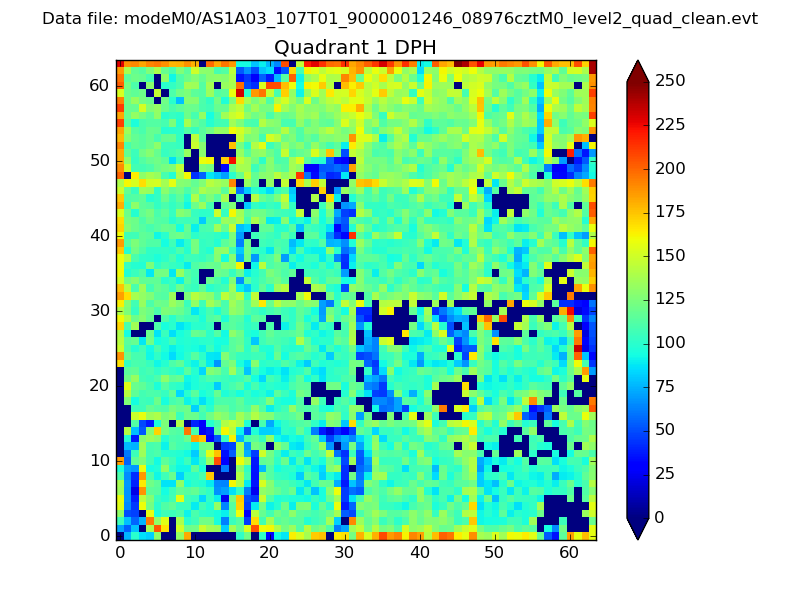 |
Quadrant B |
|---|---|---|---|
| Quadrant D | 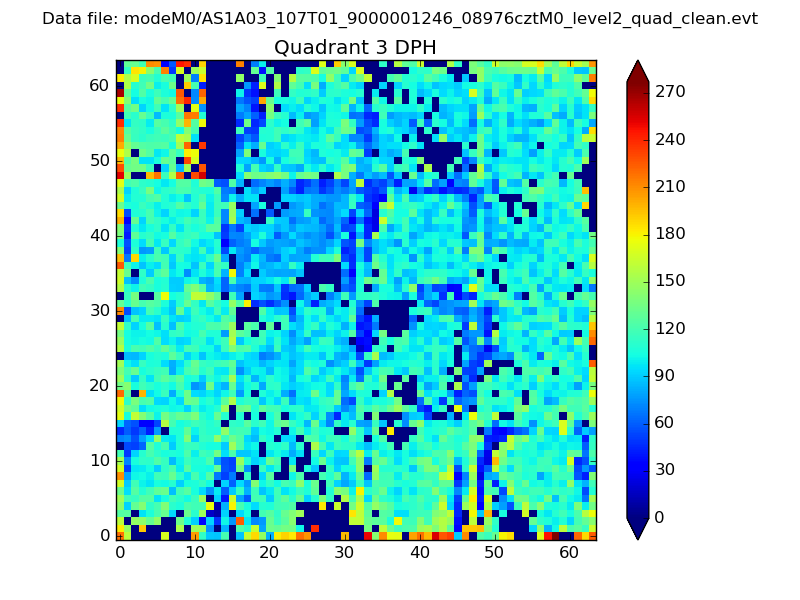 |
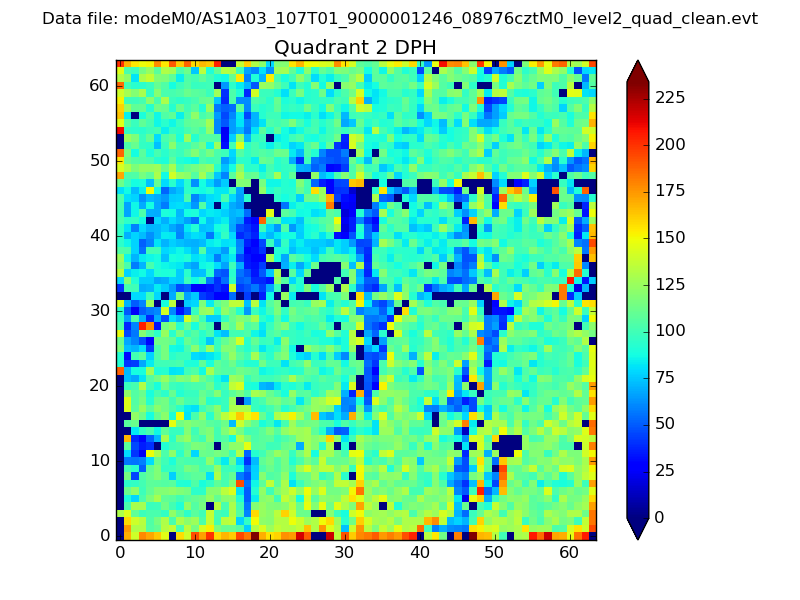 |
Quadrant C |
| Plot type | Count rate plots | Images |
|---|---|---|
| Comparison with Poisson distribution Blue bars denote a histogram of data divided into 1 sec bins. Red curve is a Poisson curve with rate = median count rate of data. |
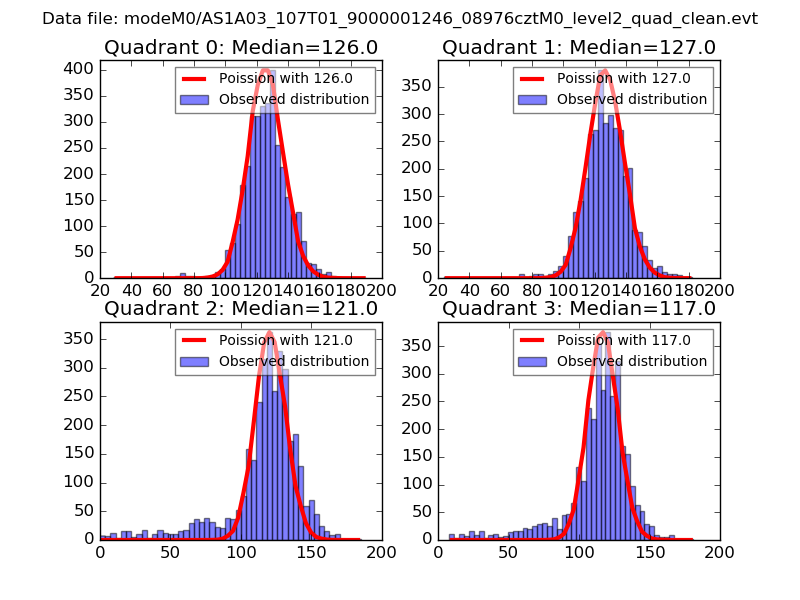 |
 |
| Quadrant-wise count rates Data is divided into 100 sec bins |
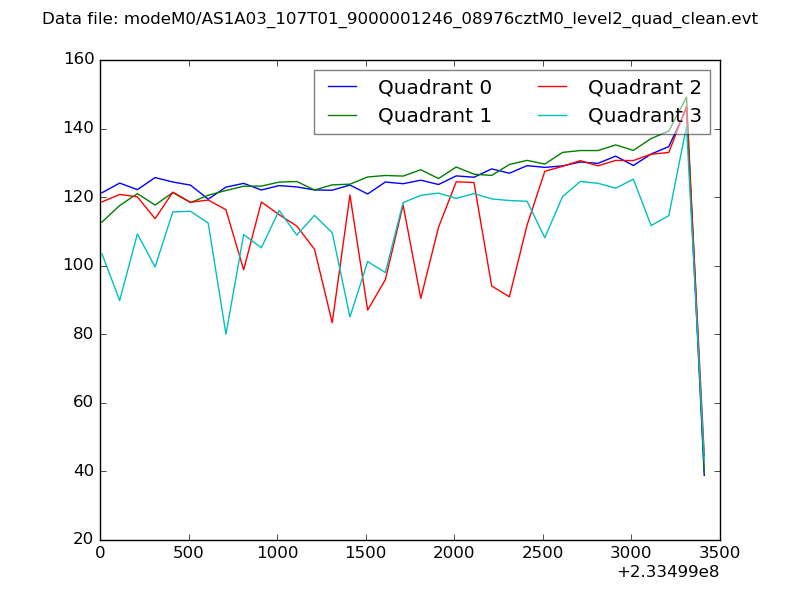 |
|
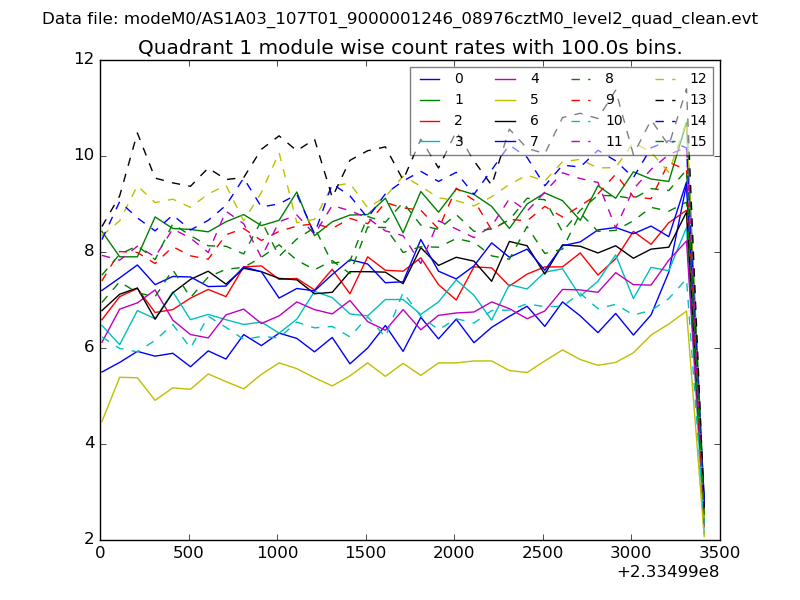
| Module-wise count rates for Quadrant A Data is divided into 100 sec bins |
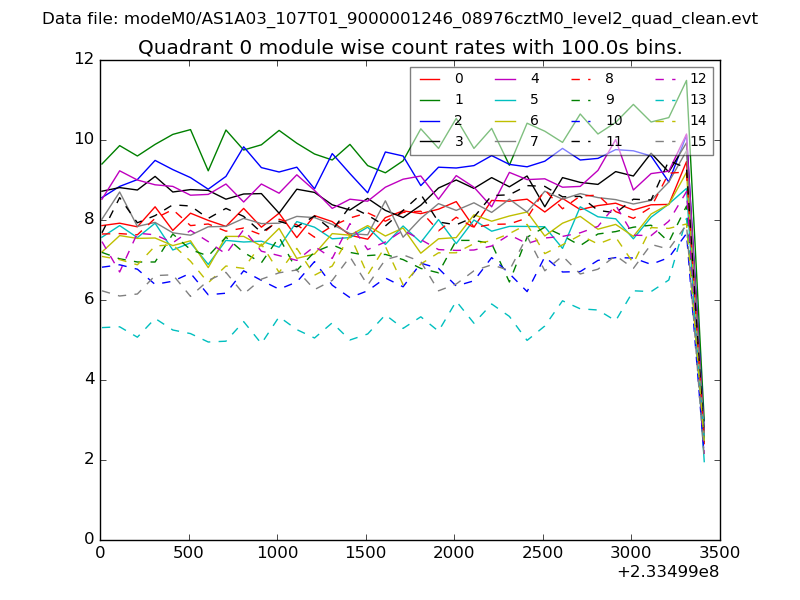 |
 |
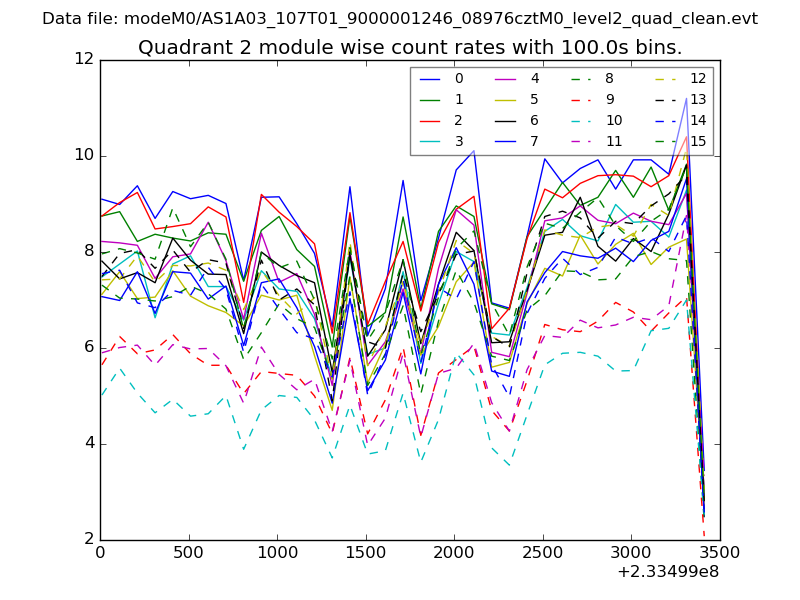
| Module-wise count rates for Quadrant B Data is divided into 100 sec bins |
 |
 |
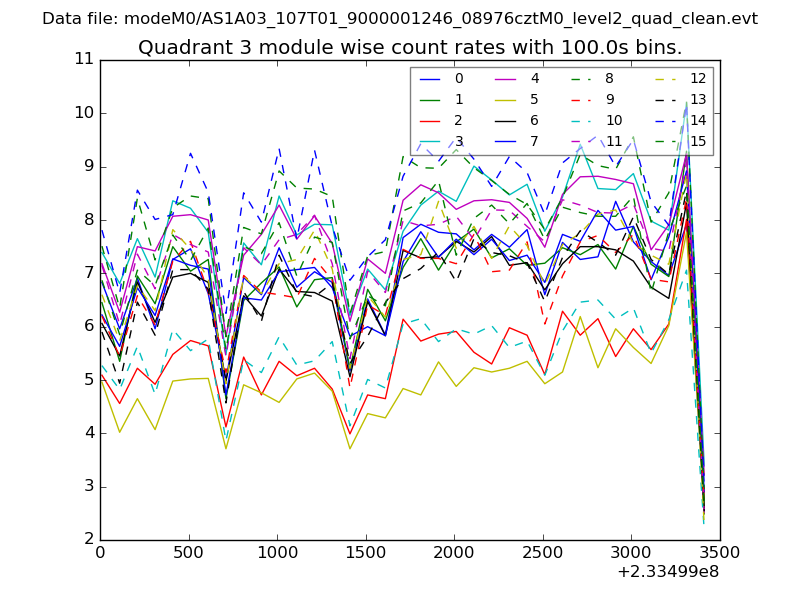
| Module-wise count rates for Quadrant C Data is divided into 100 sec bins |
 |
 |
| Module-wise count rates for Quadrant D Data is divided into 100 sec bins |
 |
 |
| Parameter | Plot |
|---|---|
| CZT HV Monitor | 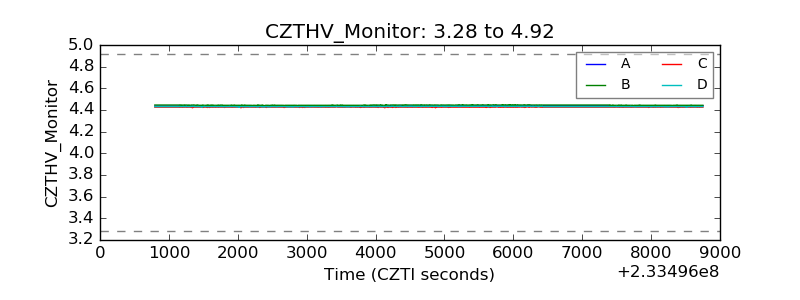 |
| D_VDD |  |
| Temperature 1 | 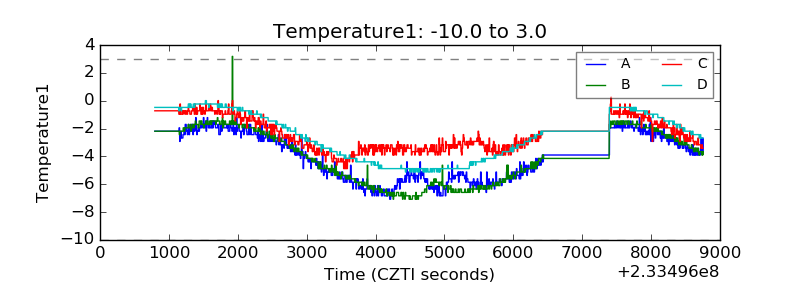 |
| Veto HV Monitor | 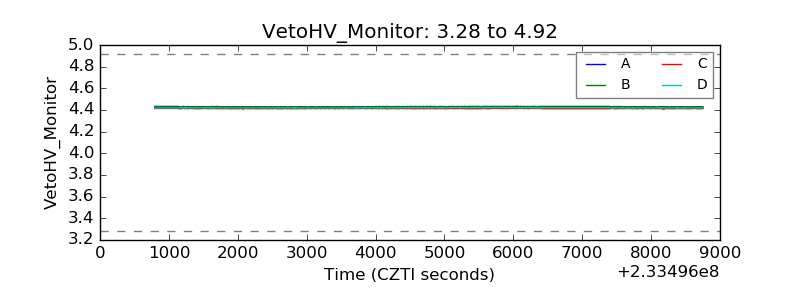 |
| Veto LLD | 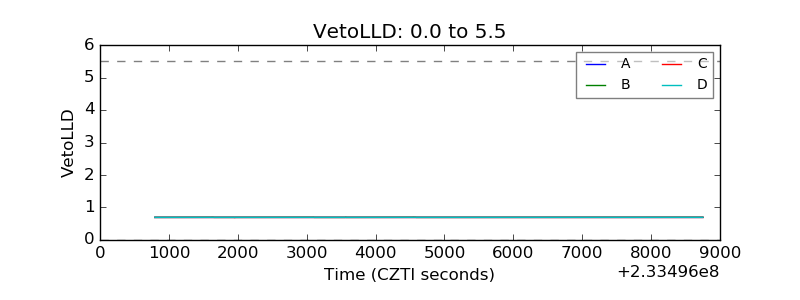 |
| Alpha Counter | 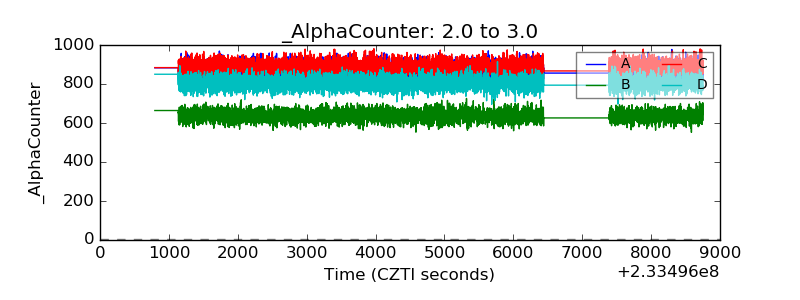 |
| _CPM_Rate | 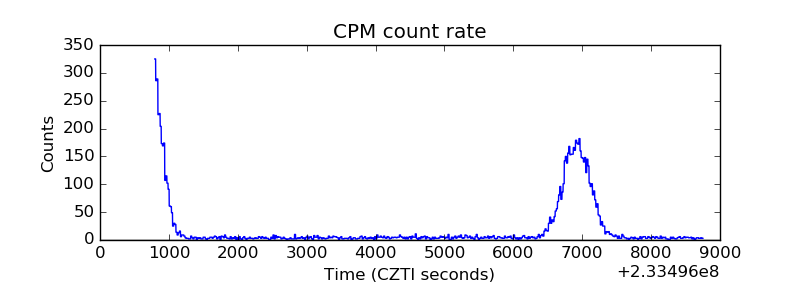 |
| CZT Counter | 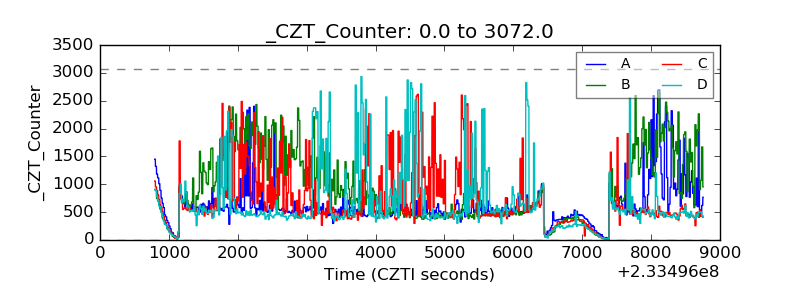 |
| +2.5 Volts monitor |  |
| +5 Volts monitor |  |
| _ROLL_ROT | 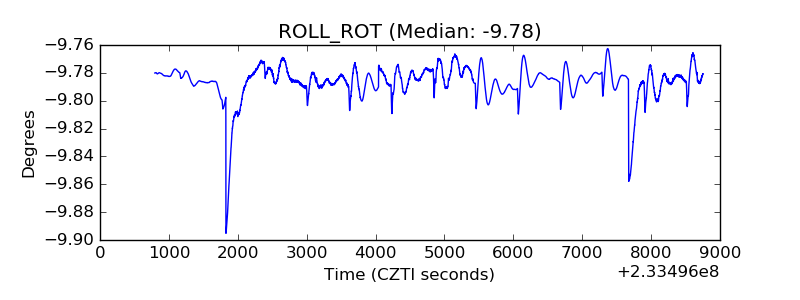 |
| _Roll_DEC | 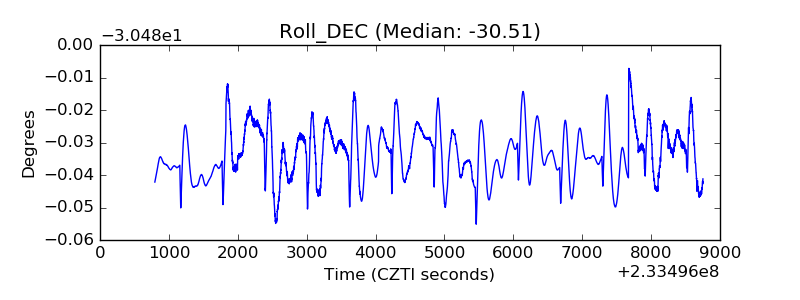 |
| _Roll_RA |  |
| Veto Counter | 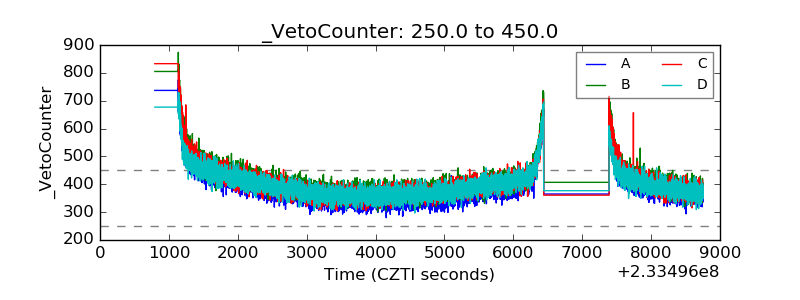 |