| Param | Original file | Final file |
|---|---|---|
| Filename | modeM0/AS1A03_107T01_9000001246_08977cztM0_level2.evt | modeM0/AS1A03_107T01_9000001246_08977cztM0_level2_quad_clean.evt |
| Size (bytes) | 926,602,560 | 82,615,680 |
| Size | 883.7 MB | 78.8 MB |
| Events in quadrant A | 5,274,804 | 528,880 |
| Events in quadrant B | 13,955,311 | 426,967 |
| Events in quadrant C | 3,608,468 | 525,936 |
| Events in quadrant D | 4,716,186 | 496,014 |
| Mode M9 | |||
|---|---|---|---|
| Quadrant | BADHDUFLAG | Total packets | Discarded packets |
| A | 0 | 14 | 0 |
| B | 0 | 14 | 0 |
| C | 0 | 14 | 0 |
| D | 0 | 14 | 0 |
| Mode M0 | |||
|---|---|---|---|
| Quadrant | BADHDUFLAG | Total packets | Discarded packets |
| A | 0 | 20703 | 9 |
| B | 0 | 46617 | 2 |
| C | 0 | 15958 | 2 |
| D | 0 | 19128 | 11 |
| Mode SS | |||
|---|---|---|---|
| Quadrant | BADHDUFLAG | Total packets | Discarded packets |
| A | 0 | 156 | 0 |
| B | 0 | 156 | 0 |
| C | 0 | 156 | 0 |
| D | 0 | 156 | 0 |
| Quadrant | Total seconds | Saturated seconds | Saturation percentage |
|---|---|---|---|
| A | 7504 | 608 | 8.102345% |
| B | 7506 | 4558 | 60.724754% |
| C | 7506 | 117 | 1.558753% |
| D | 7503 | 416 | 5.544449% |
Noise dominated data is calculated using 1-second bins in cleaned event files. If a bin has >2000 counts, and if more than 50% of those come from <1% of pixels, then it is considered to be noise-dominated and hence unusable.
| Quadrant | # 1 sec bins | Bins with >0 counts | Bins with >2000 counts | High rate bins dominated by noise | Noise dominated (total time) | Noise dominated (detector-on time) | Marked lightcurve |
|---|---|---|---|---|---|---|---|
| A | 8956 | 7508 | 308 | 308 | 3.44% | 4.10% | 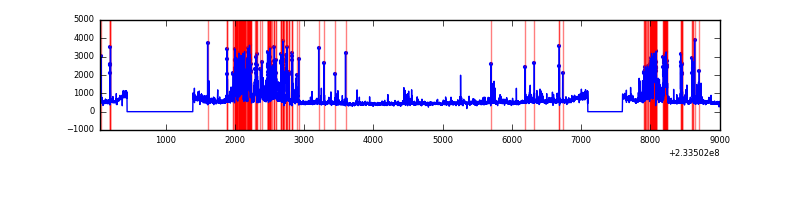 |
| B | 8956 | 7507 | 3469 | 3469 | 38.73% | 46.21% | 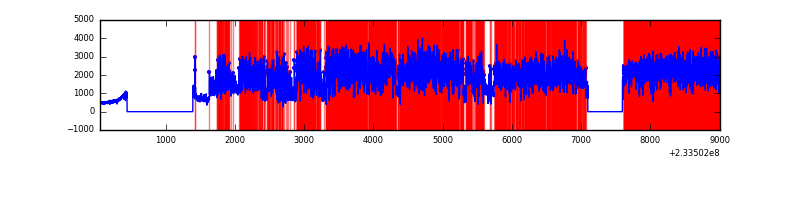 |
| C | 8956 | 7508 | 11 | 11 | 0.12% | 0.15% | 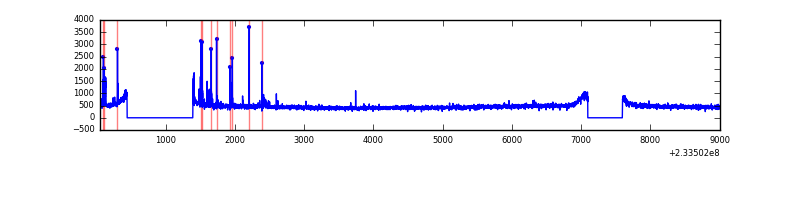 |
| D | 8956 | 7508 | 261 | 261 | 2.91% | 3.48% |  |
Top three noisy pixels from each quadrant. If the there are fewer than three noisy pixels in the level2.evt file, extra rows are filled as -1
| Pixel properties | Quadrant properties | ||||||
|---|---|---|---|---|---|---|---|
| Quadrant | DetID | PixID | Counts | Sigma | Mean | Median | Sigma |
| A | 5 | 16 | 961451 | 5173.42 | 900 | 879 | 185.7 |
| A | 13 | 251 | 431752 | 2320.58 | 900 | 879 | 185.7 |
| A | 8 | 5 | 370586 | 1991.16 | 900 | 879 | 185.7 |
| B | 0 | 85 | 10940504 | 75273.09 | 756 | 737 | 145.3 |
| B | 0 | 214 | 32477 | 218.39 | 756 | 737 | 145.3 |
| B | 4 | 173 | 29013 | 194.56 | 756 | 737 | 145.3 |
| C | 4 | 254 | 123044 | 586.75 | 892 | 897 | 208.2 |
| C | 13 | 61 | 6720 | 27.97 | 892 | 897 | 208.2 |
| C | 14 | 238 | 4128 | 15.52 | 892 | 897 | 208.2 |
| D | 1 | 52 | 872170 | 3724.28 | 871 | 854 | 234.0 |
| D | 7 | 71 | 216247 | 920.66 | 871 | 854 | 234.0 |
| D | 7 | 55 | 60858 | 256.48 | 871 | 854 | 234.0 |
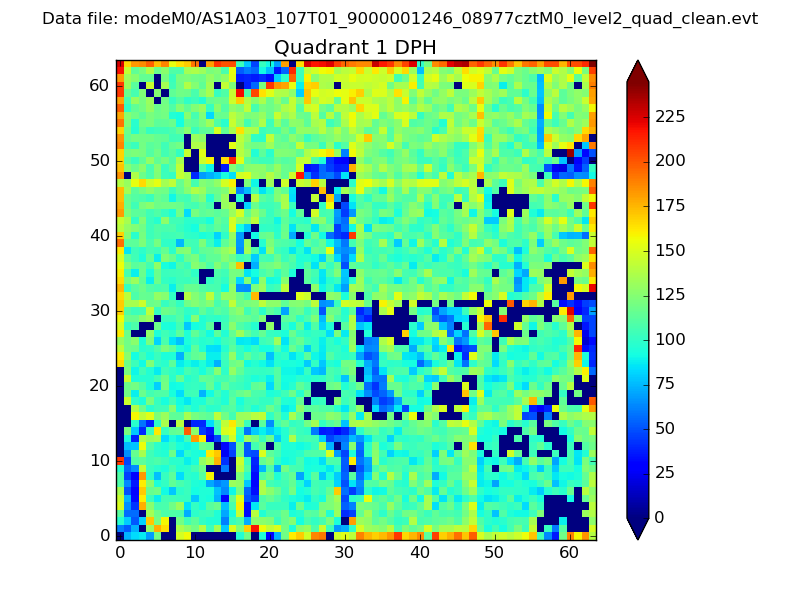
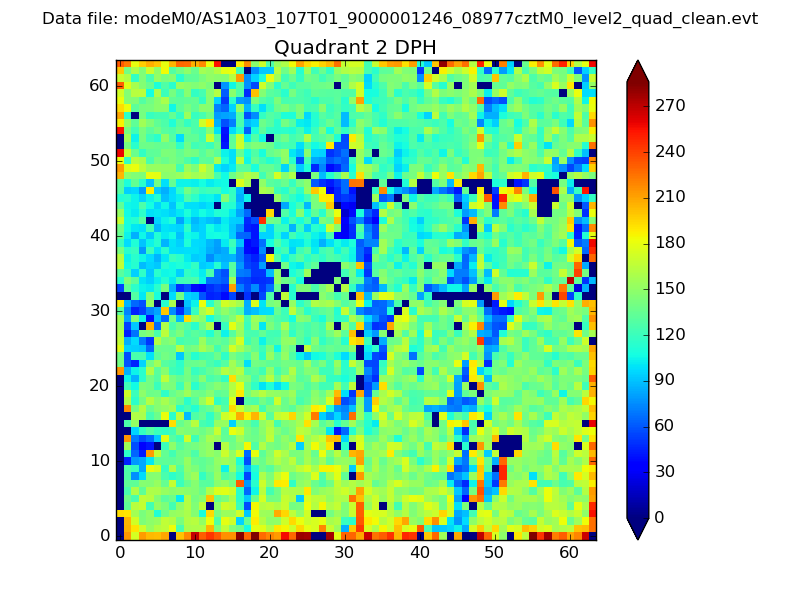
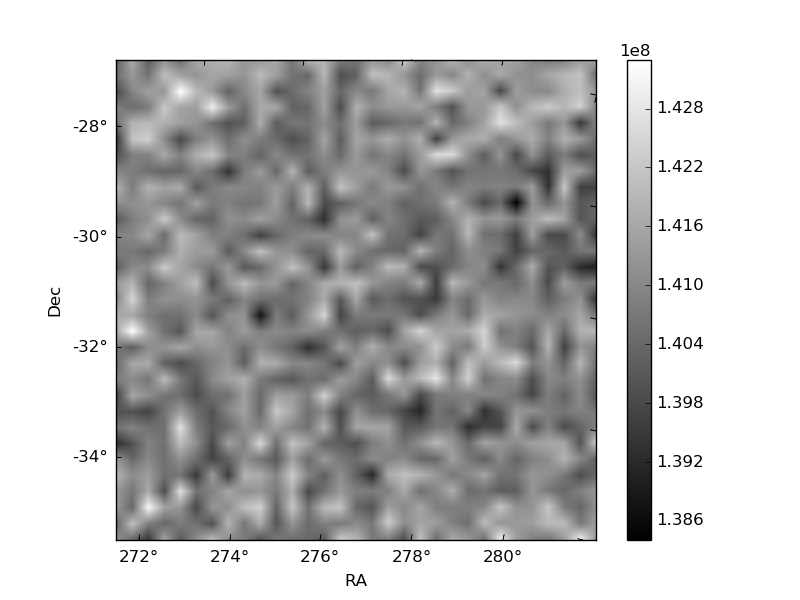
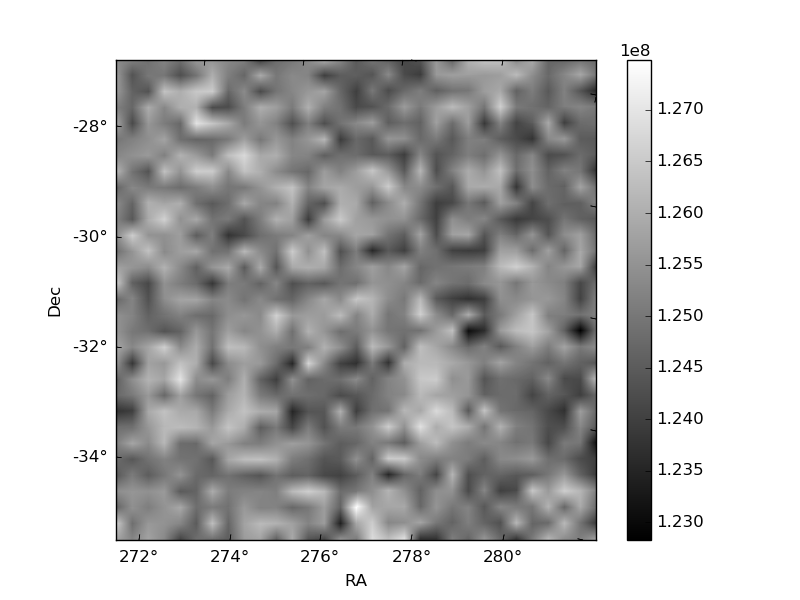
Histogram calculated using DETX and DETY for each event in the final _common_clean file
| Quadrant A | 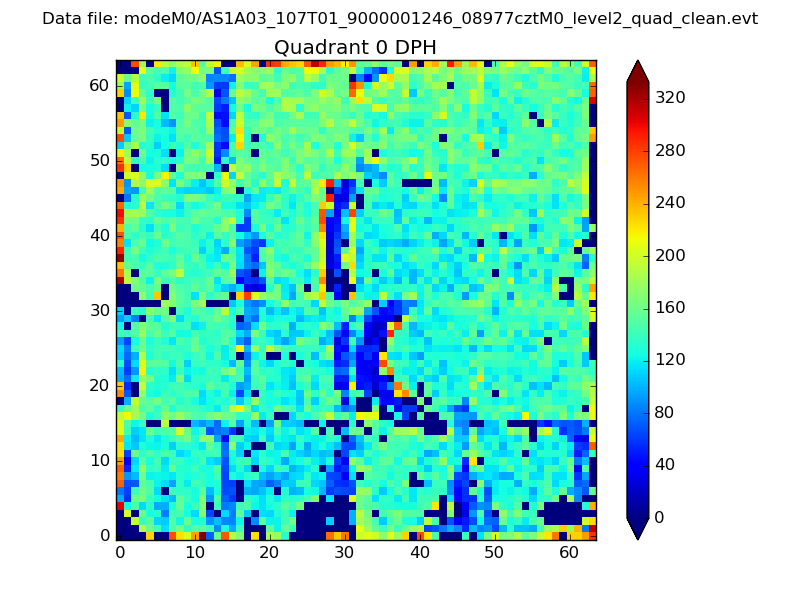 |
 |
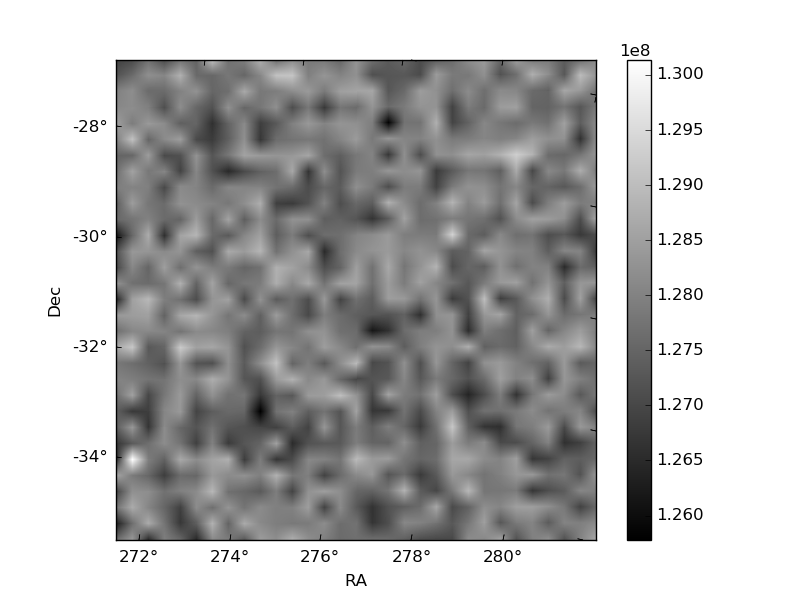
Quadrant B |
|---|---|---|---|
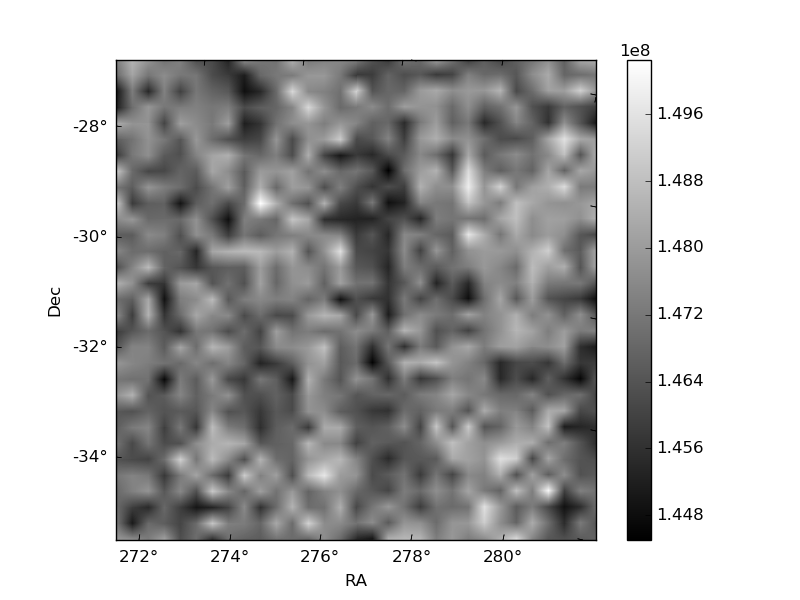
| Quadrant D | 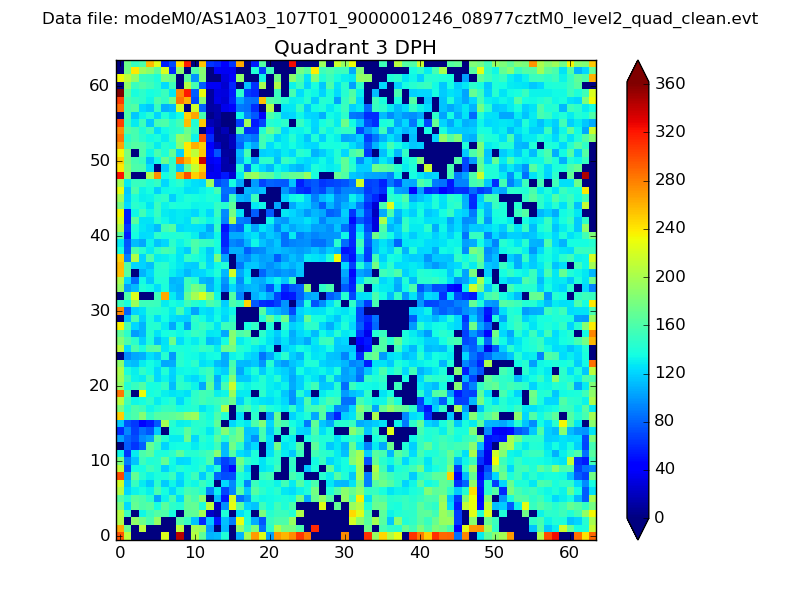 |
 |
Quadrant C |
| Plot type | Count rate plots | Images |
|---|---|---|
| Comparison with Poisson distribution Blue bars denote a histogram of data divided into 1 sec bins. Red curve is a Poisson curve with rate = median count rate of data. |
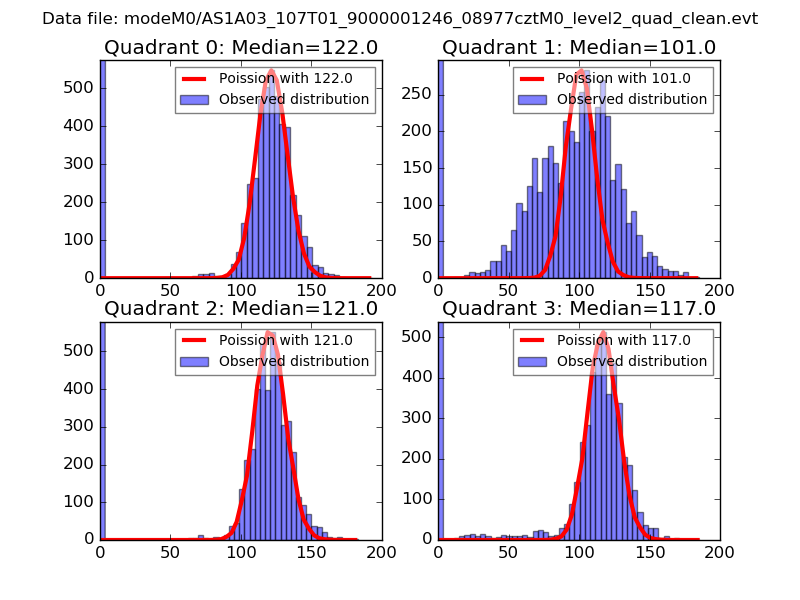 |
 |
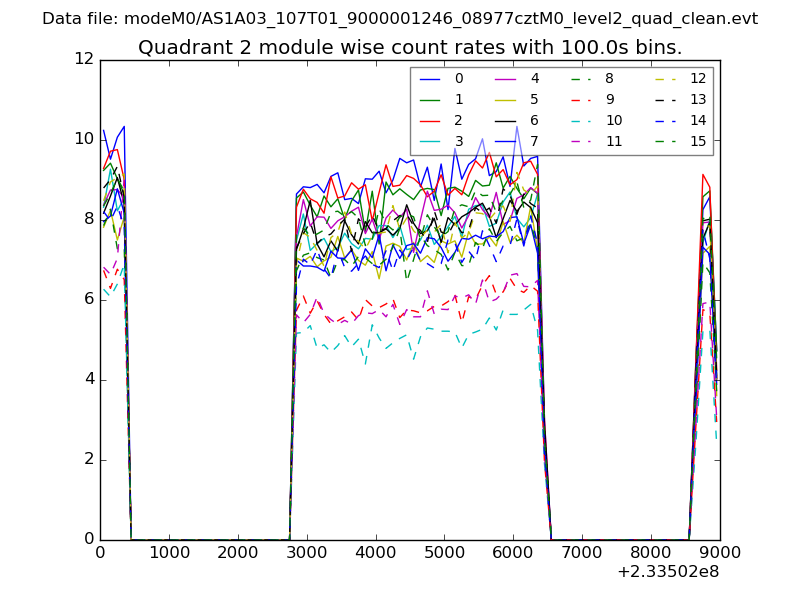
| Quadrant-wise count rates Data is divided into 100 sec bins |
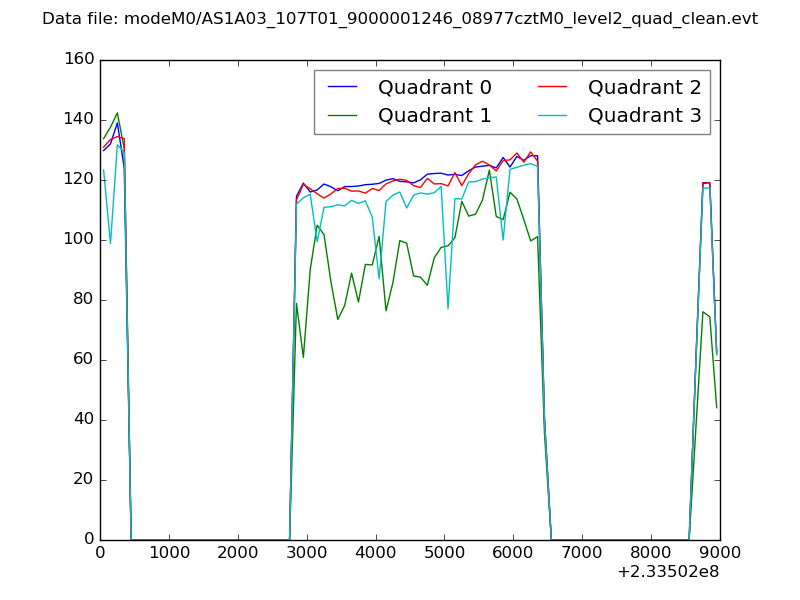 |
|
| Module-wise count rates for Quadrant A Data is divided into 100 sec bins |
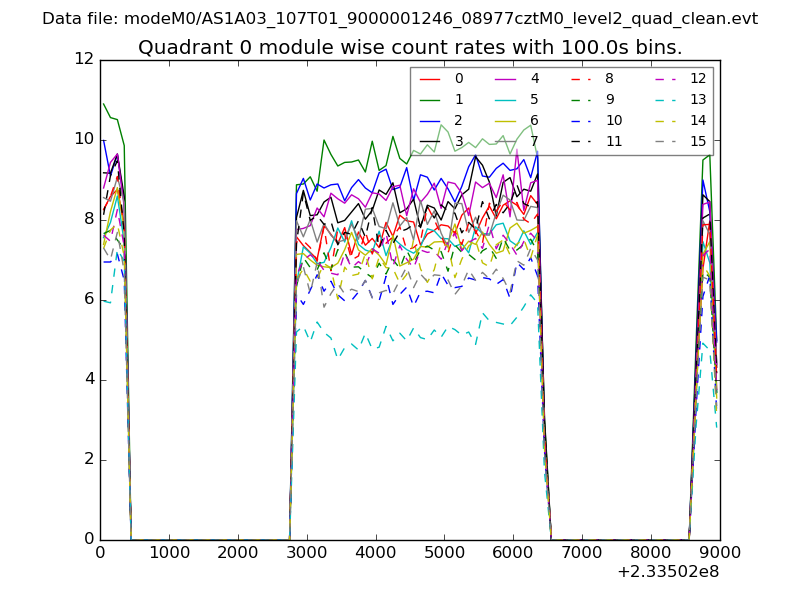 |
 |
| Module-wise count rates for Quadrant B Data is divided into 100 sec bins |
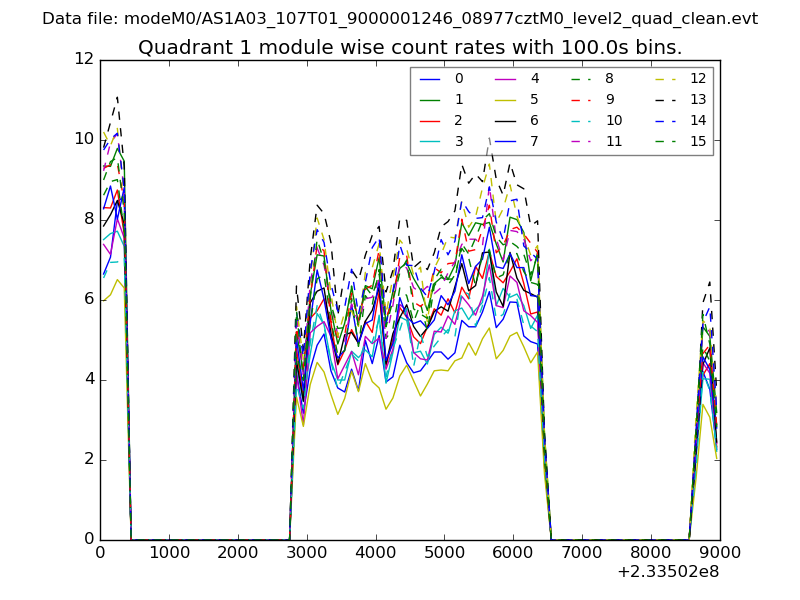 |
 |
| Module-wise count rates for Quadrant C Data is divided into 100 sec bins |
 |
 |
| Module-wise count rates for Quadrant D Data is divided into 100 sec bins |
 |
 |
| Parameter | Plot |
|---|---|
| CZT HV Monitor | 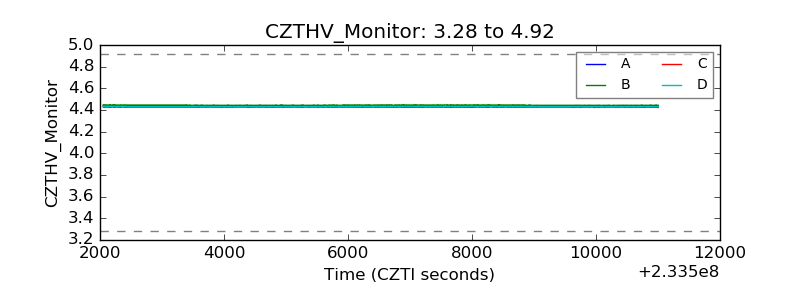 |
| D_VDD |  |
| Temperature 1 | 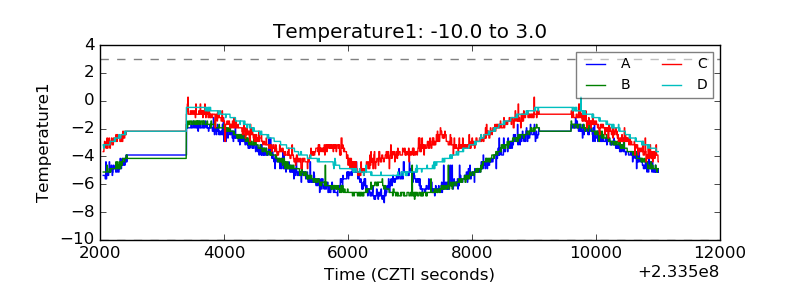 |
| Veto HV Monitor | 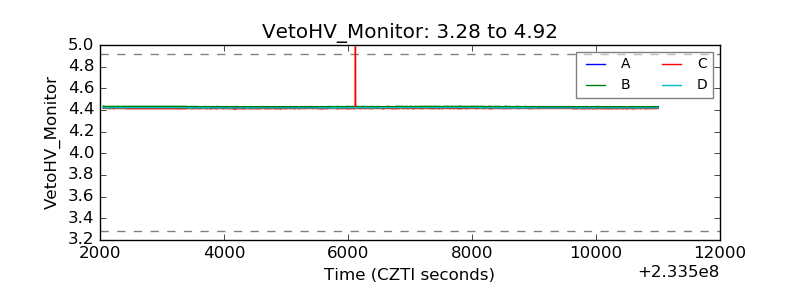 |
| Veto LLD | 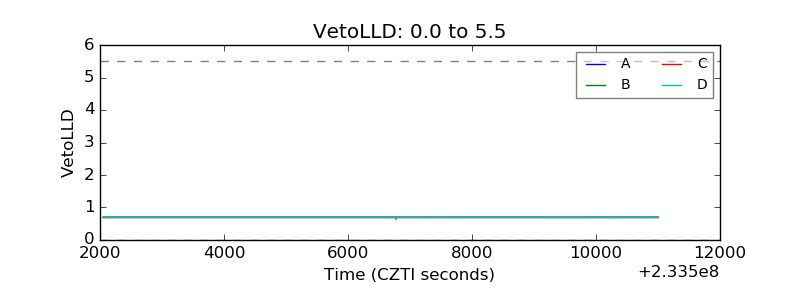 |
| Alpha Counter | 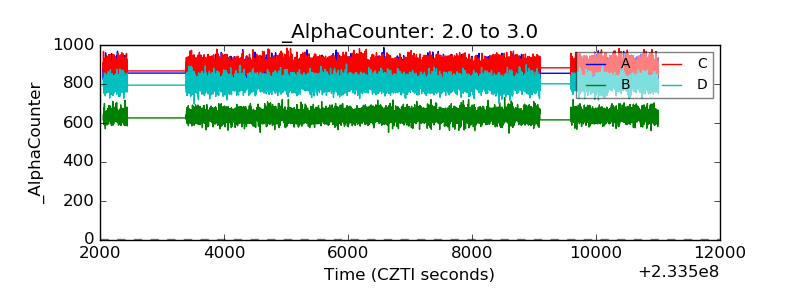 |
| _CPM_Rate | 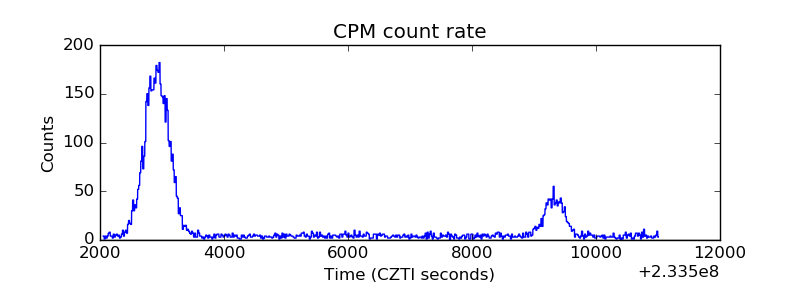 |
| CZT Counter | 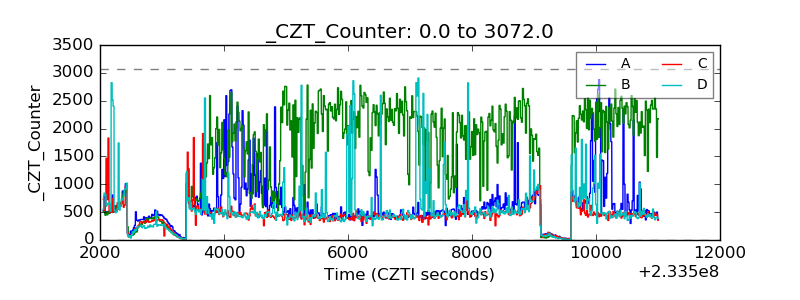 |
| +2.5 Volts monitor |  |
| +5 Volts monitor |  |
| _ROLL_ROT | 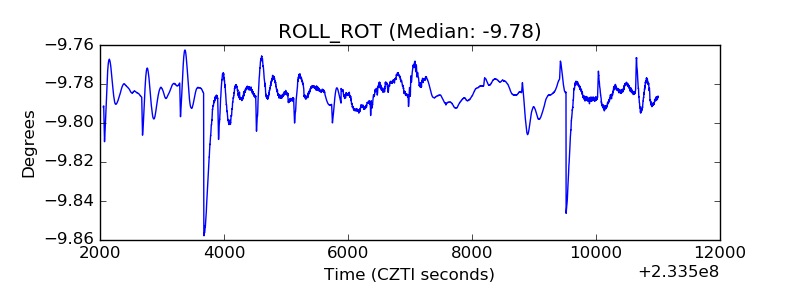 |
| _Roll_DEC | 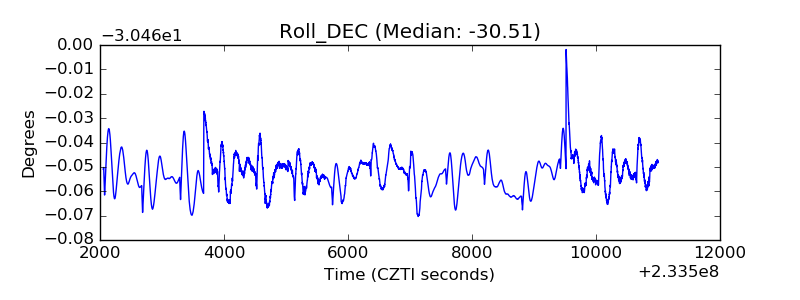 |
| _Roll_RA |  |
| Veto Counter | 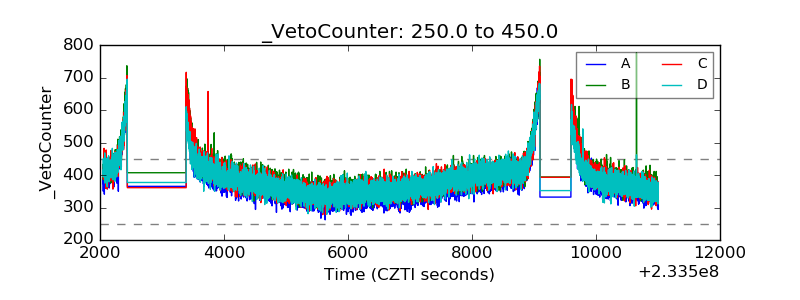 |