| Param | Original file | Final file |
|---|---|---|
| Filename | modeM0/AS1A03_107T01_9000001246_08982cztM0_level2.evt | modeM0/AS1A03_107T01_9000001246_08982cztM0_level2_quad_clean.evt |
| Size (bytes) | 617,261,760 | 113,166,720 |
| Size | 588.7 MB | 107.9 MB |
| Events in quadrant A | 4,219,673 | 718,609 |
| Events in quadrant B | 4,234,679 | 728,624 |
| Events in quadrant C | 5,691,537 | 706,687 |
| Events in quadrant D | 3,986,833 | 698,360 |
| Mode M9 | |||
|---|---|---|---|
| Quadrant | BADHDUFLAG | Total packets | Discarded packets |
| A | 0 | 6 | 0 |
| B | 0 | 6 | 0 |
| C | 0 | 6 | 0 |
| D | 0 | 6 | 0 |
| Mode M0 | |||
|---|---|---|---|
| Quadrant | BADHDUFLAG | Total packets | Discarded packets |
| A | 0 | 17819 | 29 |
| B | 0 | 18365 | 57 |
| C | 0 | 22789 | 68 |
| D | 0 | 17960 | 64 |
| Mode SS | |||
|---|---|---|---|
| Quadrant | BADHDUFLAG | Total packets | Discarded packets |
| A | 0 | 168 | 0 |
| B | 0 | 168 | 0 |
| C | 0 | 168 | 0 |
| D | 0 | 168 | 0 |
| Quadrant | Total seconds | Saturated seconds | Saturation percentage |
|---|---|---|---|
| A | 8279 | 20 | 0.241575% |
| B | 8272 | 135 | 1.632012% |
| C | 8272 | 598 | 7.229207% |
| D | 8269 | 33 | 0.399081% |
Noise dominated data is calculated using 1-second bins in cleaned event files. If a bin has >2000 counts, and if more than 50% of those come from <1% of pixels, then it is considered to be noise-dominated and hence unusable.
| Quadrant | # 1 sec bins | Bins with >0 counts | Bins with >2000 counts | High rate bins dominated by noise | Noise dominated (total time) | Noise dominated (detector-on time) | Marked lightcurve |
|---|---|---|---|---|---|---|---|
| A | 8850 | 8291 | 6 | 6 | 0.07% | 0.07% | 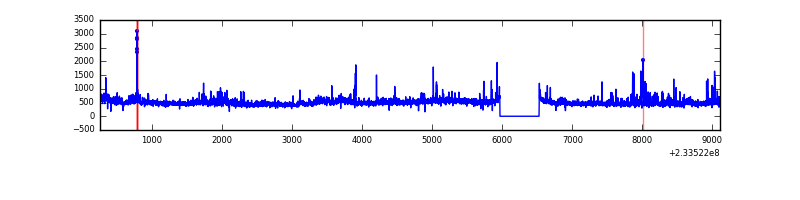 |
| B | 8850 | 8291 | 53 | 53 | 0.60% | 0.64% | 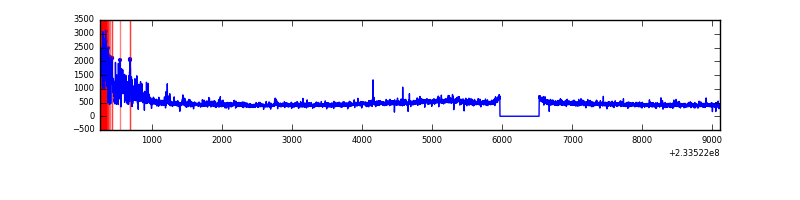 |
| C | 8850 | 8289 | 380 | 380 | 4.29% | 4.58% | 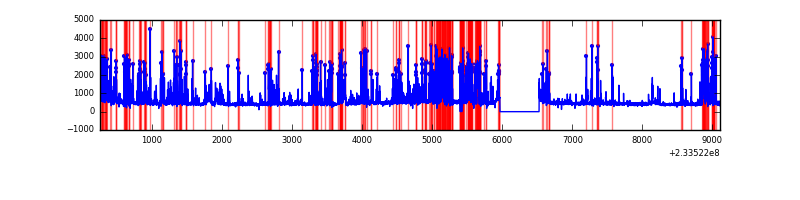 |
| D | 8850 | 8291 | 35 | 35 | 0.40% | 0.42% | 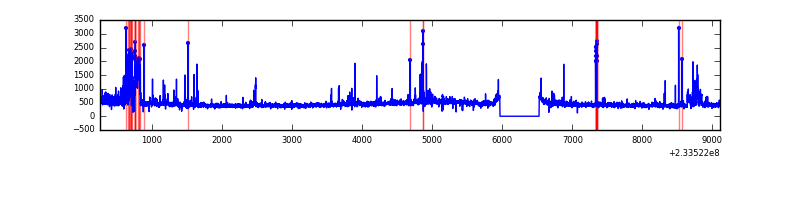 |
Top three noisy pixels from each quadrant. If the there are fewer than three noisy pixels in the level2.evt file, extra rows are filled as -1
| Pixel properties | Quadrant properties | ||||||
|---|---|---|---|---|---|---|---|
| Quadrant | DetID | PixID | Counts | Sigma | Mean | Median | Sigma |
| A | 8 | 5 | 582229 | 3034.66 | 937 | 917 | 191.6 |
| A | 5 | 16 | 25634 | 129.03 | 937 | 917 | 191.6 |
| A | 0 | 226 | 8820 | 41.26 | 937 | 917 | 191.6 |
| B | 0 | 85 | 424282 | 2325.05 | 946 | 923 | 182.1 |
| B | 4 | 173 | 57428 | 310.32 | 946 | 923 | 182.1 |
| B | 0 | 219 | 37768 | 202.35 | 946 | 923 | 182.1 |
| C | 4 | 254 | 2187915 | 10548.49 | 894 | 897 | 207.3 |
| C | 4 | 238 | 16011 | 72.9 | 894 | 897 | 207.3 |
| C | 13 | 61 | 6738 | 28.17 | 894 | 897 | 207.3 |
| D | 13 | 29 | 214280 | 882.7 | 905 | 884 | 241.8 |
| D | 2 | 14 | 124367 | 510.78 | 905 | 884 | 241.8 |
| D | 1 | 52 | 75980 | 310.63 | 905 | 884 | 241.8 |
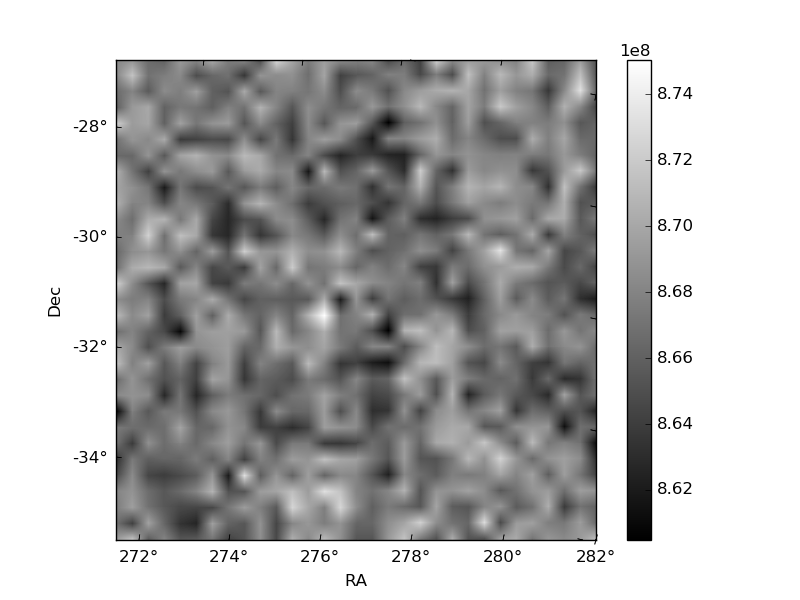
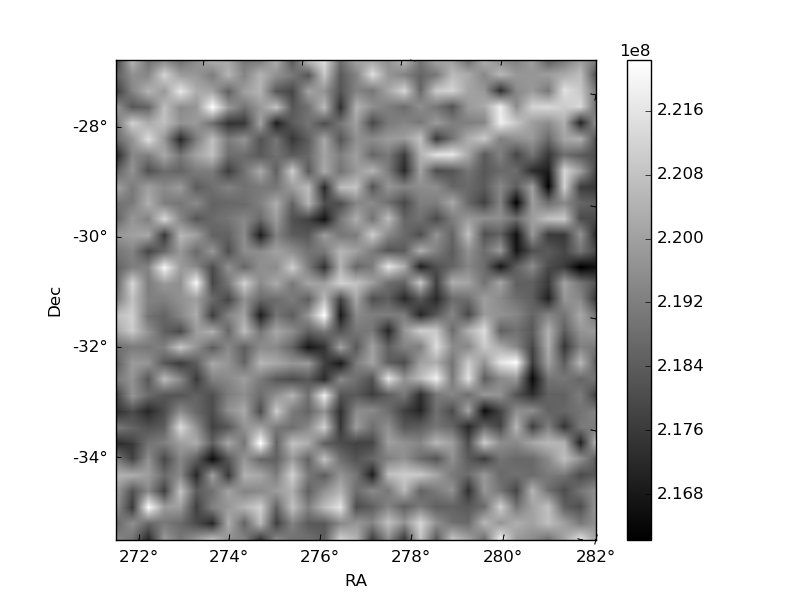
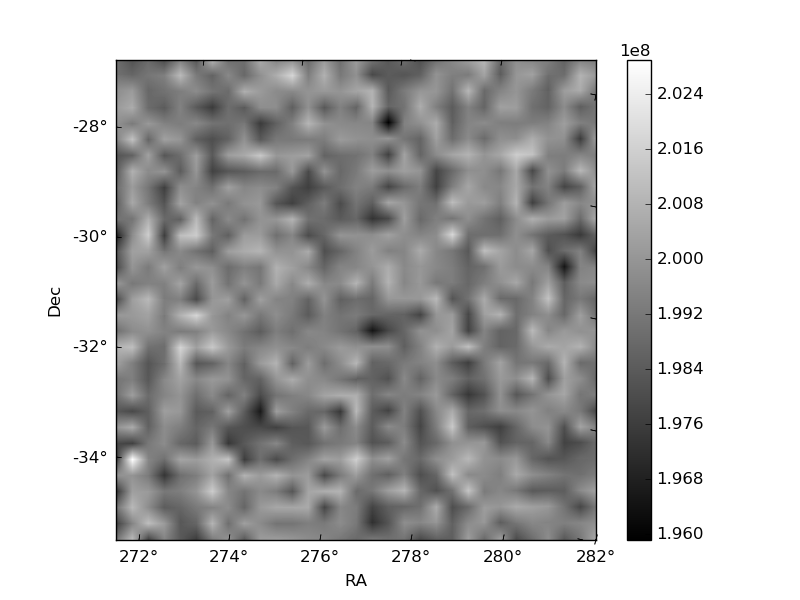
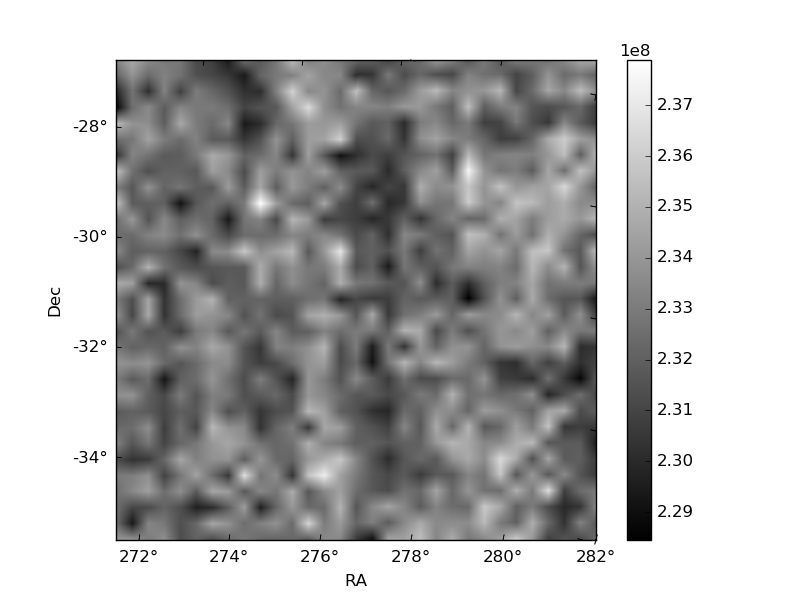
Histogram calculated using DETX and DETY for each event in the final _common_clean file
| Quadrant A | 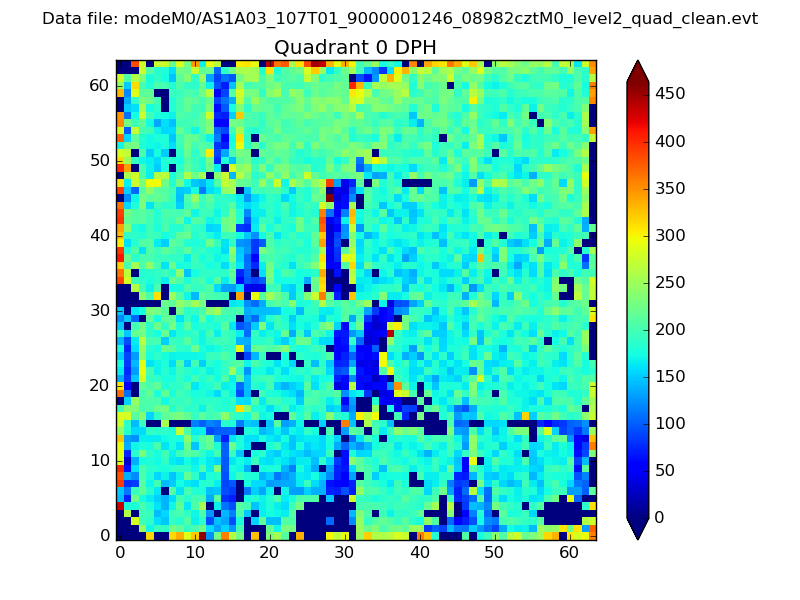 |
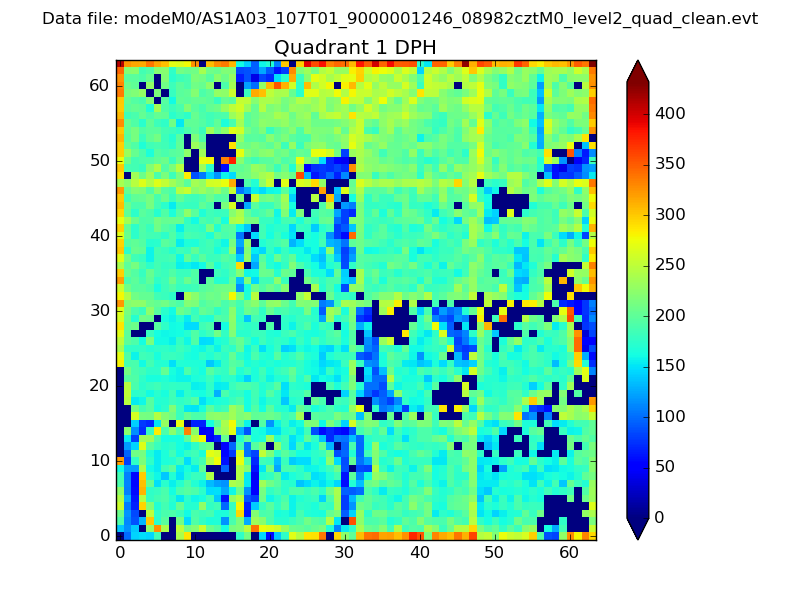 |
Quadrant B |
|---|---|---|---|
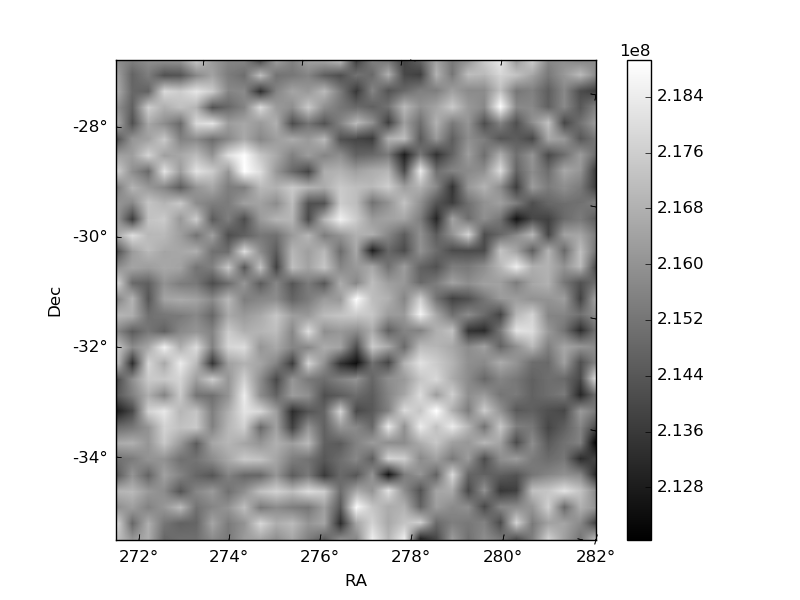
| Quadrant D | 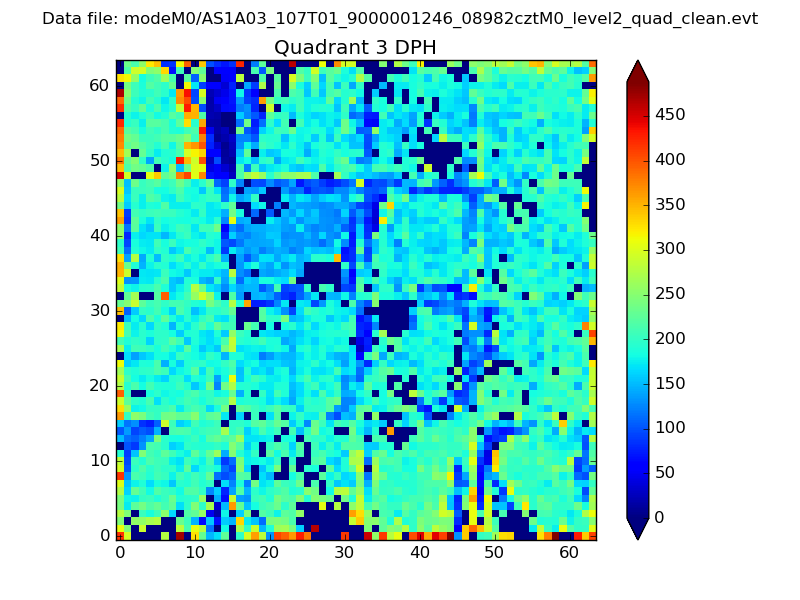 |
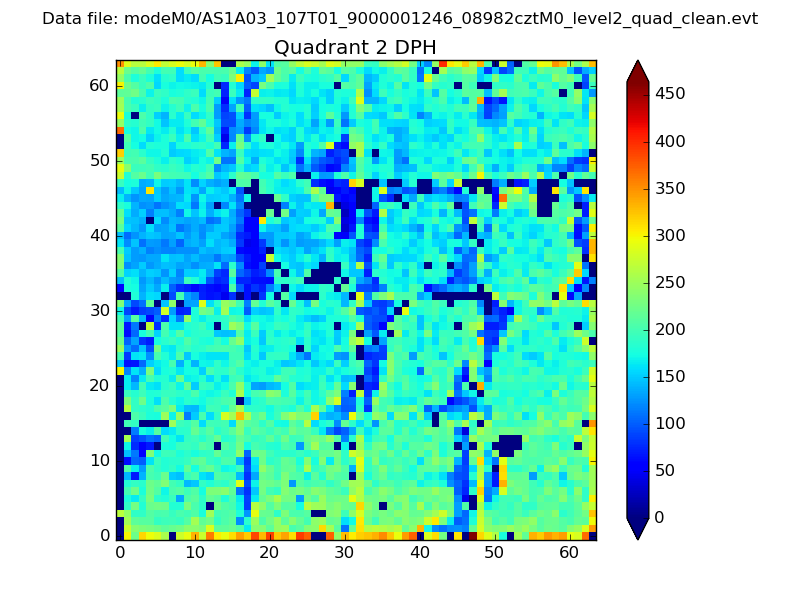 |
Quadrant C |
| Plot type | Count rate plots | Images |
|---|---|---|
| Comparison with Poisson distribution Blue bars denote a histogram of data divided into 1 sec bins. Red curve is a Poisson curve with rate = median count rate of data. |
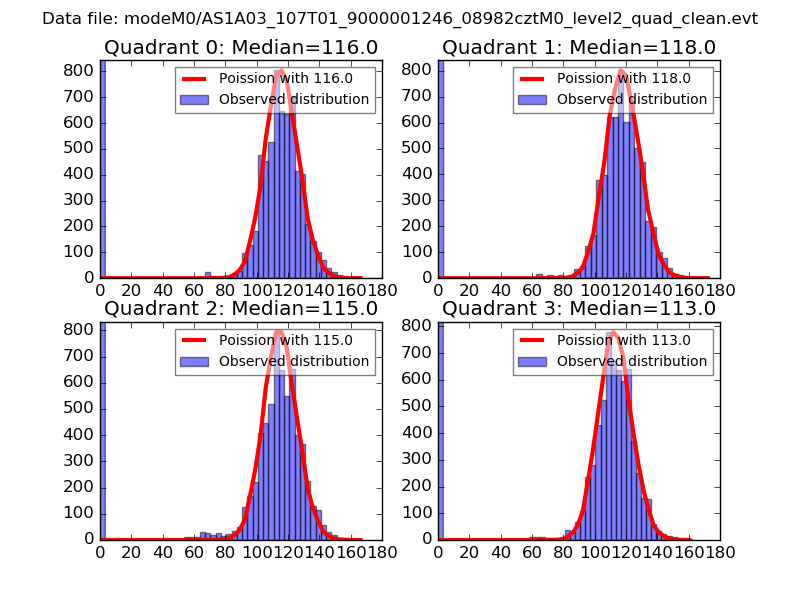 |
 |
| Quadrant-wise count rates Data is divided into 100 sec bins |
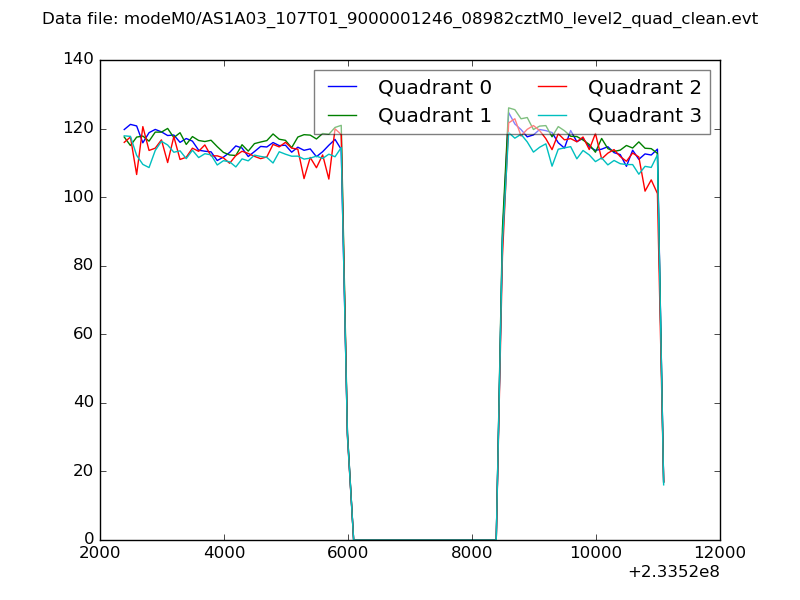 |
|
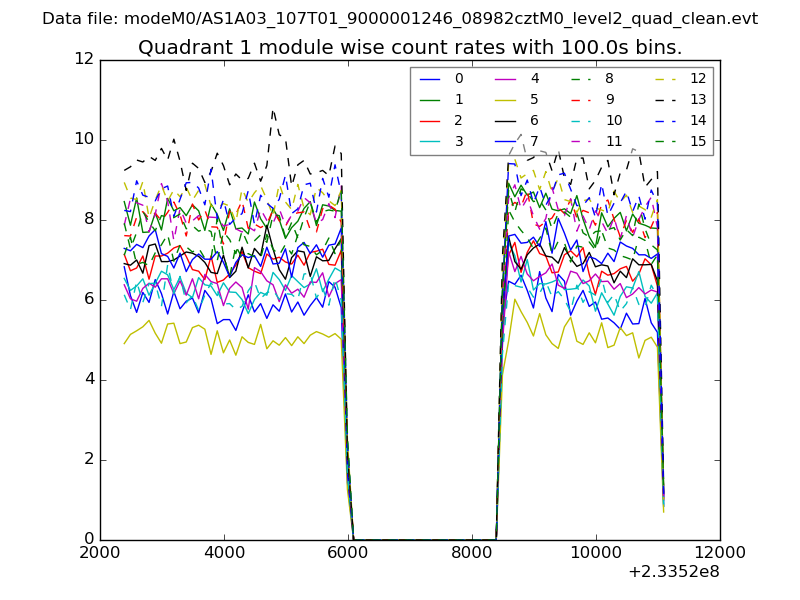
| Module-wise count rates for Quadrant A Data is divided into 100 sec bins |
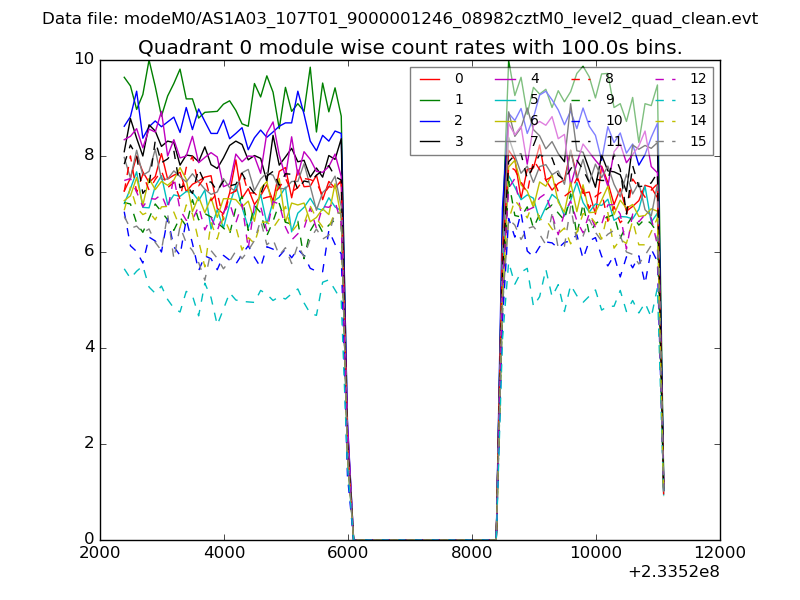 |
 |
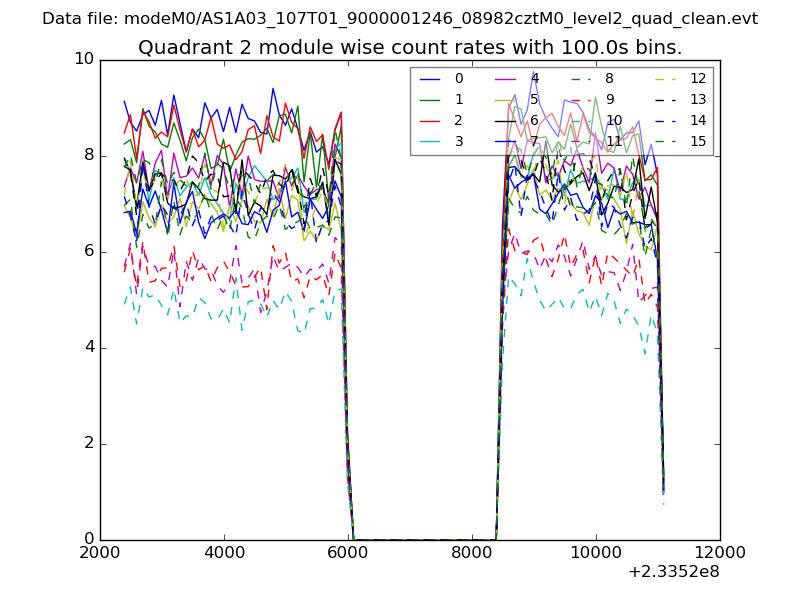
| Module-wise count rates for Quadrant B Data is divided into 100 sec bins |
 |
 |
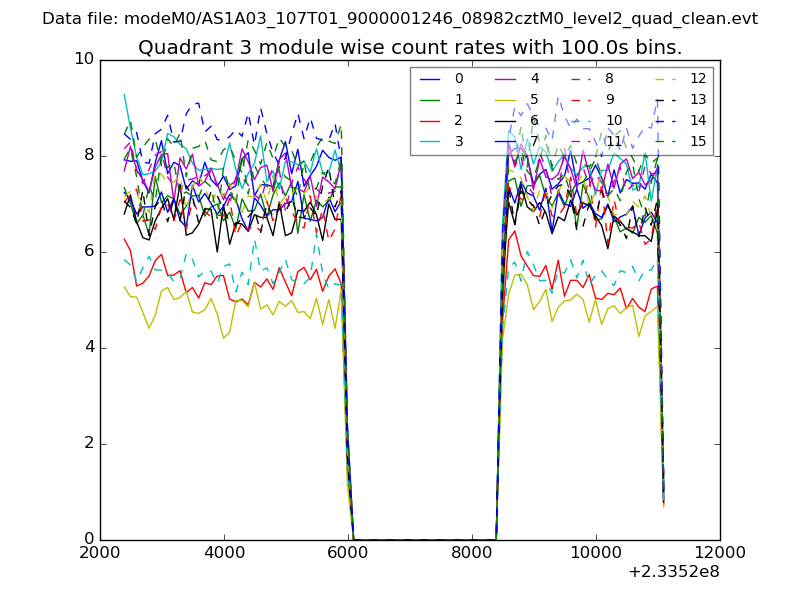
| Module-wise count rates for Quadrant C Data is divided into 100 sec bins |
 |
 |
| Module-wise count rates for Quadrant D Data is divided into 100 sec bins |
 |
 |
| Parameter | Plot |
|---|---|
| CZT HV Monitor | 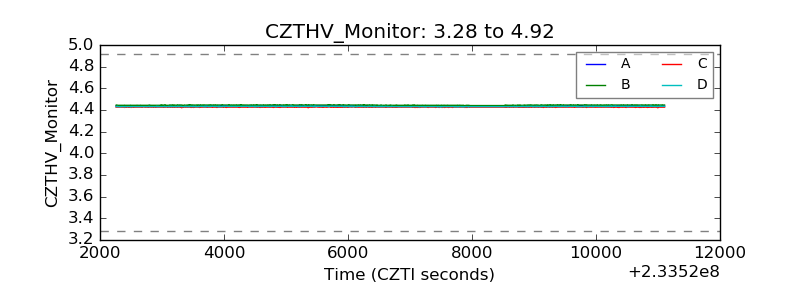 |
| D_VDD | 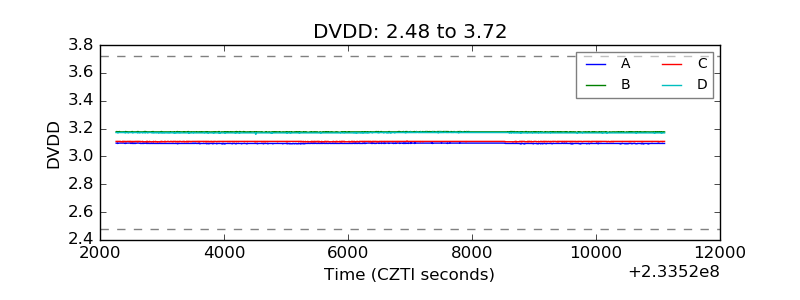 |
| Temperature 1 | 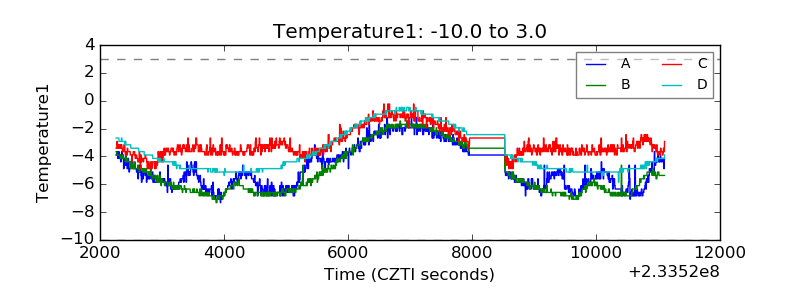 |
| Veto HV Monitor | 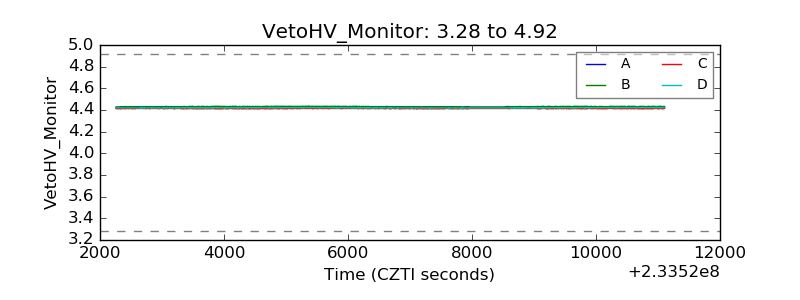 |
| Veto LLD | 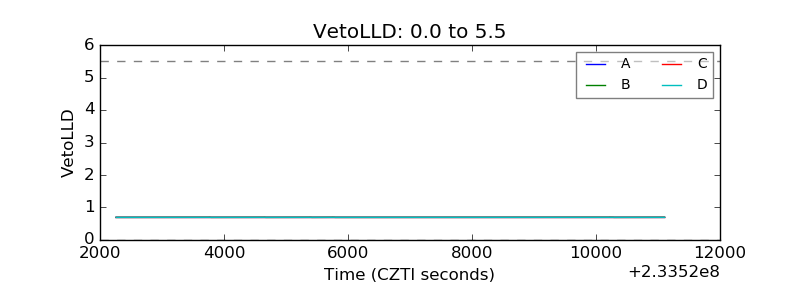 |
| Alpha Counter | 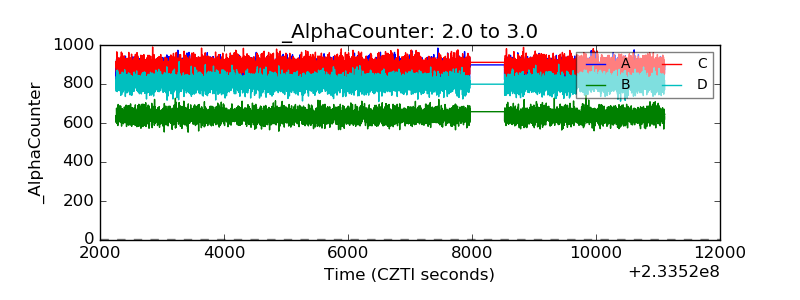 |
| _CPM_Rate | 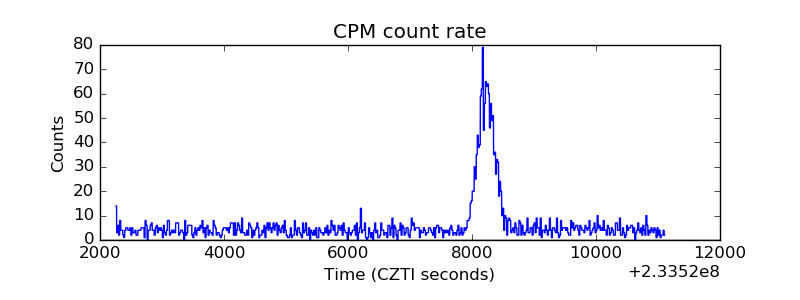 |
| CZT Counter | 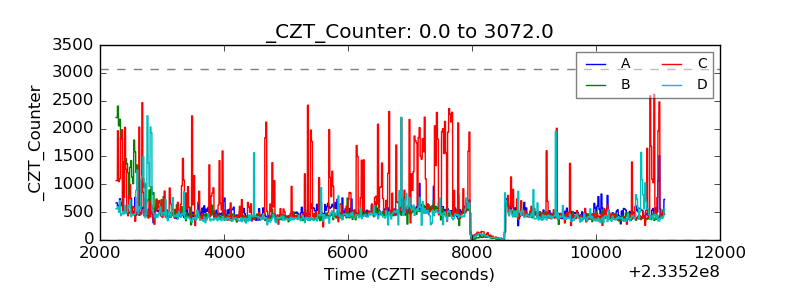 |
| +2.5 Volts monitor |  |
| +5 Volts monitor |  |
| _ROLL_ROT | 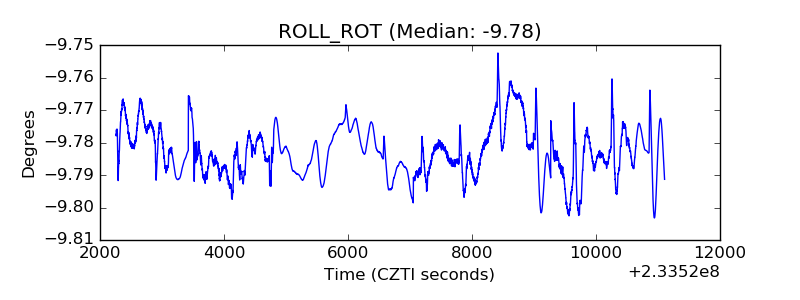 |
| _Roll_DEC | 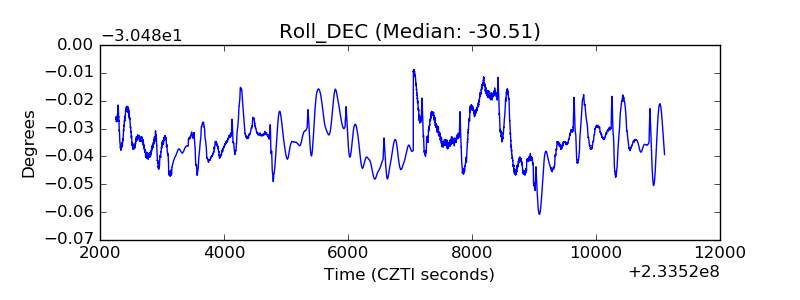 |
| _Roll_RA | 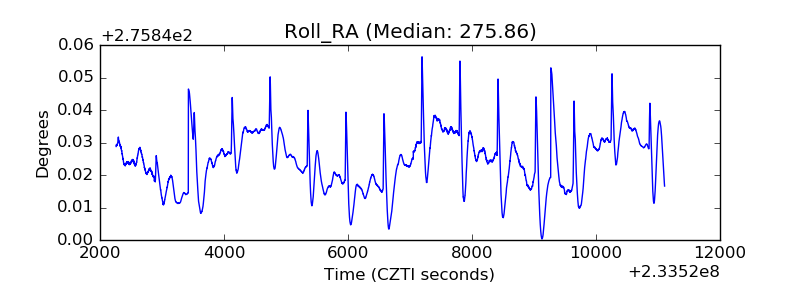 |
| Veto Counter | 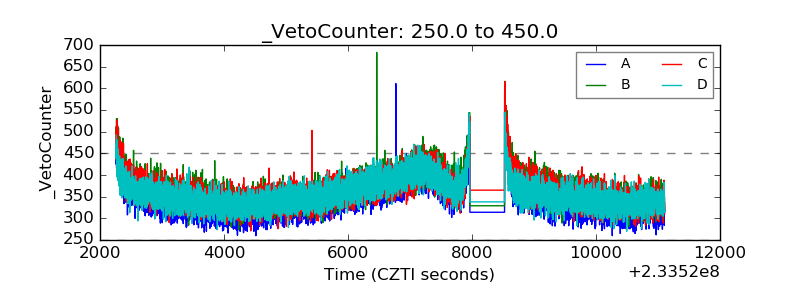 |