| Param | Original file | Final file |
|---|---|---|
| Filename | modeM0/AS1A03_107T01_9000001246_08985cztM0_level2.evt | modeM0/AS1A03_107T01_9000001246_08985cztM0_level2_quad_clean.evt |
| Size (bytes) | 1,543,452,480 | 246,064,320 |
| Size | 1.4 GB | 234.7 MB |
| Events in quadrant A | 9,741,479 | 1,557,020 |
| Events in quadrant B | 15,848,935 | 1,522,134 |
| Events in quadrant C | 10,668,602 | 1,545,798 |
| Events in quadrant D | 9,194,155 | 1,511,250 |
| Mode M9 | |||
|---|---|---|---|
| Quadrant | BADHDUFLAG | Total packets | Discarded packets |
| A | 0 | 12 | 0 |
| B | 0 | 12 | 0 |
| C | 0 | 12 | 0 |
| D | 0 | 12 | 0 |
| Mode M0 | |||
|---|---|---|---|
| Quadrant | BADHDUFLAG | Total packets | Discarded packets |
| A | 0 | 41330 | 5 |
| B | 0 | 60500 | 10 |
| C | 0 | 45248 | 5 |
| D | 0 | 41113 | 5 |
| Mode SS | |||
|---|---|---|---|
| Quadrant | BADHDUFLAG | Total packets | Discarded packets |
| A | 0 | 388 | 0 |
| B | 0 | 388 | 0 |
| C | 0 | 388 | 0 |
| D | 0 | 388 | 0 |
| Quadrant | Total seconds | Saturated seconds | Saturation percentage |
|---|---|---|---|
| A | 19103 | 184 | 0.963199% |
| B | 19102 | 3043 | 15.930269% |
| C | 19103 | 717 | 3.753337% |
| D | 19103 | 119 | 0.622939% |
Noise dominated data is calculated using 1-second bins in cleaned event files. If a bin has >2000 counts, and if more than 50% of those come from <1% of pixels, then it is considered to be noise-dominated and hence unusable.
| Quadrant | # 1 sec bins | Bins with >0 counts | Bins with >2000 counts | High rate bins dominated by noise | Noise dominated (total time) | Noise dominated (detector-on time) | Marked lightcurve |
|---|---|---|---|---|---|---|---|
| A | 20294 | 19109 | 43 | 43 | 0.21% | 0.23% | 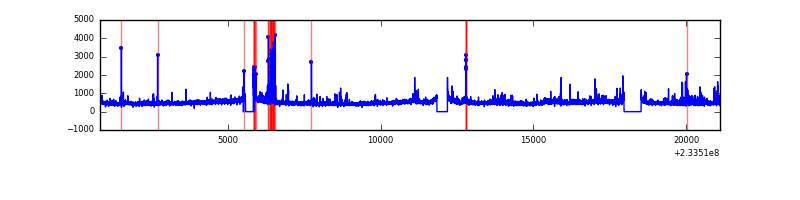 |
| B | 20294 | 19107 | 2010 | 2010 | 9.90% | 10.52% | 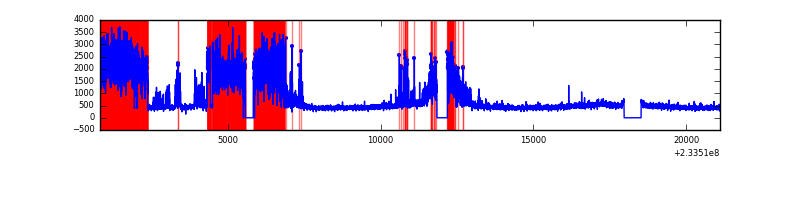 |
| C | 20294 | 19109 | 412 | 412 | 2.03% | 2.16% | 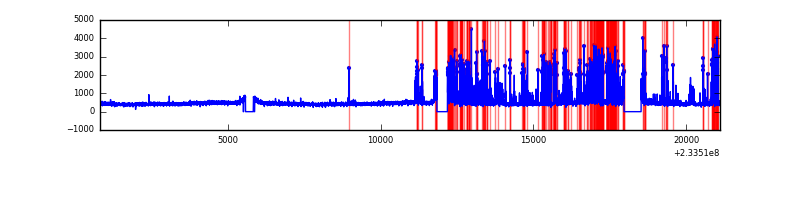 |
| D | 20294 | 19109 | 68 | 68 | 0.34% | 0.36% | 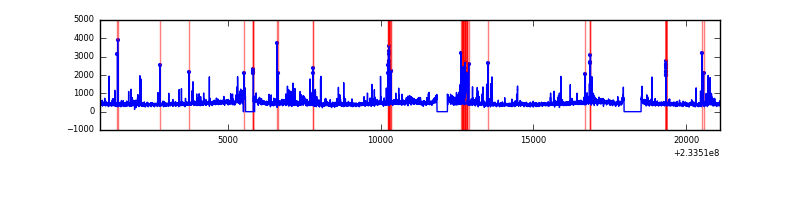 |
Top three noisy pixels from each quadrant. If the there are fewer than three noisy pixels in the level2.evt file, extra rows are filled as -1
| Pixel properties | Quadrant properties | ||||||
|---|---|---|---|---|---|---|---|
| Quadrant | DetID | PixID | Counts | Sigma | Mean | Median | Sigma |
| A | 8 | 5 | 1015553 | 2277.71 | 2196 | 2146 | 444.9 |
| A | 5 | 16 | 241089 | 537.04 | 2196 | 2146 | 444.9 |
| A | 3 | 1 | 20950 | 42.26 | 2196 | 2146 | 444.9 |
| B | 0 | 85 | 7306859 | 18214.0 | 2106 | 2054 | 401.1 |
| B | 4 | 173 | 144799 | 355.92 | 2106 | 2054 | 401.1 |
| B | 4 | 48 | 76843 | 186.48 | 2106 | 2054 | 401.1 |
| C | 4 | 254 | 2359491 | 4787.43 | 2126 | 2134 | 492.4 |
| C | 4 | 238 | 18391 | 33.02 | 2126 | 2134 | 492.4 |
| C | 13 | 61 | 15875 | 27.91 | 2126 | 2134 | 492.4 |
| D | 13 | 29 | 315107 | 547.57 | 2132 | 2079 | 571.7 |
| D | 1 | 52 | 306567 | 532.63 | 2132 | 2079 | 571.7 |
| D | 2 | 14 | 210751 | 365.02 | 2132 | 2079 | 571.7 |
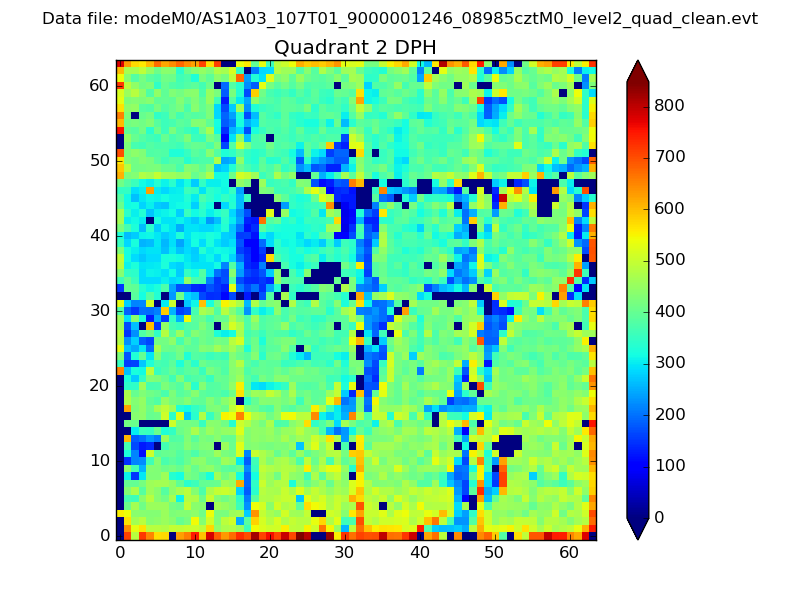
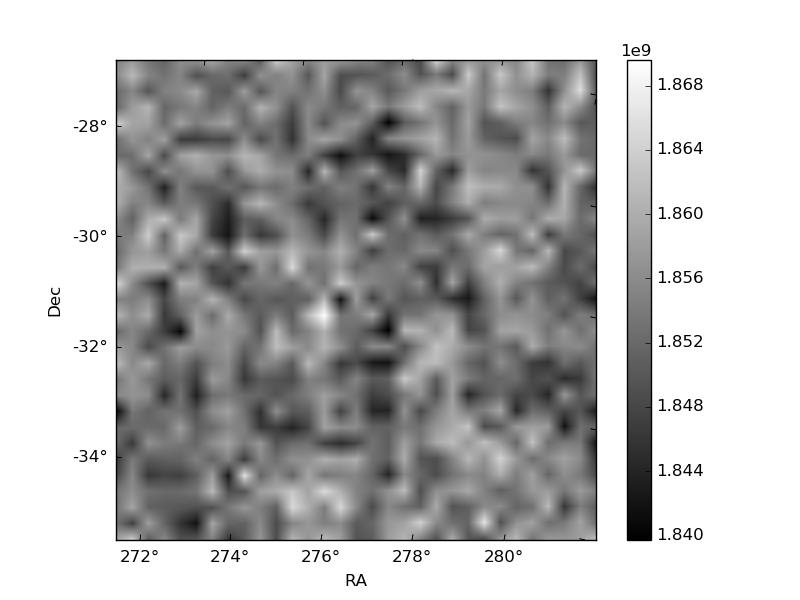
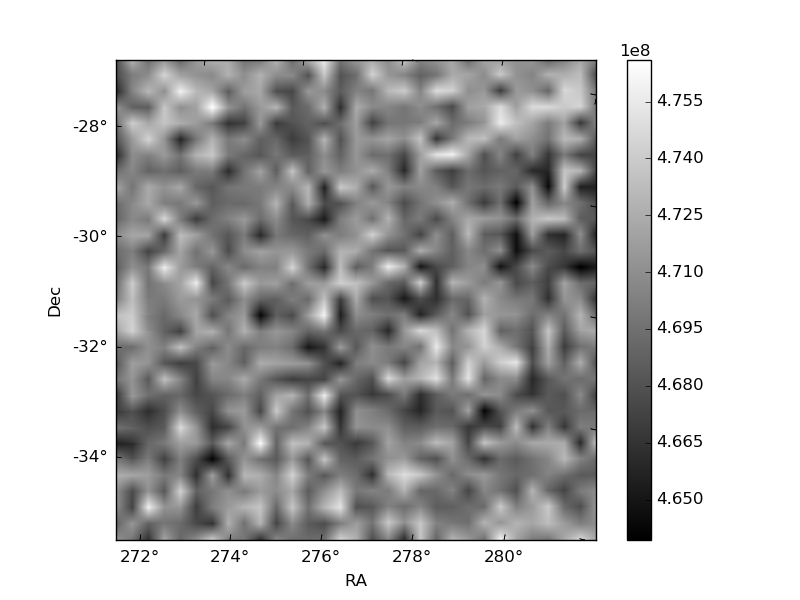
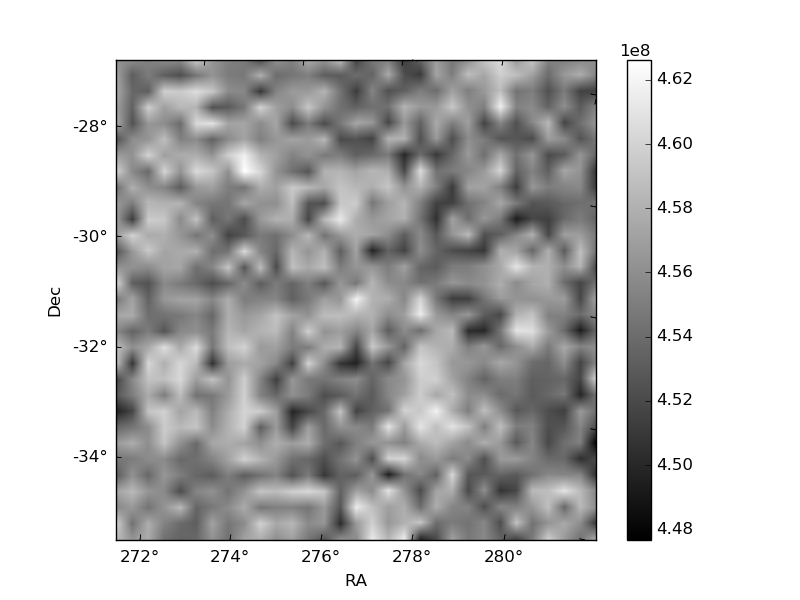
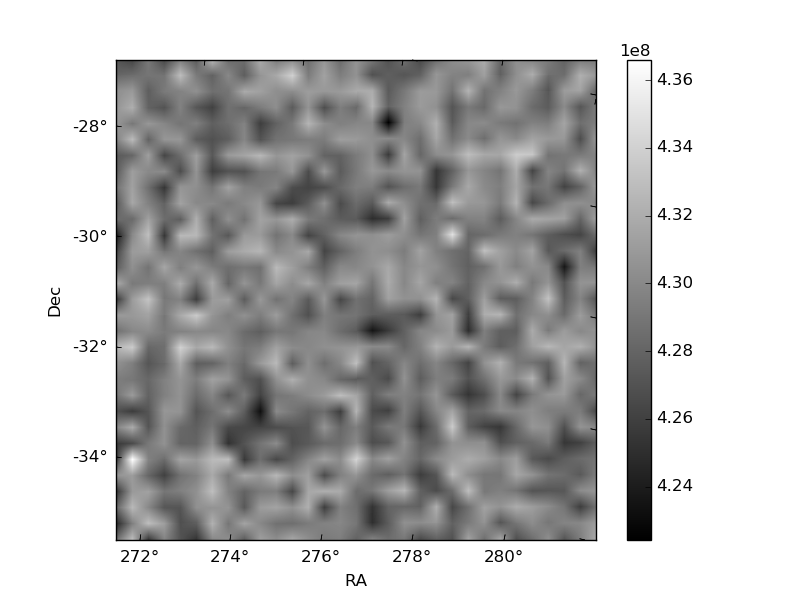
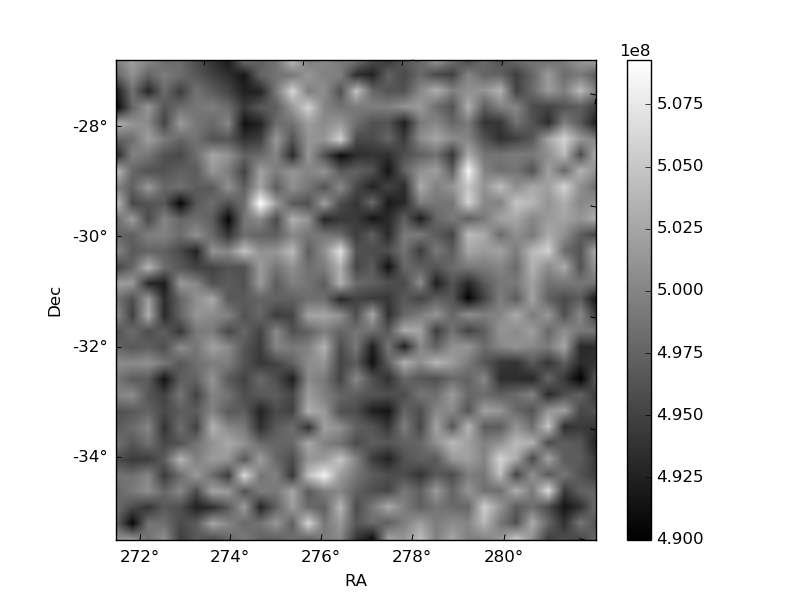
Histogram calculated using DETX and DETY for each event in the final _common_clean file
| Quadrant A | 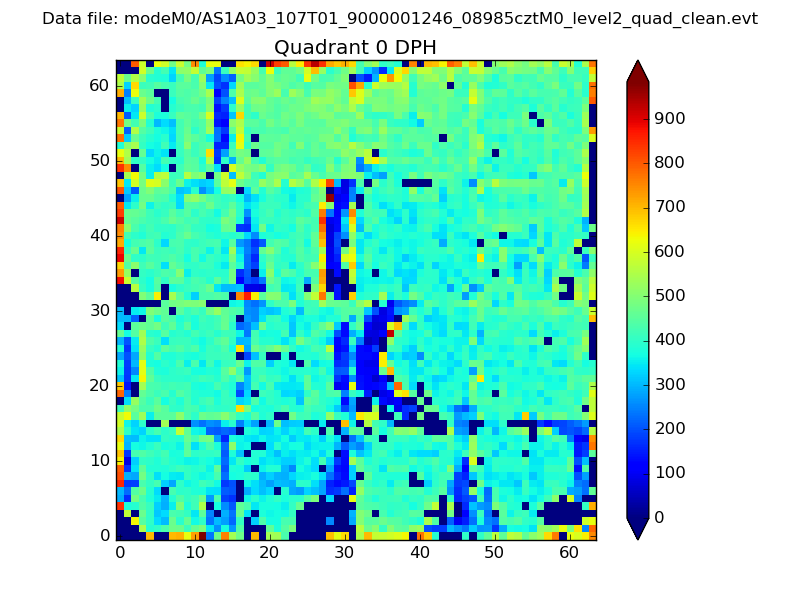 |
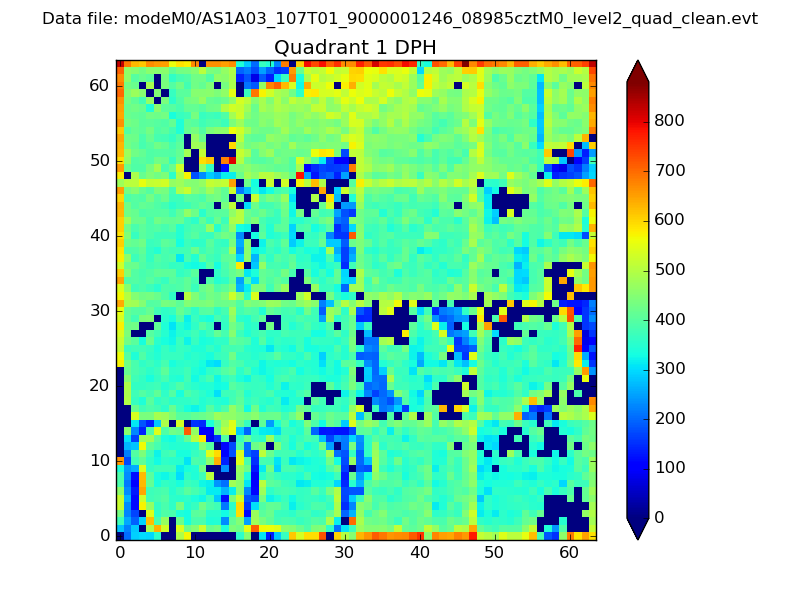 |
Quadrant B |
|---|---|---|---|
| Quadrant D | 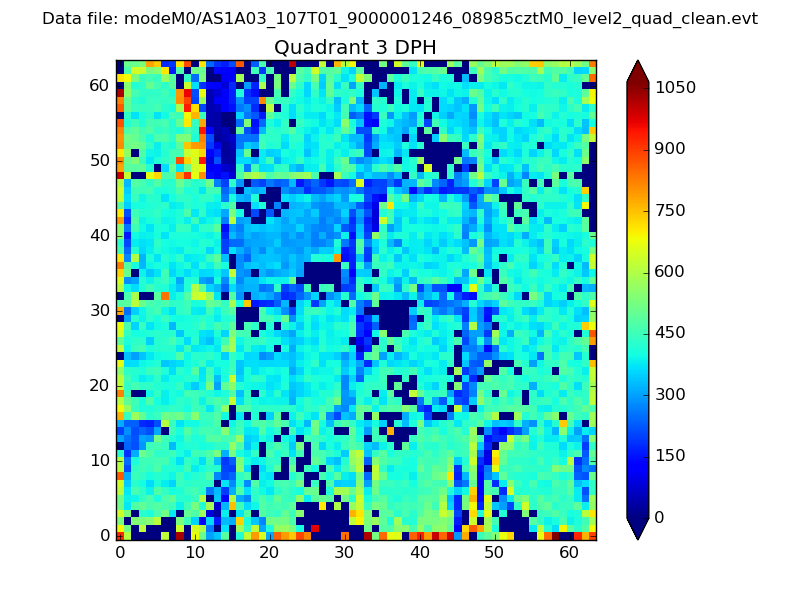 |
 |
Quadrant C |
| Plot type | Count rate plots | Images |
|---|---|---|
| Comparison with Poisson distribution Blue bars denote a histogram of data divided into 1 sec bins. Red curve is a Poisson curve with rate = median count rate of data. |
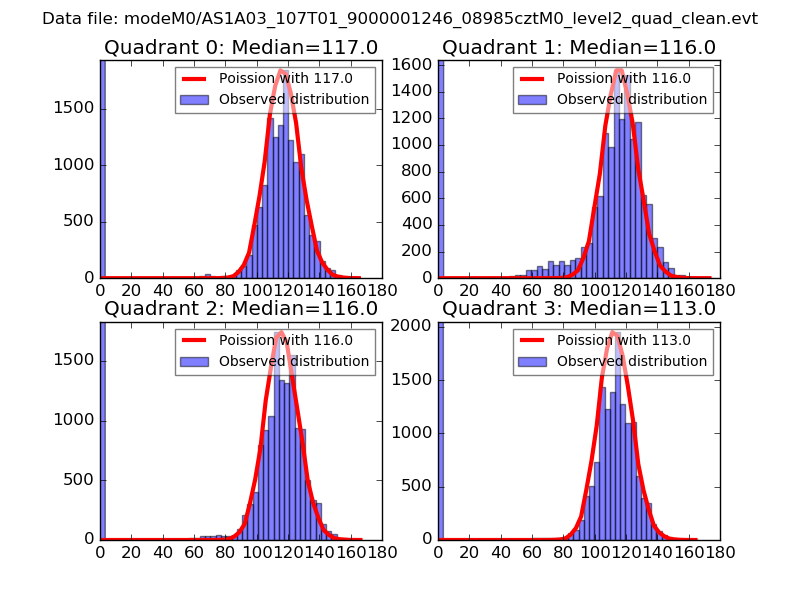 |
 |
| Quadrant-wise count rates Data is divided into 100 sec bins |
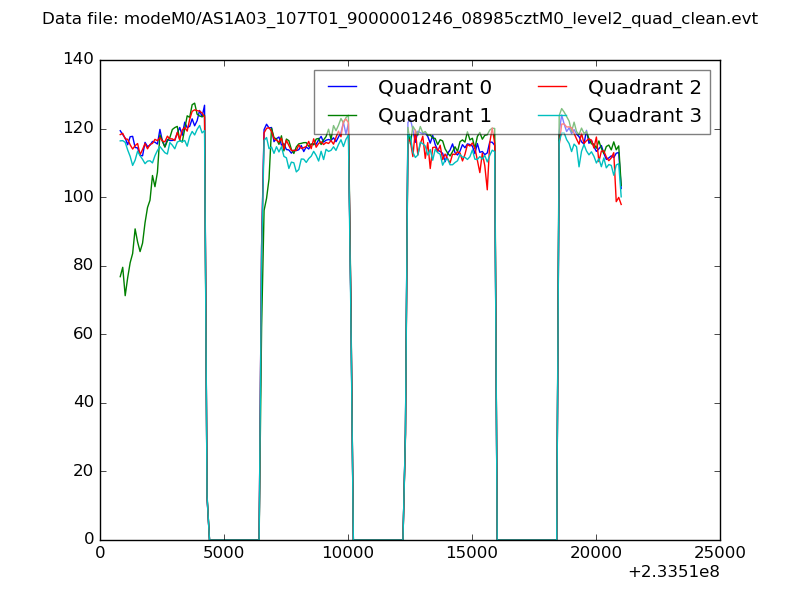 |
|
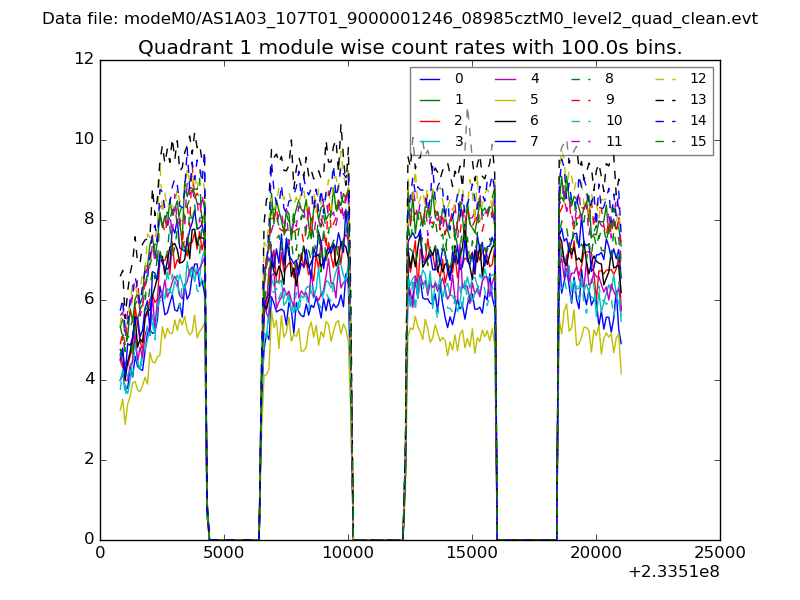
| Module-wise count rates for Quadrant A Data is divided into 100 sec bins |
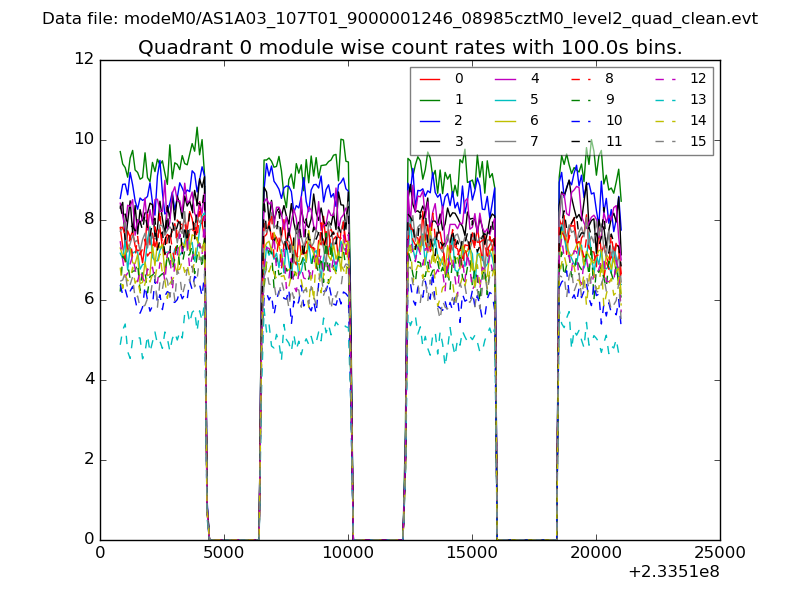 |
 |
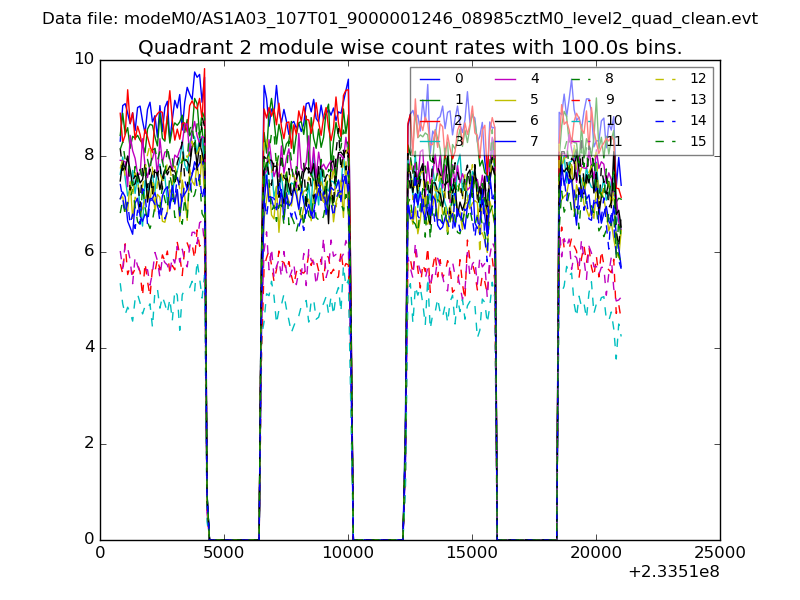
| Module-wise count rates for Quadrant B Data is divided into 100 sec bins |
 |
 |
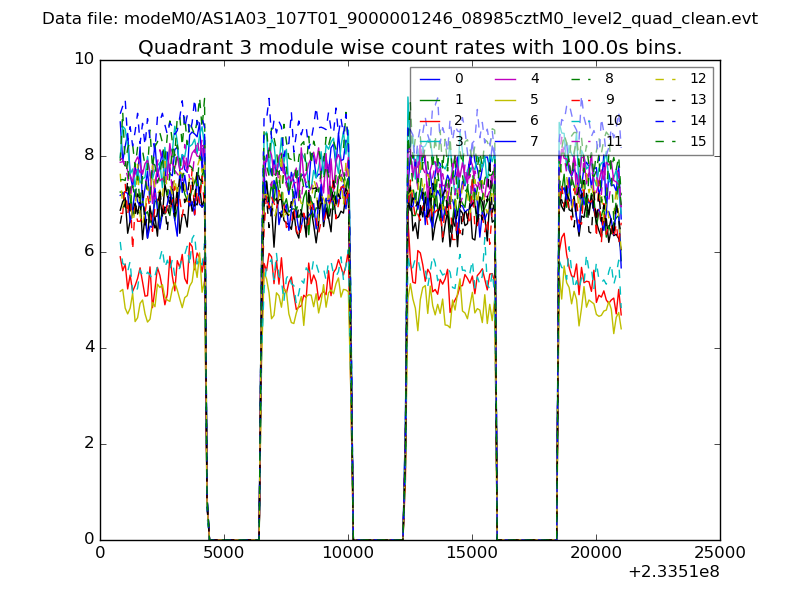
| Module-wise count rates for Quadrant C Data is divided into 100 sec bins |
 |
 |
| Module-wise count rates for Quadrant D Data is divided into 100 sec bins |
 |
 |
| Parameter | Plot |
|---|---|
| CZT HV Monitor | 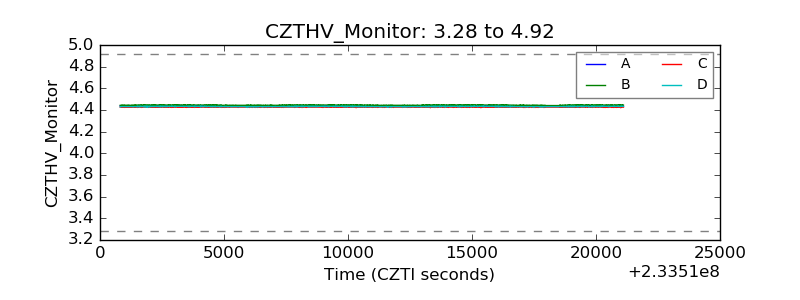 |
| D_VDD | 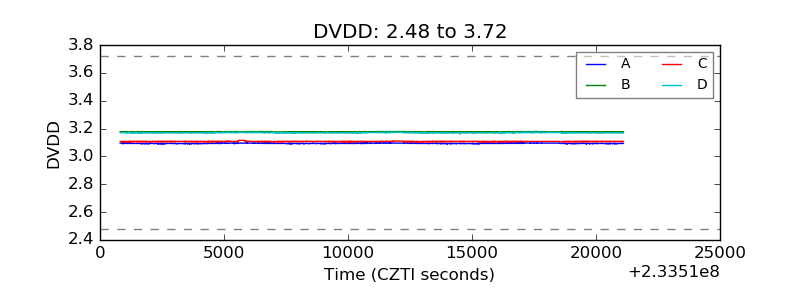 |
| Temperature 1 | 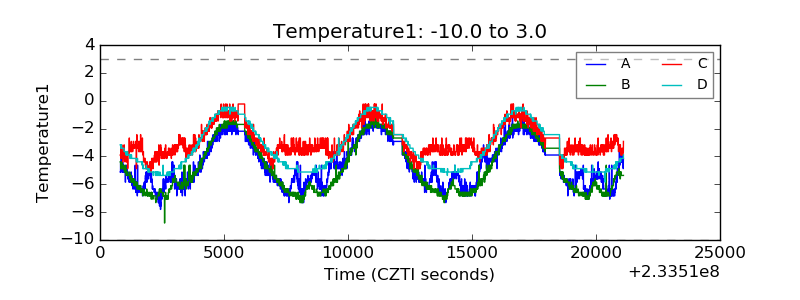 |
| Veto HV Monitor |  |
| Veto LLD | 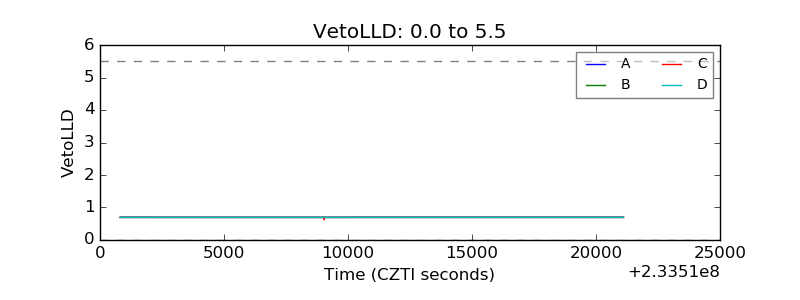 |
| Alpha Counter | 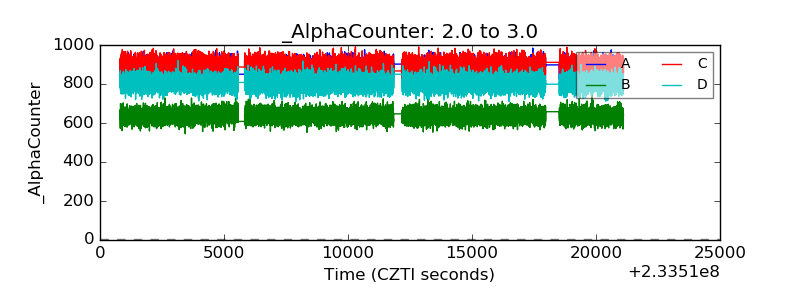 |
| _CPM_Rate | 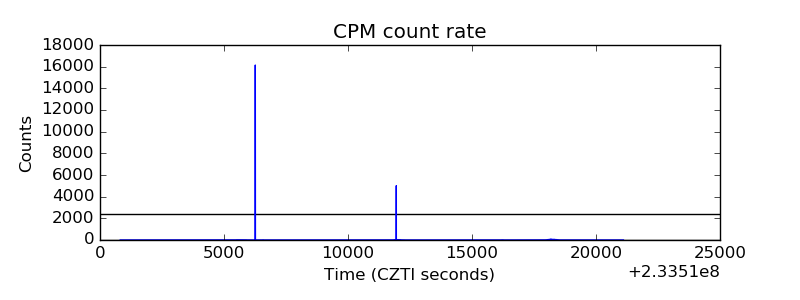 |
| CZT Counter | 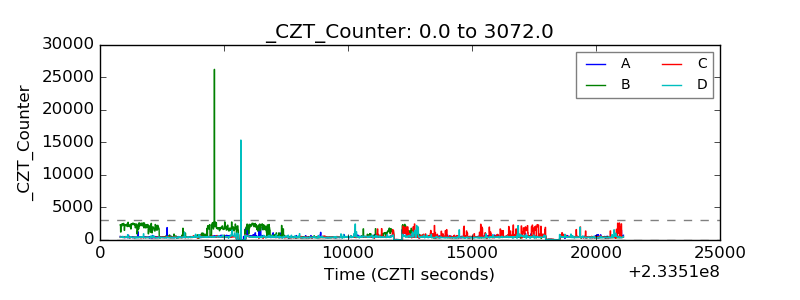 |
| +2.5 Volts monitor |  |
| +5 Volts monitor |  |
| _ROLL_ROT | 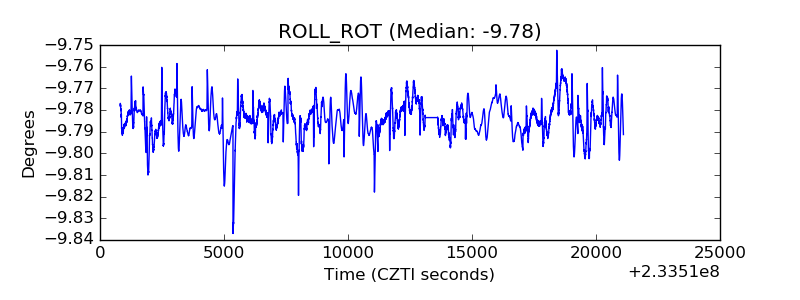 |
| _Roll_DEC |  |
| _Roll_RA | 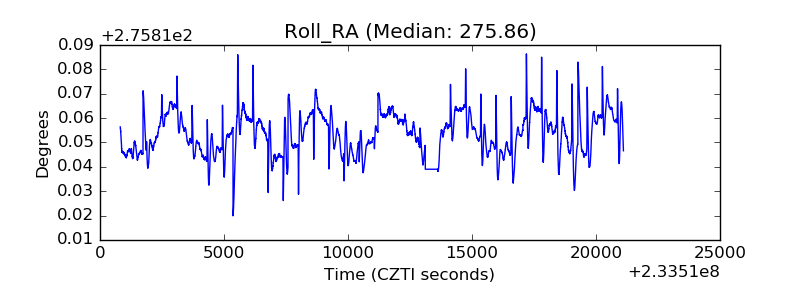 |
| Veto Counter | 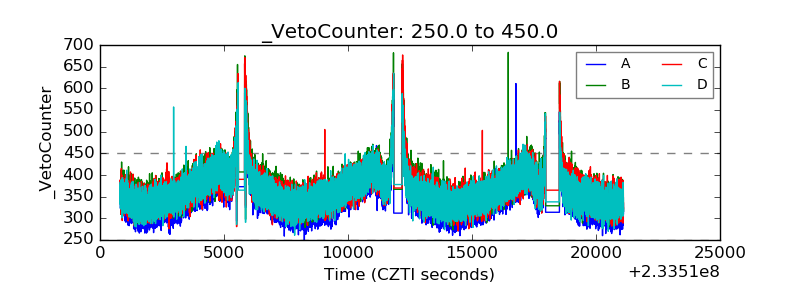 |