| Param | Original file | Final file |
|---|---|---|
| Filename | modeM0/AS1C02_037T01_9000001252_08994cztM0_level2.evt | modeM0/AS1C02_037T01_9000001252_08994cztM0_level2_quad_clean.evt |
| Size (bytes) | 50,852,160 | 11,338,560 |
| Size | 48.5 MB | 10.8 MB |
| Events in quadrant A | 400,207 | 70,394 |
| Events in quadrant B | 373,797 | 70,467 |
| Events in quadrant C | 330,685 | 70,127 |
| Events in quadrant D | 377,375 | 68,399 |
| Mode SS | |||
|---|---|---|---|
| Quadrant | BADHDUFLAG | Total packets | Discarded packets |
| A | 0 | 16 | 0 |
| B | 0 | 16 | 0 |
| C | 0 | 16 | 0 |
| D | 0 | 16 | 0 |
| Mode M0 | |||
|---|---|---|---|
| Quadrant | BADHDUFLAG | Total packets | Discarded packets |
| A | 0 | 1729 | 1 |
| B | 0 | 1653 | 2 |
| C | 0 | 1608 | 4 |
| D | 0 | 1723 | 5 |
| Quadrant | Total seconds | Saturated seconds | Saturation percentage |
|---|---|---|---|
| A | 802 | 0 | 0.000000% |
| B | 801 | 0 | 0.000000% |
| C | 800 | 0 | 0.000000% |
| D | 800 | 0 | 0.000000% |
Noise dominated data is calculated using 1-second bins in cleaned event files. If a bin has >2000 counts, and if more than 50% of those come from <1% of pixels, then it is considered to be noise-dominated and hence unusable.
| Quadrant | # 1 sec bins | Bins with >0 counts | Bins with >2000 counts | High rate bins dominated by noise | Noise dominated (total time) | Noise dominated (detector-on time) | Marked lightcurve |
|---|---|---|---|---|---|---|---|
| A | 802 | 802 | 0 | 0 | 0.00% | 0.00% | 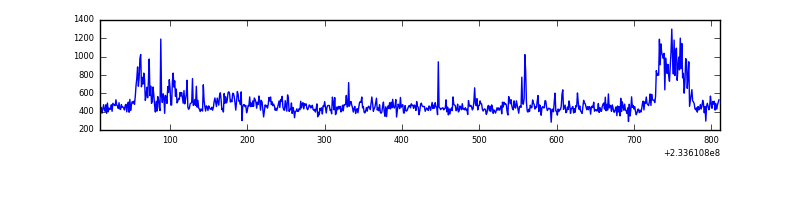 |
| B | 802 | 802 | 0 | 0 | 0.00% | 0.00% | 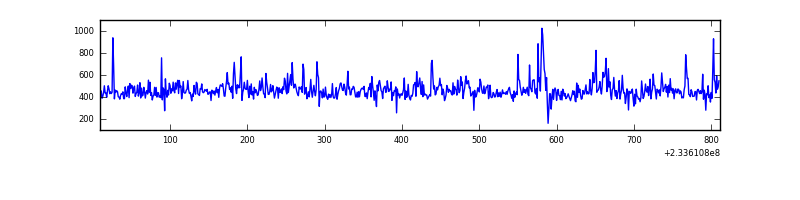 |
| C | 802 | 802 | 0 | 0 | 0.00% | 0.00% | 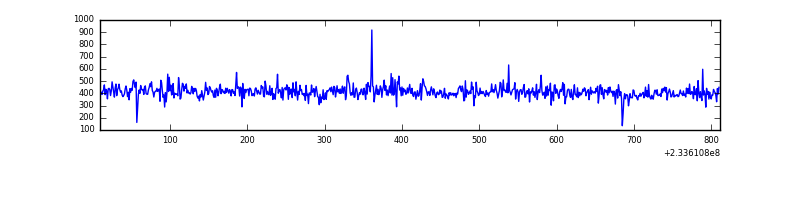 |
| D | 802 | 802 | 0 | 0 | 0.00% | 0.00% | 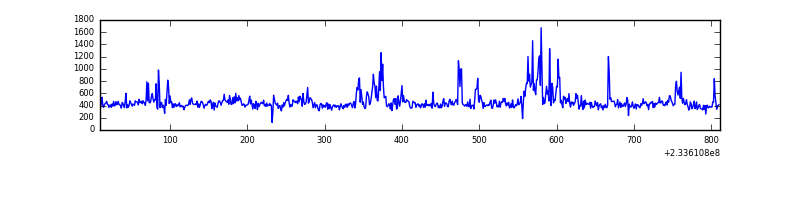 |
Top three noisy pixels from each quadrant. If the there are fewer than three noisy pixels in the level2.evt file, extra rows are filled as -1
| Pixel properties | Quadrant properties | ||||||
|---|---|---|---|---|---|---|---|
| Quadrant | DetID | PixID | Counts | Sigma | Mean | Median | Sigma |
| A | 8 | 5 | 69946 | 3559.54 | 84 | 82 | 19.6 |
| A | 3 | 1 | 3030 | 150.2 | 84 | 82 | 19.6 |
| A | 15 | 174 | 958 | 44.63 | 84 | 82 | 19.6 |
| B | 4 | 173 | 9983 | 520.28 | 86 | 84 | 19.0 |
| B | 10 | 16 | 7298 | 379.16 | 86 | 84 | 19.0 |
| B | 0 | 214 | 6490 | 336.69 | 86 | 84 | 19.0 |
| C | 1 | 3 | 1553 | 67.74 | 83 | 84 | 21.7 |
| C | 8 | 128 | 1358 | 58.75 | 83 | 84 | 21.7 |
| C | 8 | 112 | 815 | 33.71 | 83 | 84 | 21.7 |
| D | 6 | 225 | 37164 | 1669.75 | 82 | 80 | 22.2 |
| D | 2 | 14 | 18021 | 807.81 | 82 | 80 | 22.2 |
| D | 2 | 234 | 3257 | 143.05 | 82 | 80 | 22.2 |
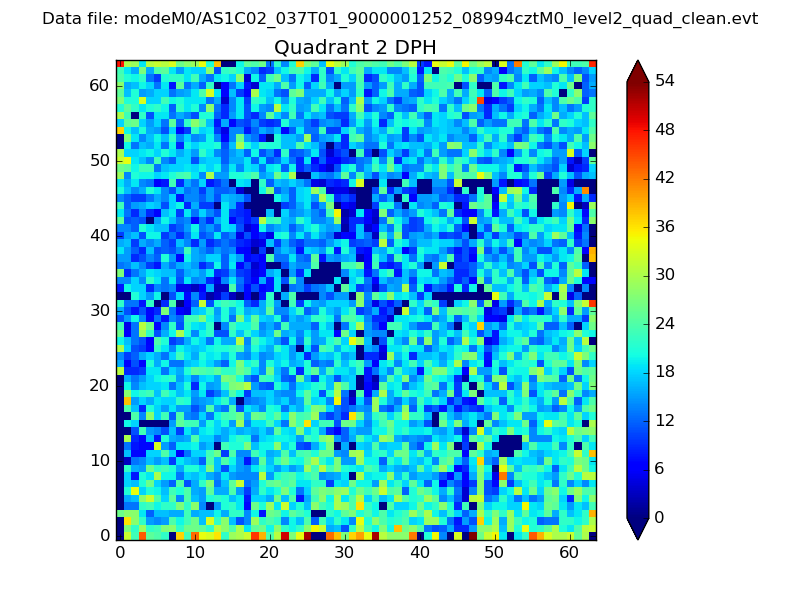
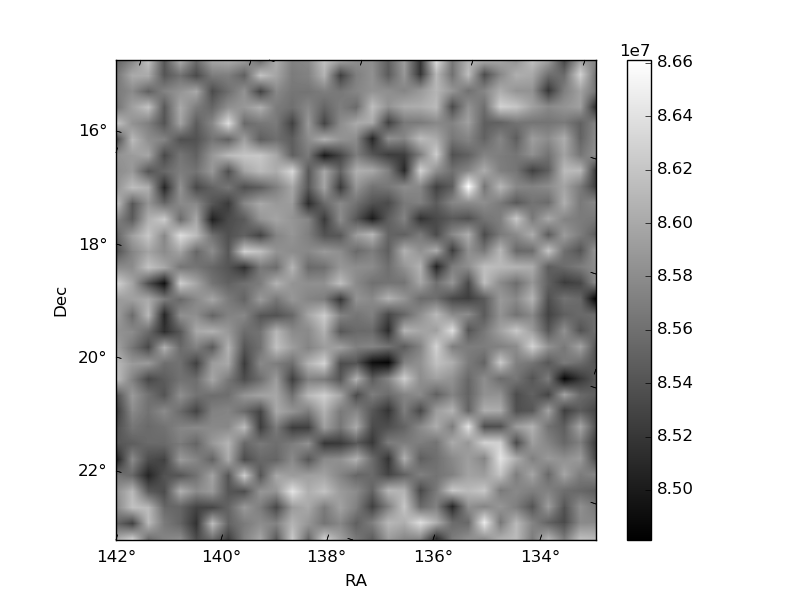
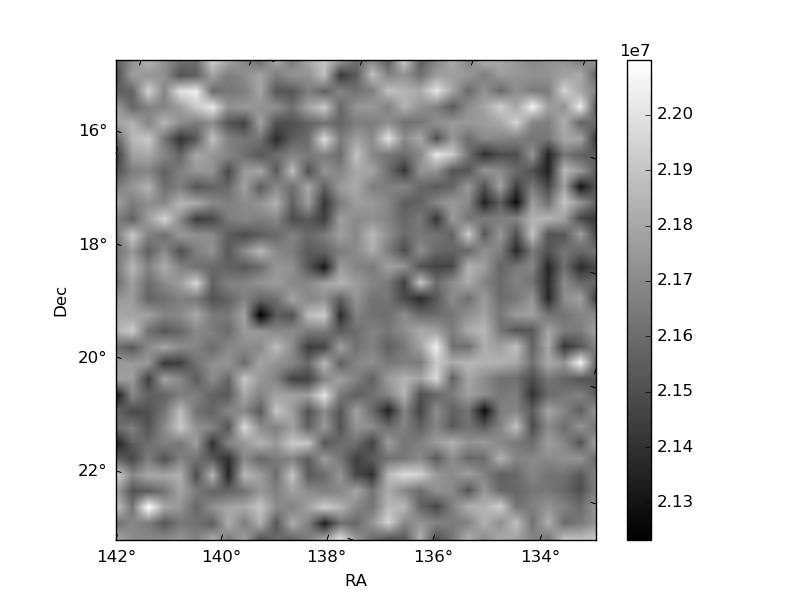
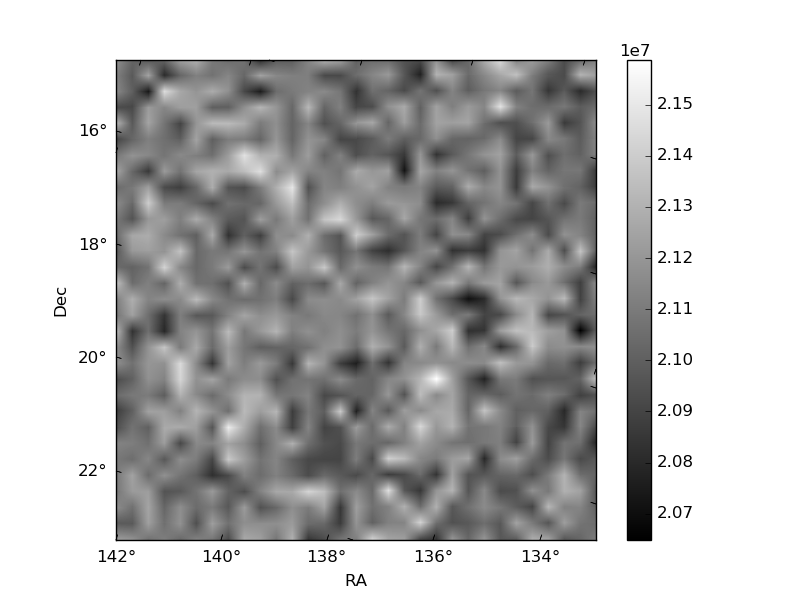
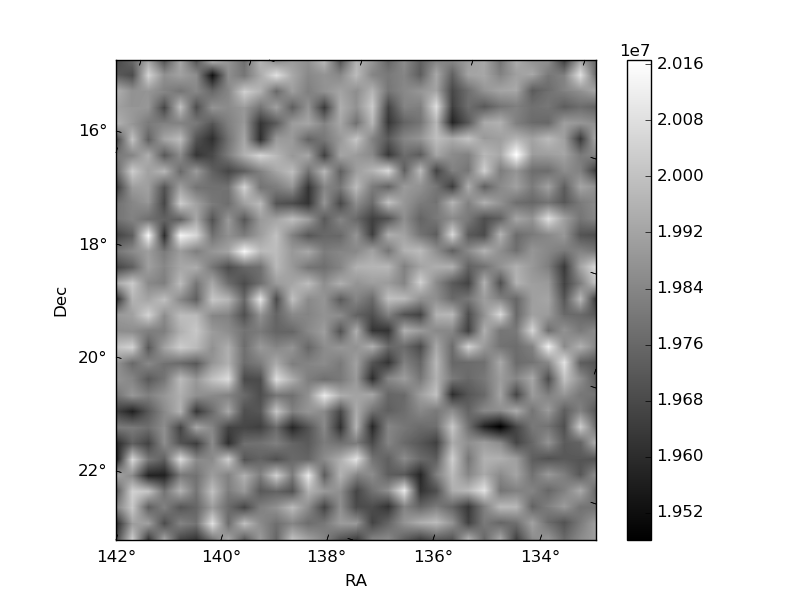
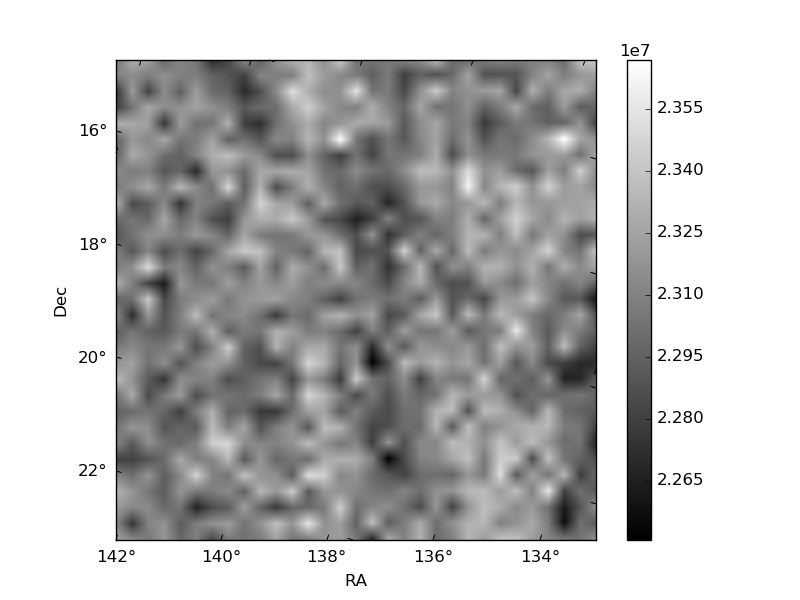
Histogram calculated using DETX and DETY for each event in the final _common_clean file
| Quadrant A | 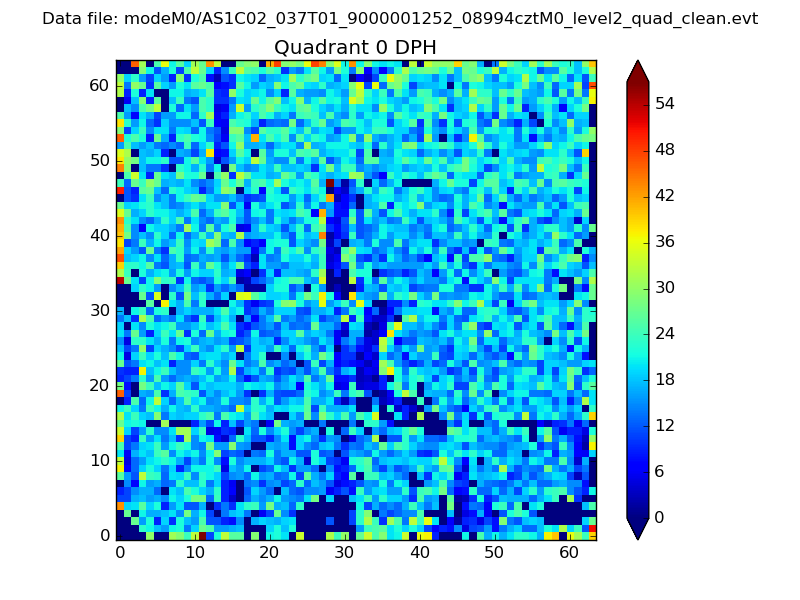 |
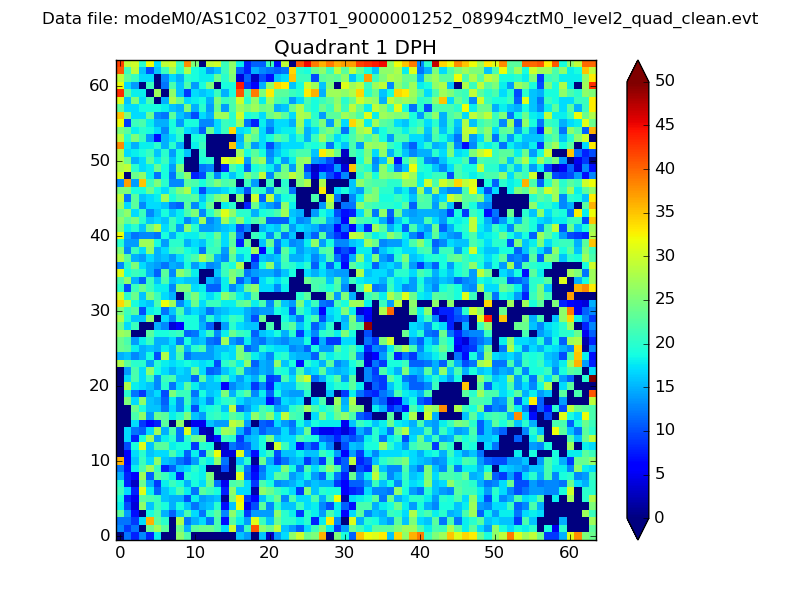 |
Quadrant B |
|---|---|---|---|
| Quadrant D | 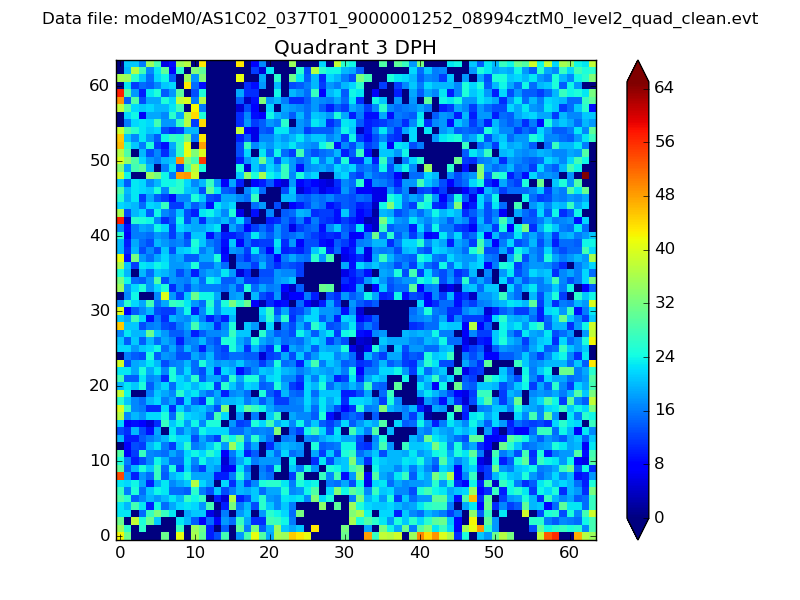 |
 |
Quadrant C |
| Plot type | Count rate plots | Images |
|---|---|---|
| Comparison with Poisson distribution Blue bars denote a histogram of data divided into 1 sec bins. Red curve is a Poisson curve with rate = median count rate of data. |
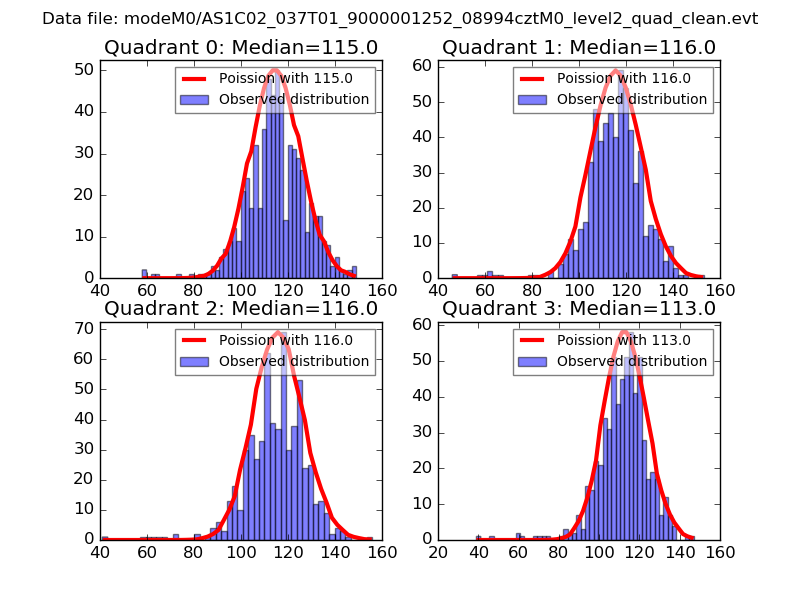 |
 |
| Quadrant-wise count rates Data is divided into 100 sec bins |
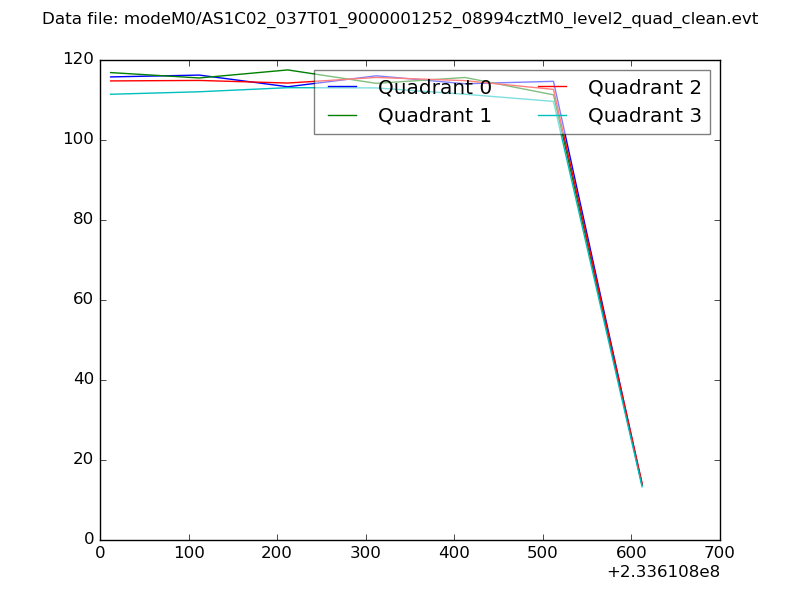 |
|
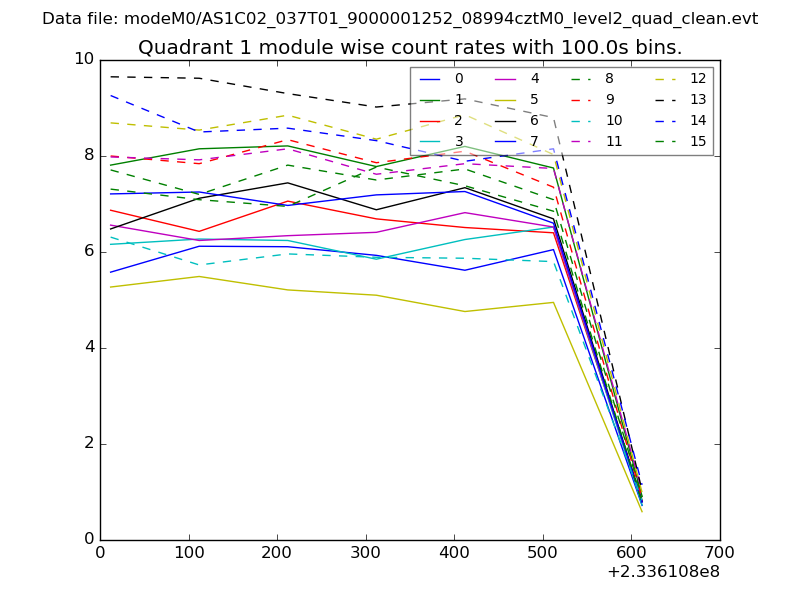
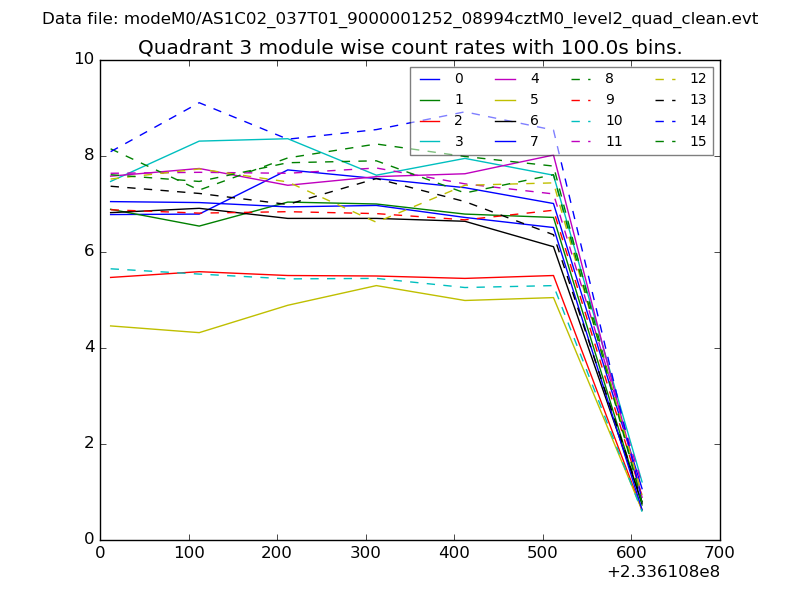
| Module-wise count rates for Quadrant A Data is divided into 100 sec bins |
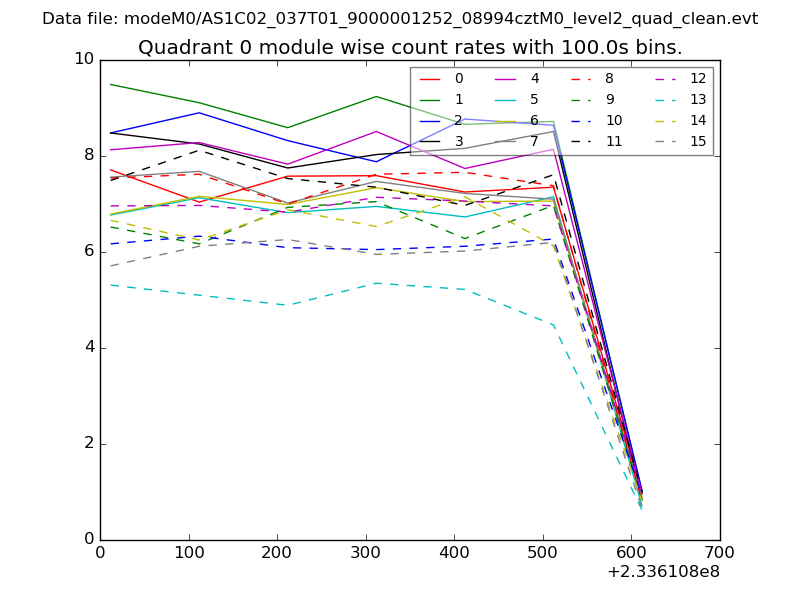 |
 |
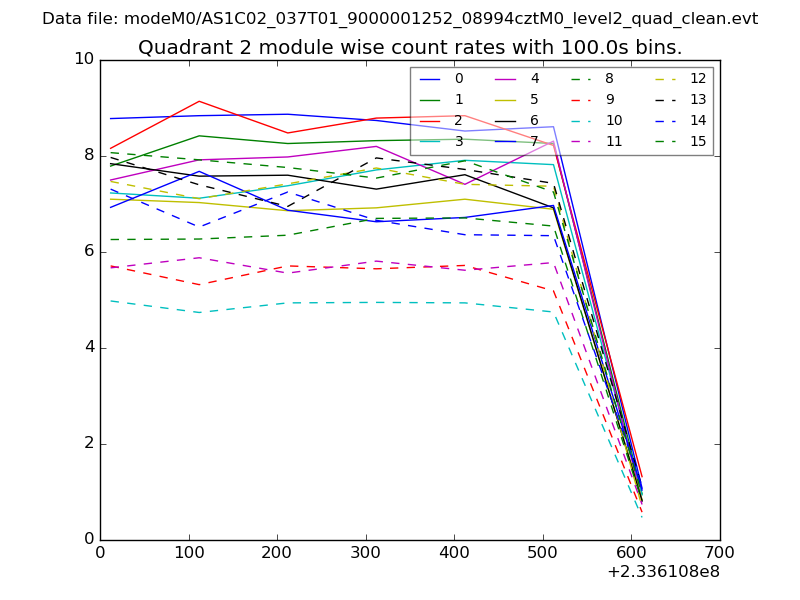
| Module-wise count rates for Quadrant B Data is divided into 100 sec bins |
 |
 |
| Module-wise count rates for Quadrant C Data is divided into 100 sec bins |
 |
 |
| Module-wise count rates for Quadrant D Data is divided into 100 sec bins |
 |
 |
| Parameter | Plot |
|---|---|
| CZT HV Monitor | 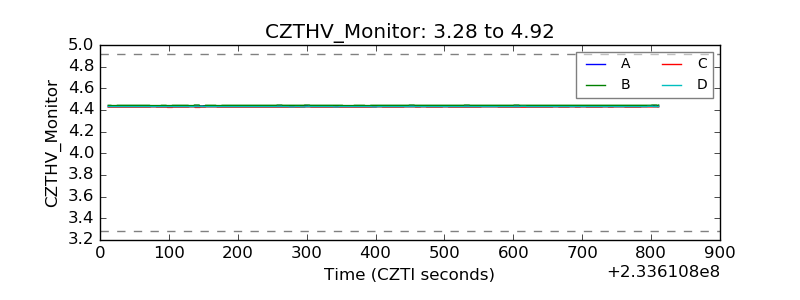 |
| D_VDD | 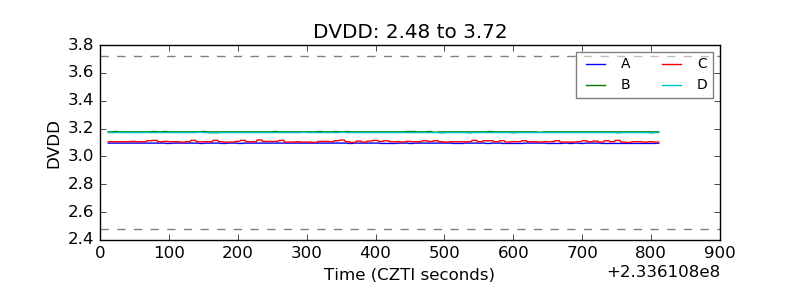 |
| Temperature 1 | 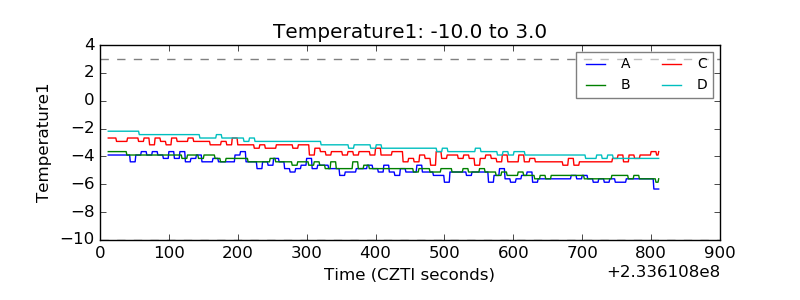 |
| Veto HV Monitor |  |
| Veto LLD | 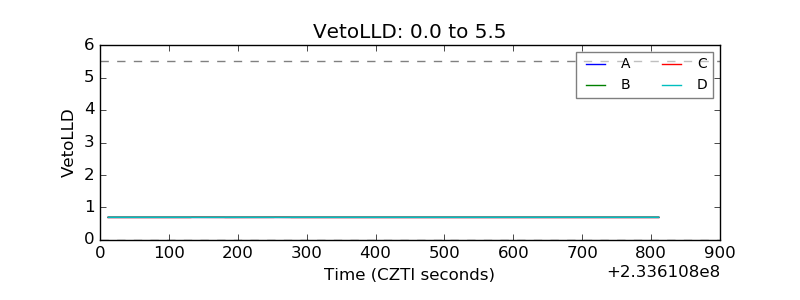 |
| Alpha Counter | 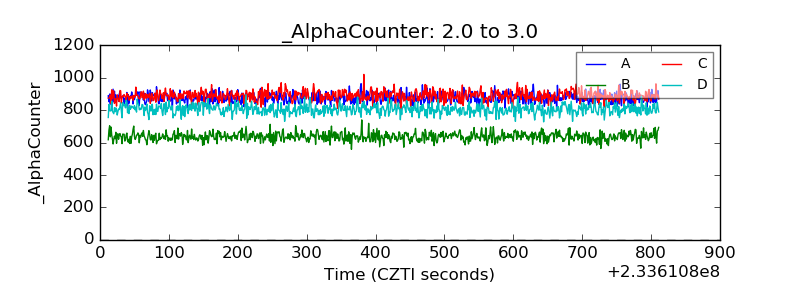 |
| _CPM_Rate | 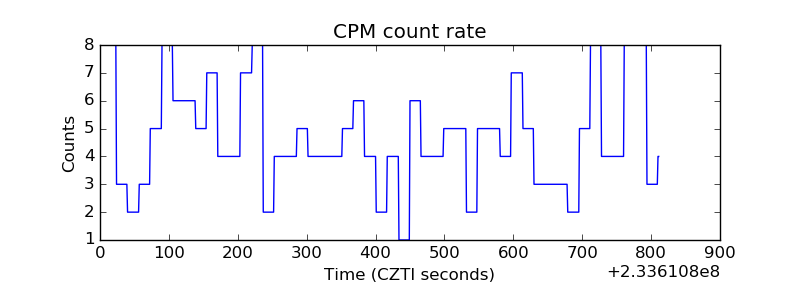 |
| CZT Counter | 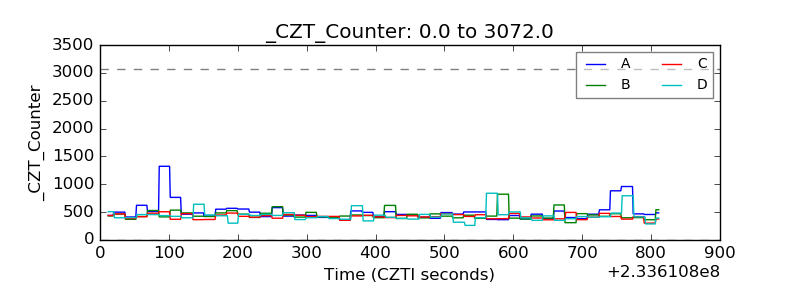 |
| +2.5 Volts monitor |  |
| +5 Volts monitor |  |
| _ROLL_ROT | 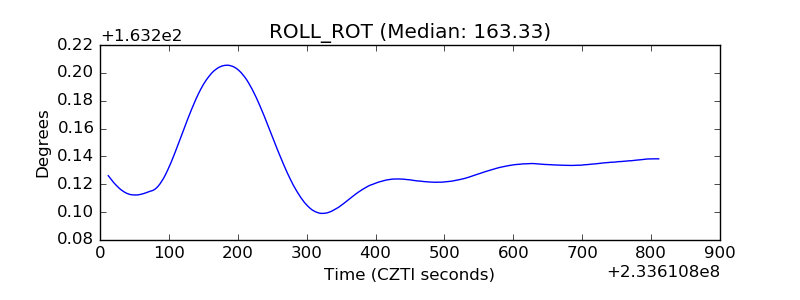 |
| _Roll_DEC | 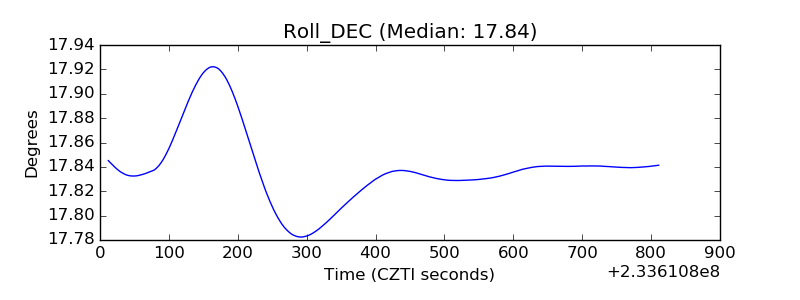 |
| _Roll_RA | 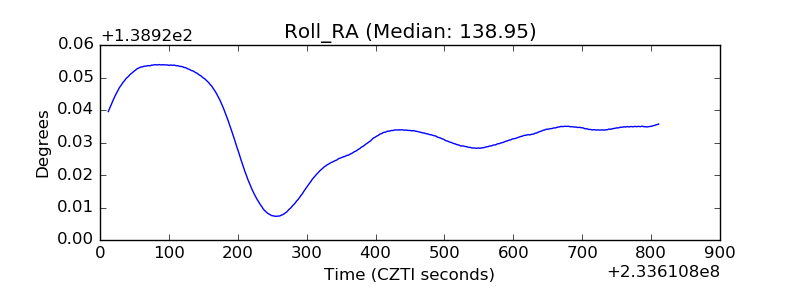 |
| Veto Counter | 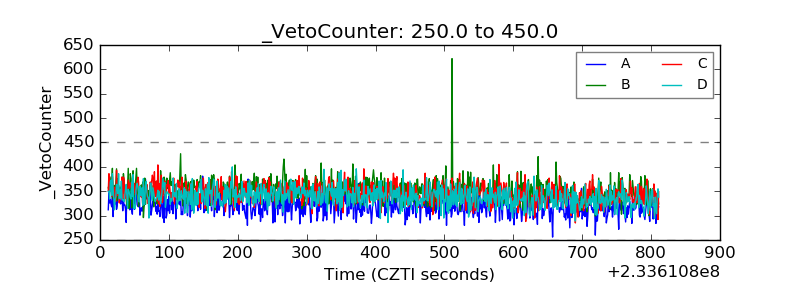 |