| Param | Original file | Final file |
|---|---|---|
| Filename | modeM0/AS1C02_037T01_9000001252_08996cztM0_level2.evt | modeM0/AS1C02_037T01_9000001252_08996cztM0_level2_quad_clean.evt |
| Size (bytes) | 821,520,000 | 127,984,320 |
| Size | 783.5 MB | 122.1 MB |
| Events in quadrant A | 7,210,854 | 765,797 |
| Events in quadrant B | 5,888,958 | 780,506 |
| Events in quadrant C | 5,190,804 | 772,359 |
| Events in quadrant D | 5,795,043 | 746,136 |
| Mode SS | |||
|---|---|---|---|
| Quadrant | BADHDUFLAG | Total packets | Discarded packets |
| A | 0 | 242 | 2 |
| B | 0 | 241 | 4 |
| C | 0 | 242 | 6 |
| D | 0 | 242 | 0 |
| Mode M0 | |||
|---|---|---|---|
| Quadrant | BADHDUFLAG | Total packets | Discarded packets |
| A | 0 | 30439 | 1055 |
| B | 0 | 25884 | 651 |
| C | 0 | 24259 | 486 |
| D | 0 | 25964 | 599 |
| Mode M9 | |||
|---|---|---|---|
| Quadrant | BADHDUFLAG | Total packets | Discarded packets |
| A | 0 | 14 | 1 |
| B | 0 | 14 | 0 |
| C | 0 | 14 | 0 |
| D | 0 | 14 | 0 |
| Quadrant | Total seconds | Saturated seconds | Saturation percentage |
|---|---|---|---|
| A | 11661 | 134 | 1.149130% |
| B | 11726 | 104 | 0.886918% |
| C | 11759 | 29 | 0.246620% |
| D | 11746 | 117 | 0.996084% |
Noise dominated data is calculated using 1-second bins in cleaned event files. If a bin has >2000 counts, and if more than 50% of those come from <1% of pixels, then it is considered to be noise-dominated and hence unusable.
| Quadrant | # 1 sec bins | Bins with >0 counts | Bins with >2000 counts | High rate bins dominated by noise | Noise dominated (total time) | Noise dominated (detector-on time) | Marked lightcurve |
|---|---|---|---|---|---|---|---|
| A | 13366 | 11922 | 45 | 45 | 0.34% | 0.38% | 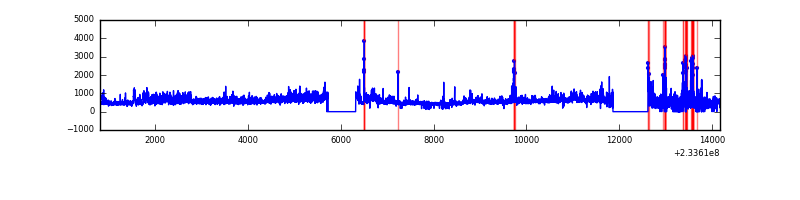 |
| B | 13366 | 11947 | 15 | 15 | 0.11% | 0.13% | 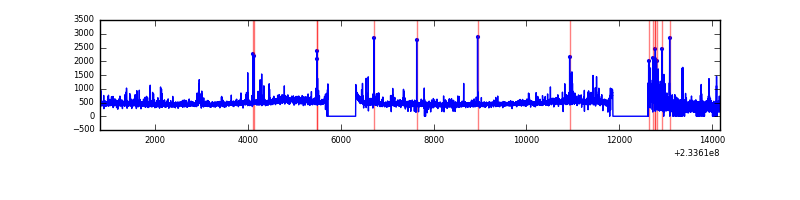 |
| C | 13366 | 11951 | 0 | 0 | 0.00% | 0.00% | 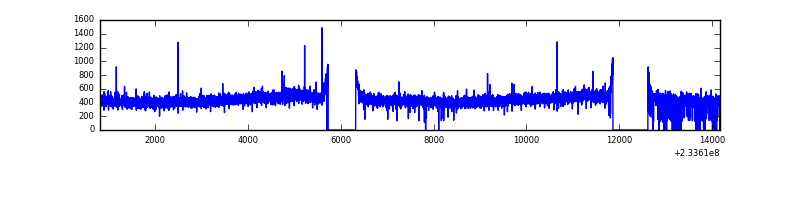 |
| D | 13366 | 11965 | 78 | 78 | 0.58% | 0.65% | 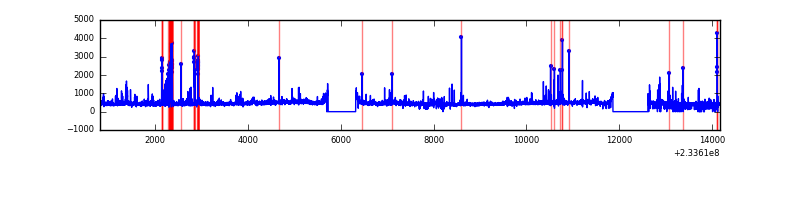 |
Top three noisy pixels from each quadrant. If the there are fewer than three noisy pixels in the level2.evt file, extra rows are filled as -1
| Pixel properties | Quadrant properties | ||||||
|---|---|---|---|---|---|---|---|
| Quadrant | DetID | PixID | Counts | Sigma | Mean | Median | Sigma |
| A | 8 | 5 | 1783306 | 6490.65 | 1348 | 1319 | 274.5 |
| A | 3 | 1 | 139339 | 502.72 | 1348 | 1319 | 274.5 |
| A | 5 | 16 | 61752 | 220.12 | 1348 | 1319 | 274.5 |
| B | 4 | 173 | 127775 | 478.53 | 1370 | 1336 | 264.2 |
| B | 4 | 48 | 95098 | 354.86 | 1370 | 1336 | 264.2 |
| B | 0 | 214 | 84402 | 314.38 | 1370 | 1336 | 264.2 |
| C | 13 | 61 | 10056 | 28.31 | 1325 | 1333 | 308.1 |
| C | 1 | 3 | 8021 | 21.71 | 1325 | 1333 | 308.1 |
| C | 14 | 67 | 6434 | 16.56 | 1325 | 1333 | 308.1 |
| D | 2 | 14 | 302049 | 918.38 | 1319 | 1278 | 327.5 |
| D | 1 | 52 | 244429 | 742.44 | 1319 | 1278 | 327.5 |
| D | 2 | 234 | 53260 | 158.72 | 1319 | 1278 | 327.5 |
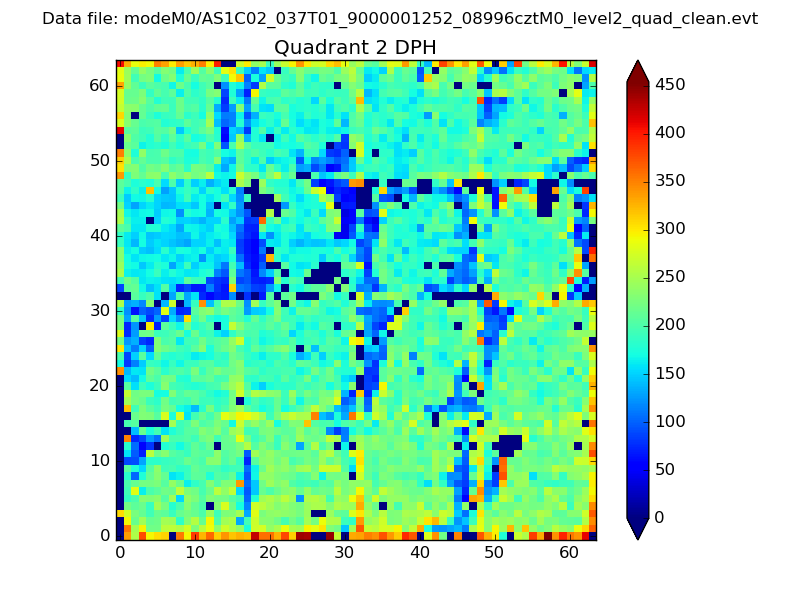
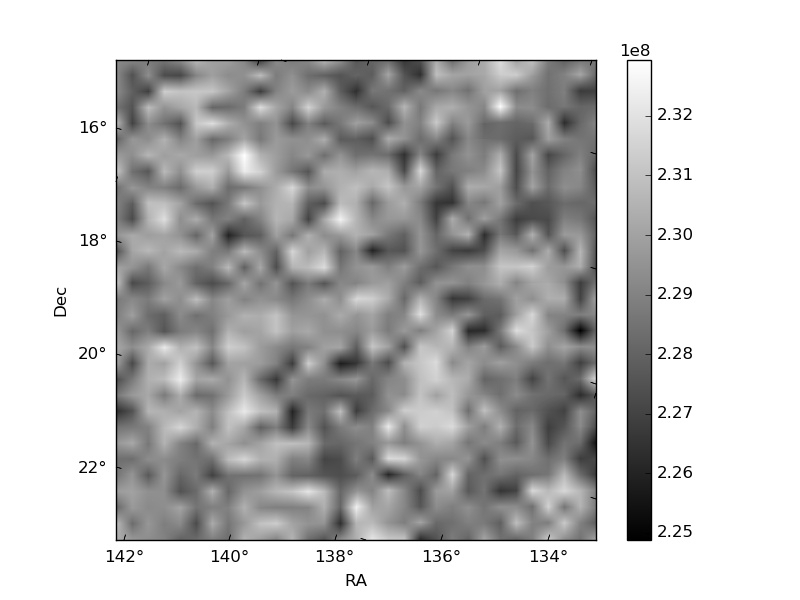
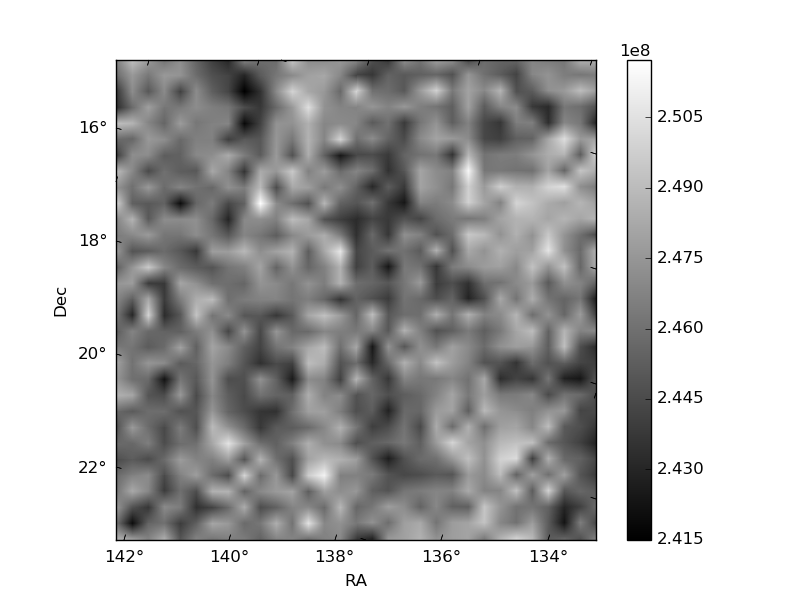
Histogram calculated using DETX and DETY for each event in the final _common_clean file
| Quadrant A | 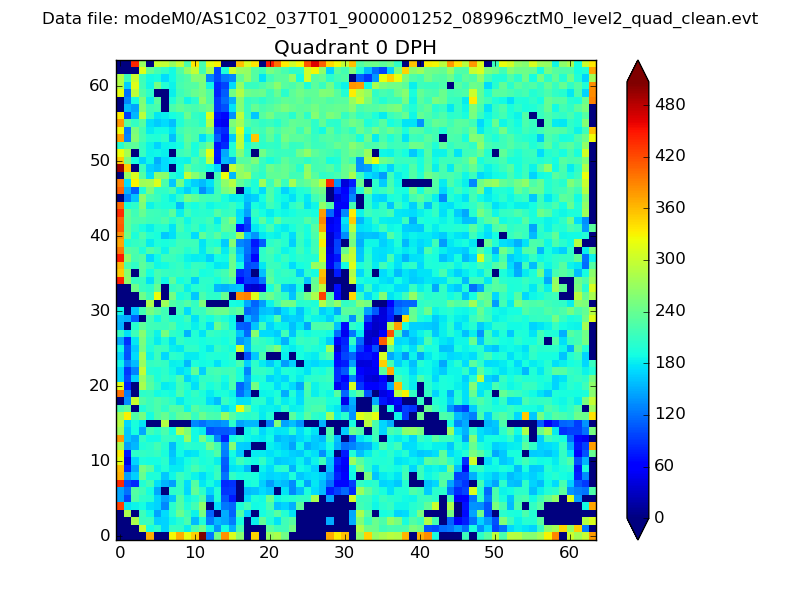 |
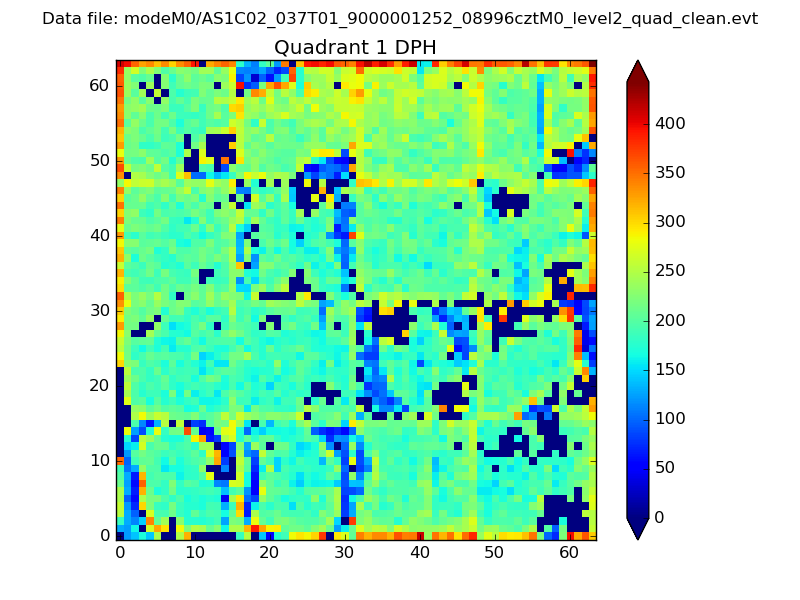 |
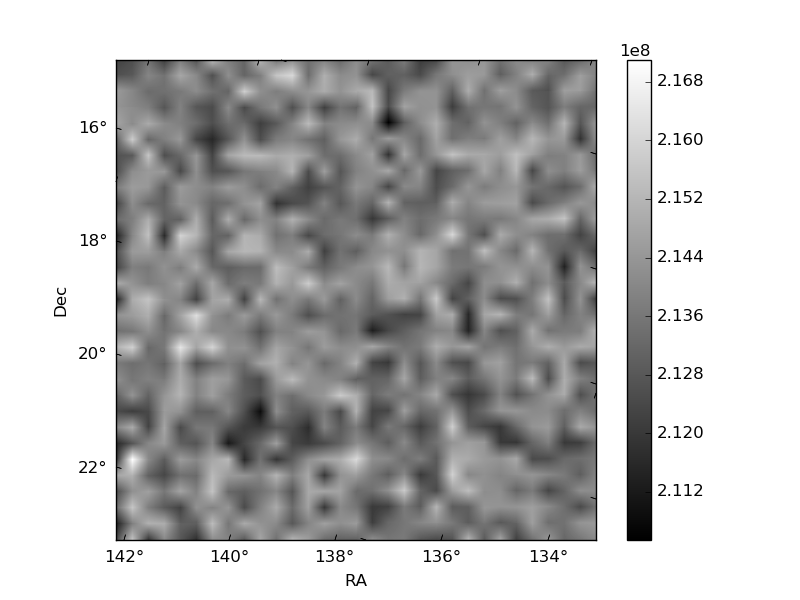
Quadrant B |
|---|---|---|---|
| Quadrant D | 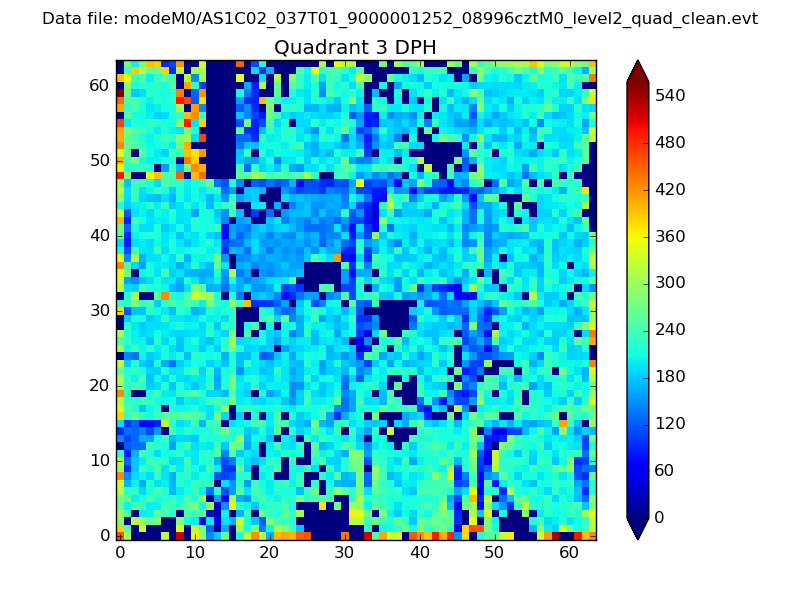 |
 |
Quadrant C |
| Plot type | Count rate plots | Images |
|---|---|---|
| Comparison with Poisson distribution Blue bars denote a histogram of data divided into 1 sec bins. Red curve is a Poisson curve with rate = median count rate of data. |
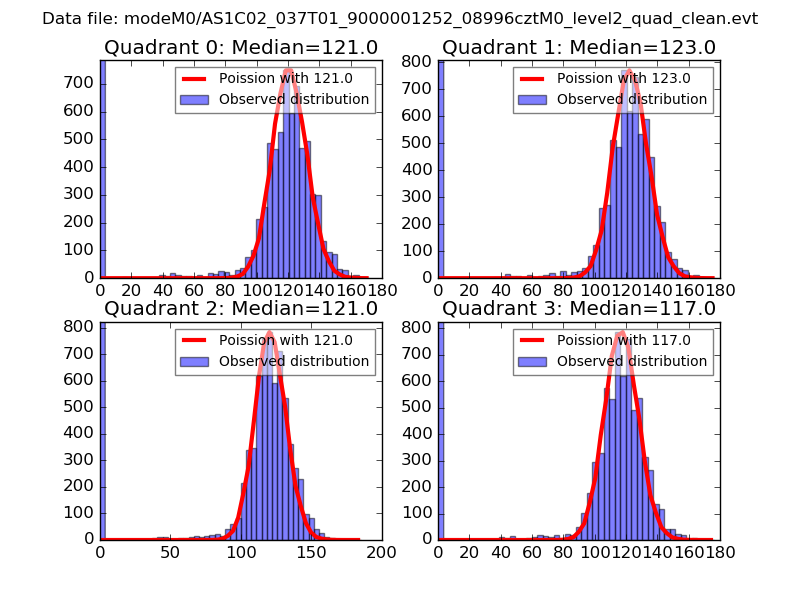 |
 |
| Quadrant-wise count rates Data is divided into 100 sec bins |
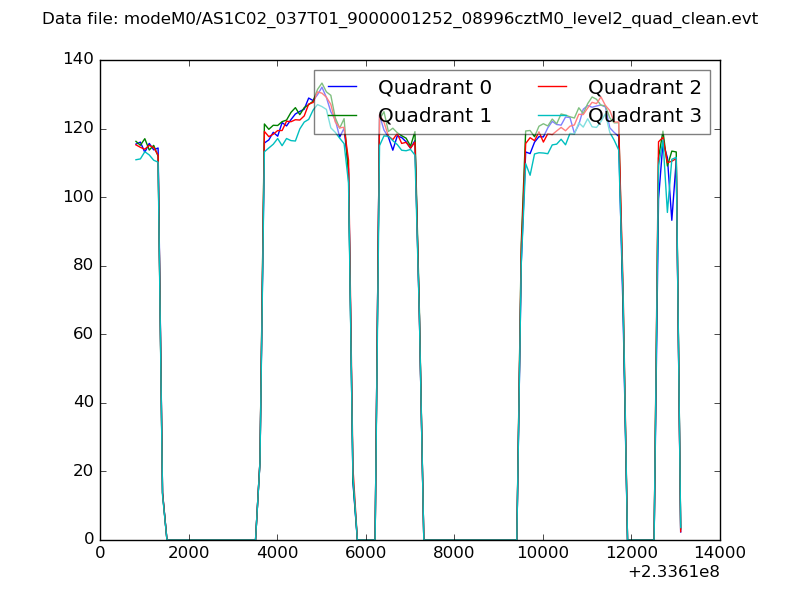 |
|
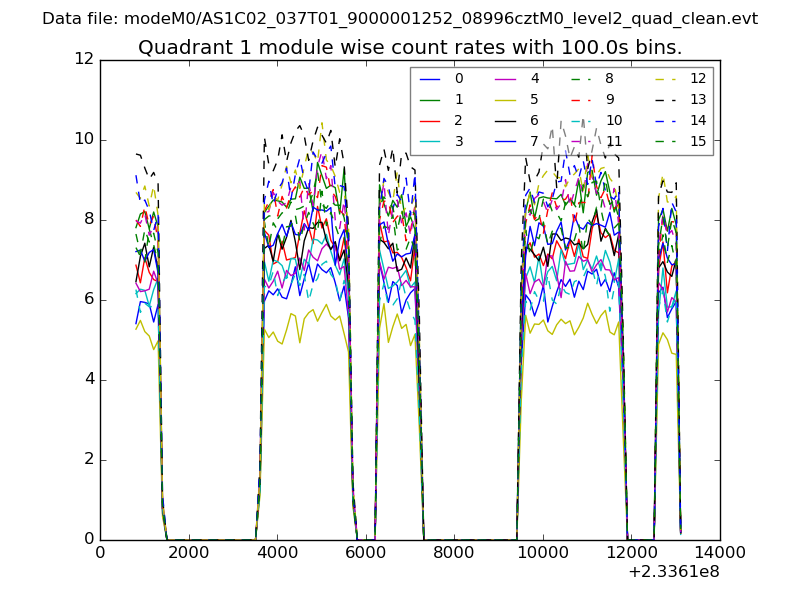
| Module-wise count rates for Quadrant A Data is divided into 100 sec bins |
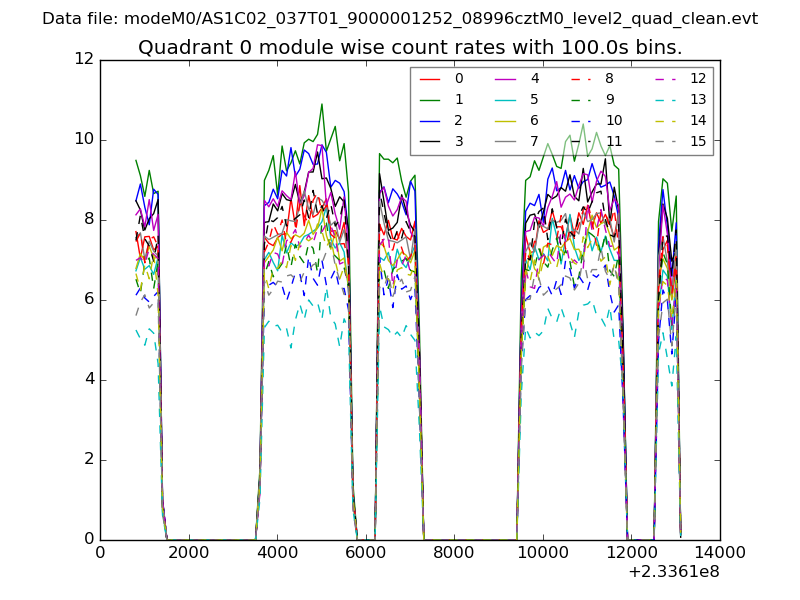 |
 |
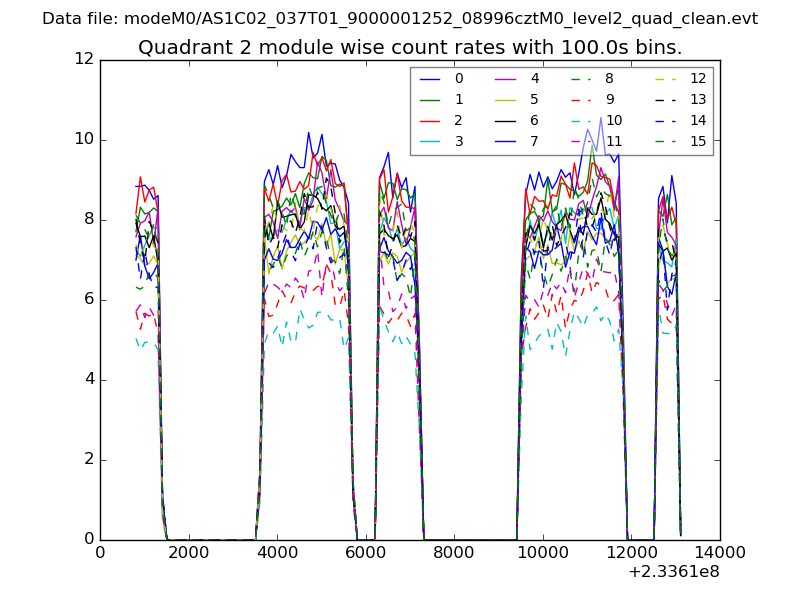
| Module-wise count rates for Quadrant B Data is divided into 100 sec bins |
 |
 |
| Module-wise count rates for Quadrant C Data is divided into 100 sec bins |
 |
 |
| Module-wise count rates for Quadrant D Data is divided into 100 sec bins |
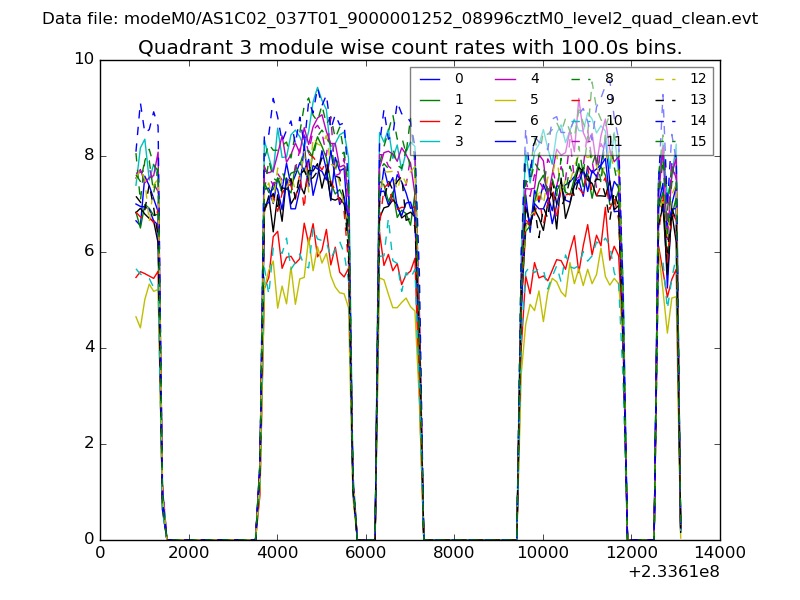 |
 |
| Parameter | Plot |
|---|---|
| CZT HV Monitor | 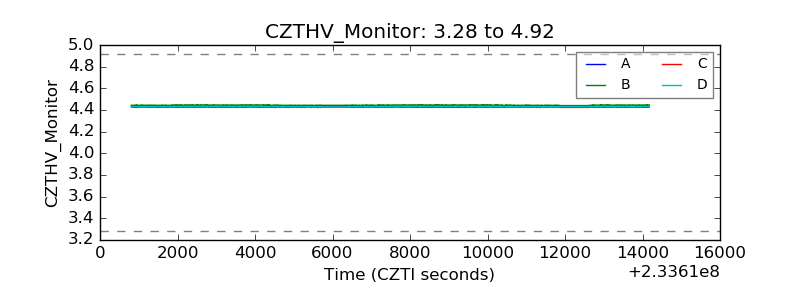 |
| D_VDD | 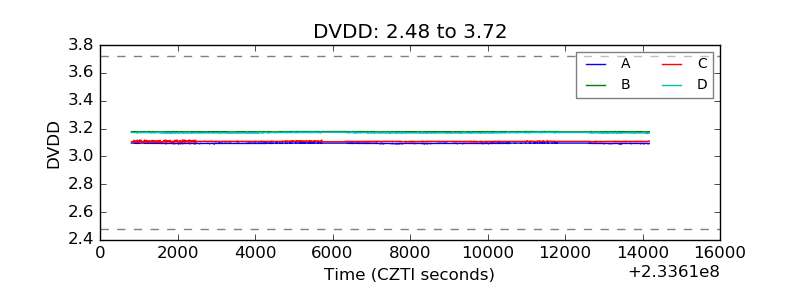 |
| Temperature 1 | 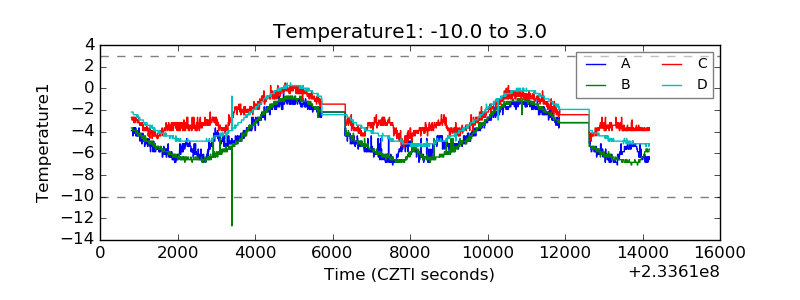 |
| Veto HV Monitor | 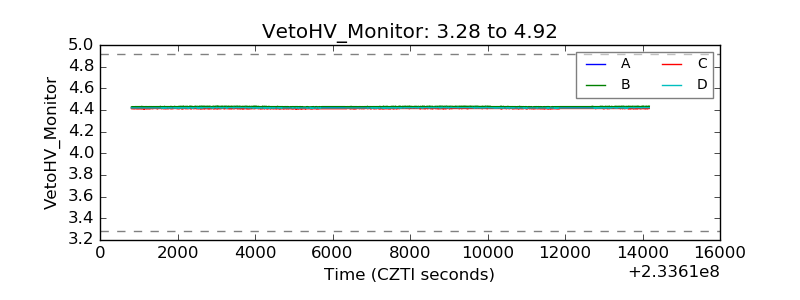 |
| Veto LLD | 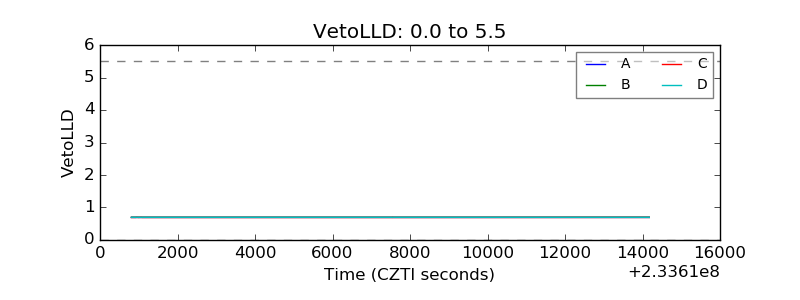 |
| Alpha Counter | 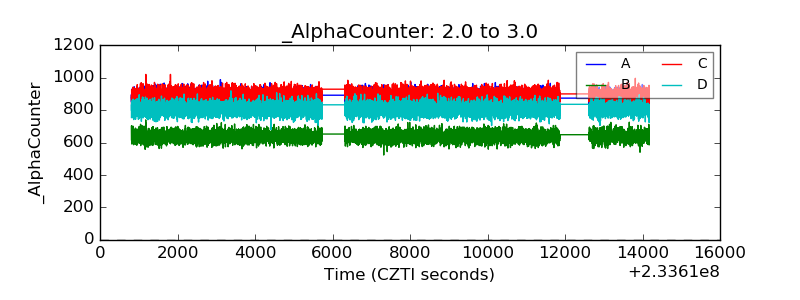 |
| _CPM_Rate | 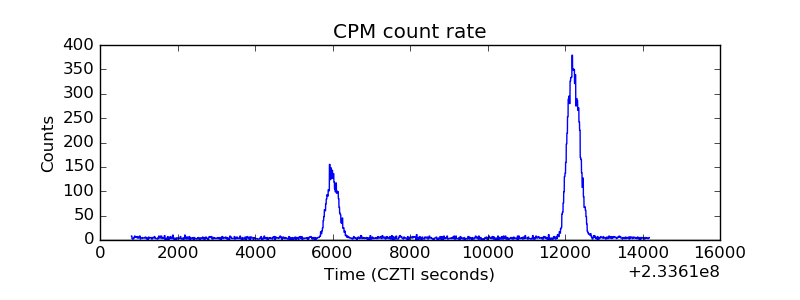 |
| CZT Counter | 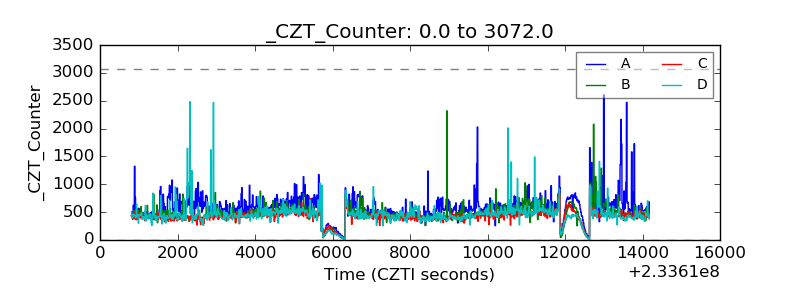 |
| +2.5 Volts monitor |  |
| +5 Volts monitor |  |
| _ROLL_ROT | 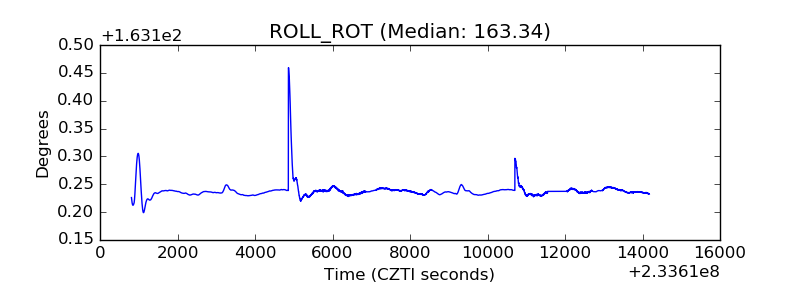 |
| _Roll_DEC | 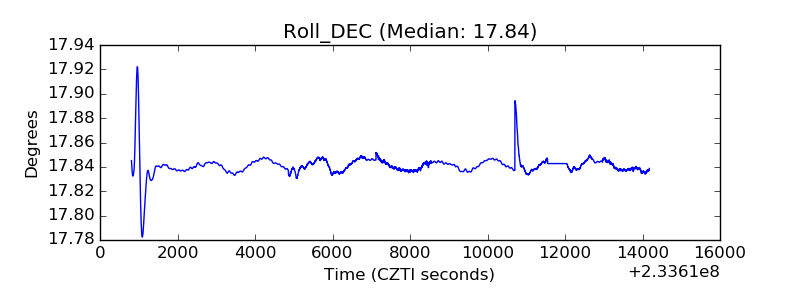 |
| _Roll_RA | 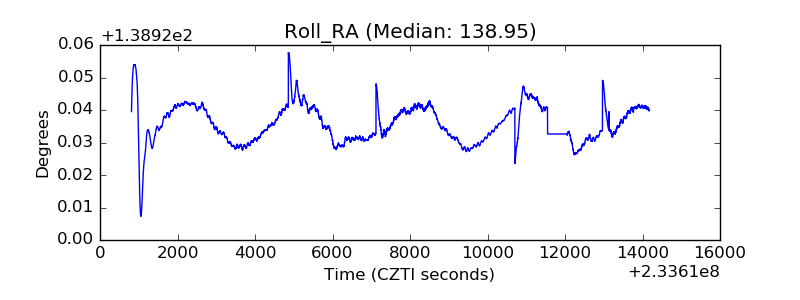 |
| Veto Counter | 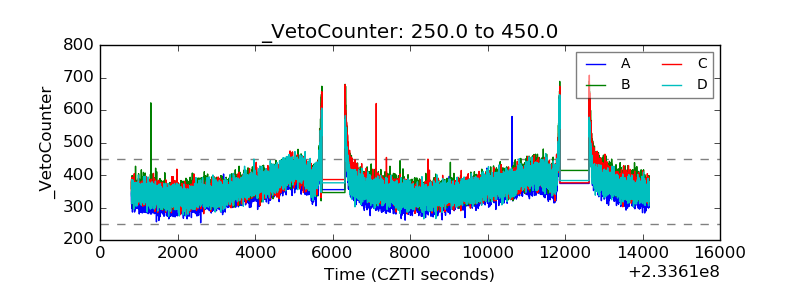 |