| Param | Original file | Final file |
|---|---|---|
| Filename | modeM0/AS1C02_037T01_9000001252_08997cztM0_level2.evt | modeM0/AS1C02_037T01_9000001252_08997cztM0_level2_quad_clean.evt |
| Size (bytes) | 500,860,800 | 67,584,960 |
| Size | 477.7 MB | 64.5 MB |
| Events in quadrant A | 4,281,085 | 393,262 |
| Events in quadrant B | 3,764,483 | 394,012 |
| Events in quadrant C | 3,136,964 | 395,638 |
| Events in quadrant D | 3,514,417 | 379,321 |
| Mode SS | |||
|---|---|---|---|
| Quadrant | BADHDUFLAG | Total packets | Discarded packets |
| A | 0 | 140 | 0 |
| B | 0 | 140 | 0 |
| C | 0 | 140 | 0 |
| D | 0 | 140 | 0 |
| Mode M0 | |||
|---|---|---|---|
| Quadrant | BADHDUFLAG | Total packets | Discarded packets |
| A | 0 | 17161 | 3 |
| B | 0 | 15612 | 2 |
| C | 0 | 14118 | 6 |
| D | 0 | 15243 | 2 |
| Mode M9 | |||
|---|---|---|---|
| Quadrant | BADHDUFLAG | Total packets | Discarded packets |
| A | 0 | 14 | 0 |
| B | 0 | 14 | 0 |
| C | 0 | 14 | 0 |
| D | 0 | 15 | 0 |
| Quadrant | Total seconds | Saturated seconds | Saturation percentage |
|---|---|---|---|
| A | 6950 | 123 | 1.769784% |
| B | 6950 | 170 | 2.446043% |
| C | 6948 | 24 | 0.345423% |
| D | 6950 | 80 | 1.151079% |
Noise dominated data is calculated using 1-second bins in cleaned event files. If a bin has >2000 counts, and if more than 50% of those come from <1% of pixels, then it is considered to be noise-dominated and hence unusable.
| Quadrant | # 1 sec bins | Bins with >0 counts | Bins with >2000 counts | High rate bins dominated by noise | Noise dominated (total time) | Noise dominated (detector-on time) | Marked lightcurve |
|---|---|---|---|---|---|---|---|
| A | 7840 | 6950 | 53 | 53 | 0.68% | 0.76% |  |
| B | 7840 | 6950 | 83 | 83 | 1.06% | 1.19% | 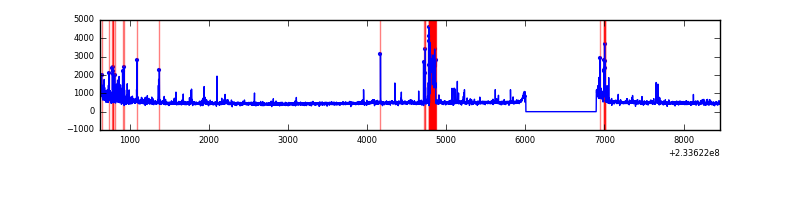 |
| C | 7840 | 6951 | 0 | 0 | 0.00% | 0.00% | 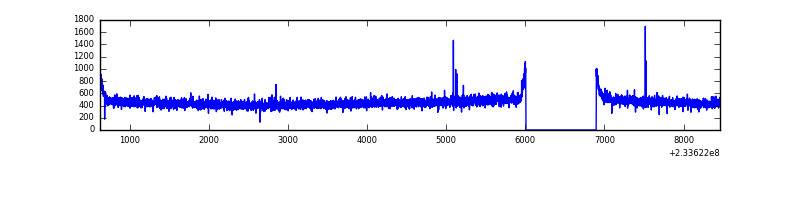 |
| D | 7840 | 6951 | 52 | 52 | 0.66% | 0.75% | 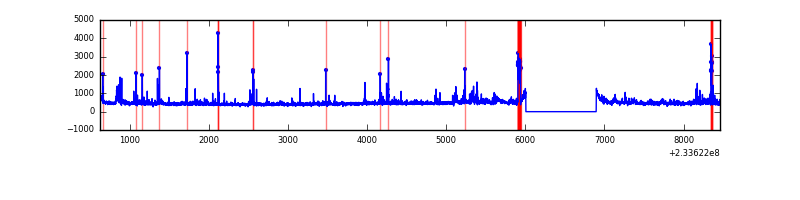 |
Top three noisy pixels from each quadrant. If the there are fewer than three noisy pixels in the level2.evt file, extra rows are filled as -1
| Pixel properties | Quadrant properties | ||||||
|---|---|---|---|---|---|---|---|
| Quadrant | DetID | PixID | Counts | Sigma | Mean | Median | Sigma |
| A | 8 | 5 | 935565 | 5510.81 | 822 | 802 | 169.6 |
| A | 5 | 16 | 78318 | 456.99 | 822 | 802 | 169.6 |
| A | 3 | 1 | 56568 | 328.76 | 822 | 802 | 169.6 |
| B | 10 | 16 | 307144 | 1922.18 | 827 | 807 | 159.4 |
| B | 4 | 48 | 94867 | 590.2 | 827 | 807 | 159.4 |
| B | 4 | 173 | 64066 | 396.93 | 827 | 807 | 159.4 |
| C | 1 | 3 | 6342 | 29.65 | 802 | 805 | 186.8 |
| C | 13 | 61 | 6108 | 28.39 | 802 | 805 | 186.8 |
| C | 12 | 4 | 2670 | 9.99 | 802 | 805 | 186.8 |
| D | 1 | 52 | 138581 | 638.44 | 789 | 774 | 215.9 |
| D | 7 | 71 | 111965 | 515.13 | 789 | 774 | 215.9 |
| D | 14 | 50 | 101416 | 466.26 | 789 | 774 | 215.9 |
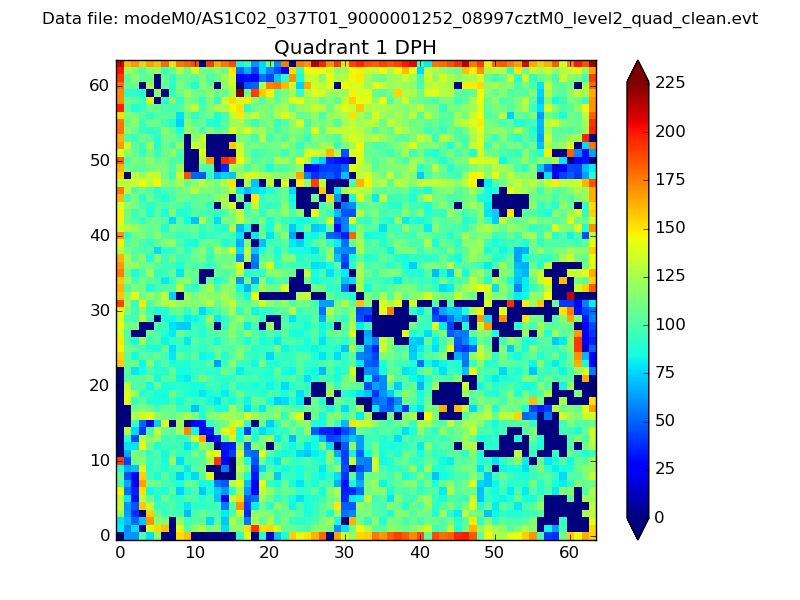
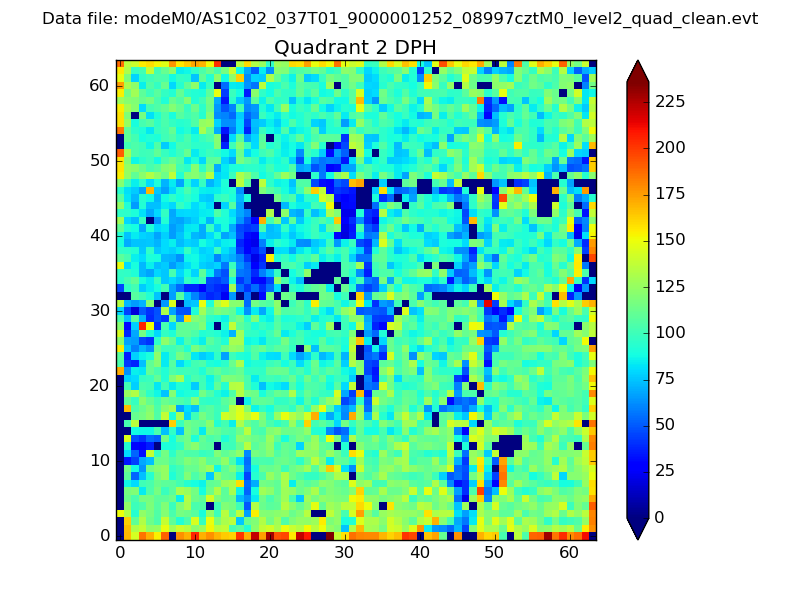
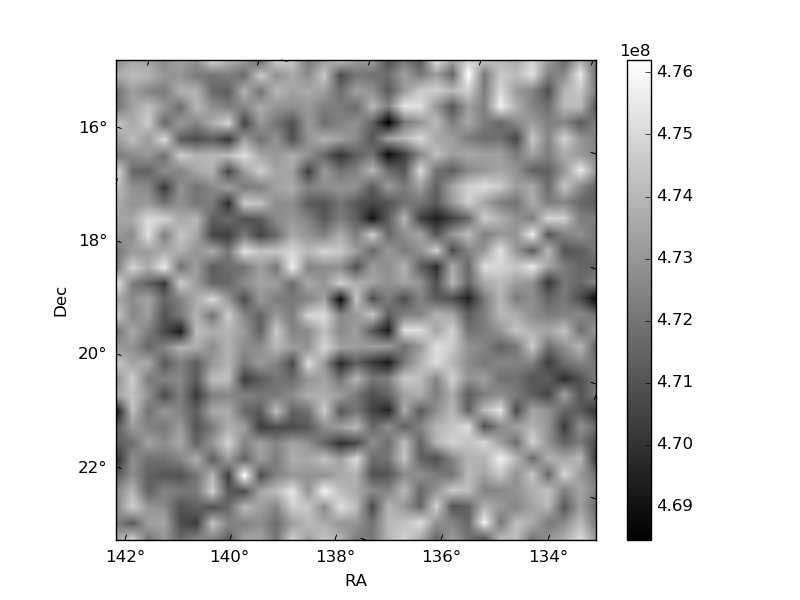
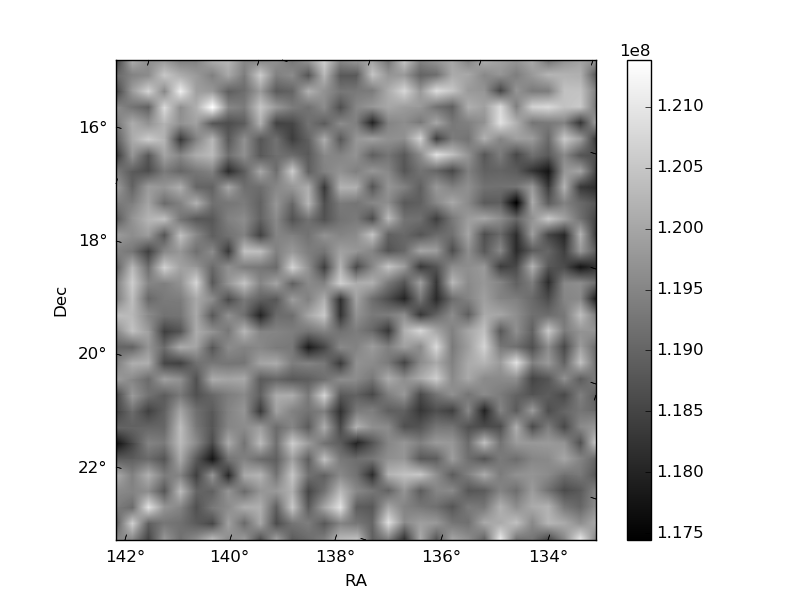
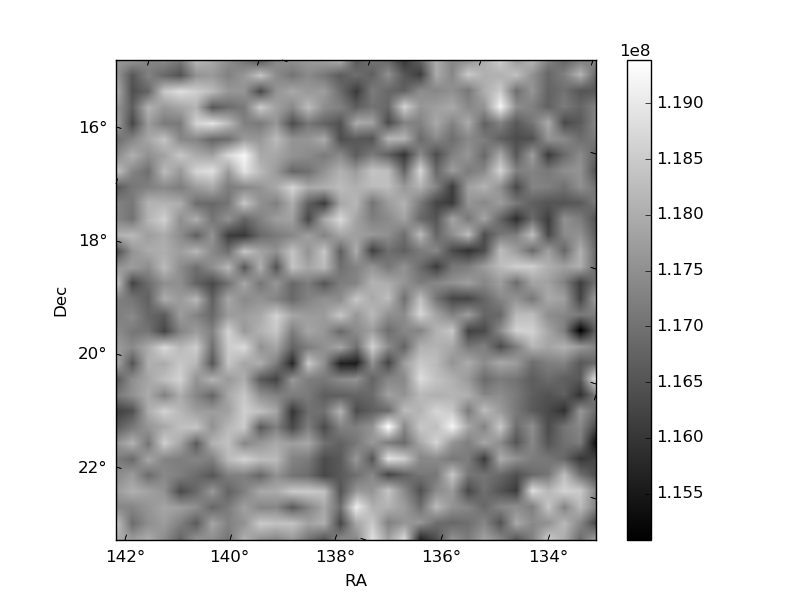
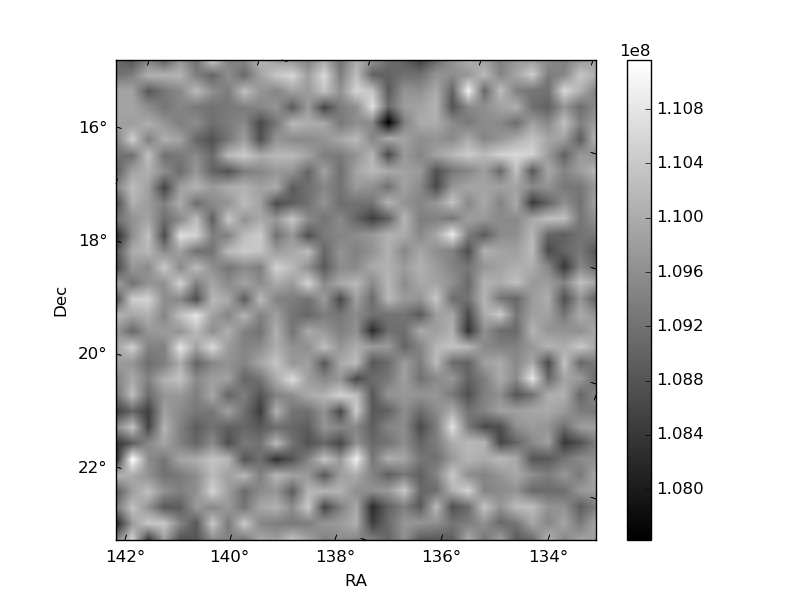
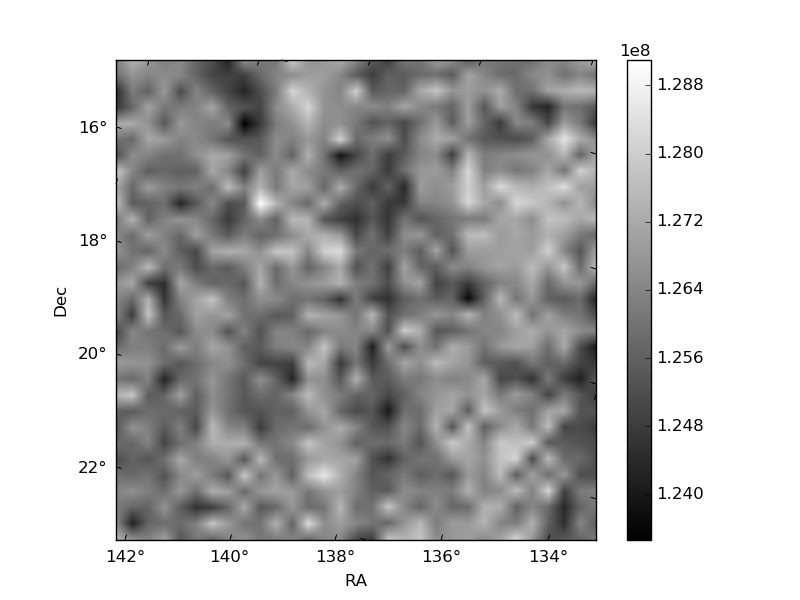
Histogram calculated using DETX and DETY for each event in the final _common_clean file
| Quadrant A | 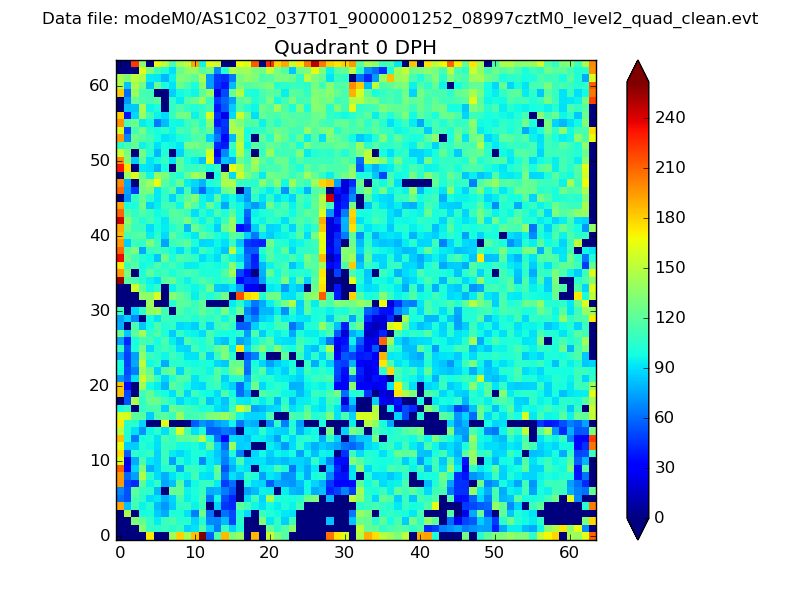 |
 |
Quadrant B |
|---|---|---|---|
| Quadrant D | 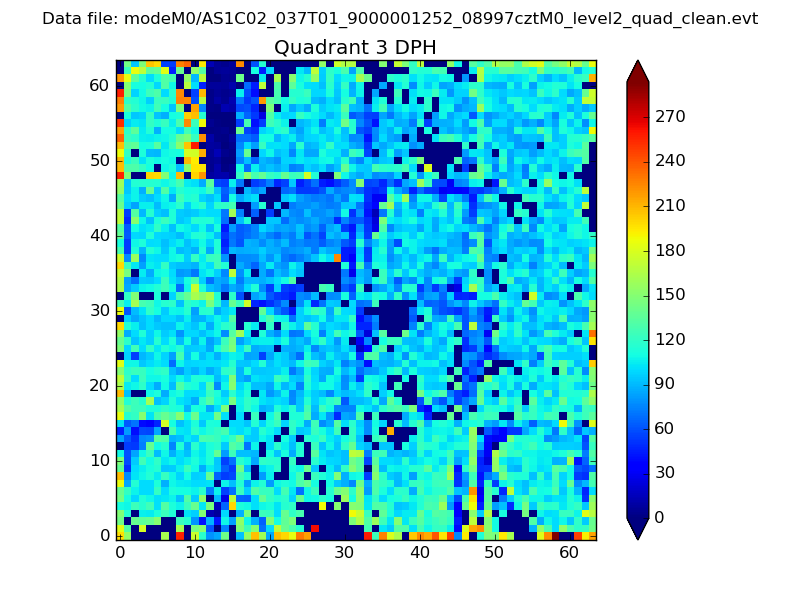 |
 |
Quadrant C |
| Plot type | Count rate plots | Images |
|---|---|---|
| Comparison with Poisson distribution Blue bars denote a histogram of data divided into 1 sec bins. Red curve is a Poisson curve with rate = median count rate of data. |
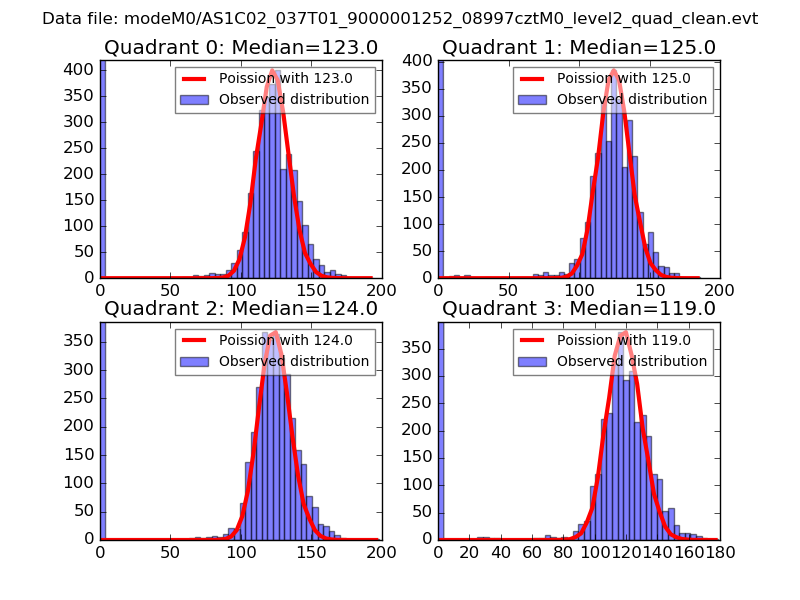 |
 |
| Quadrant-wise count rates Data is divided into 100 sec bins |
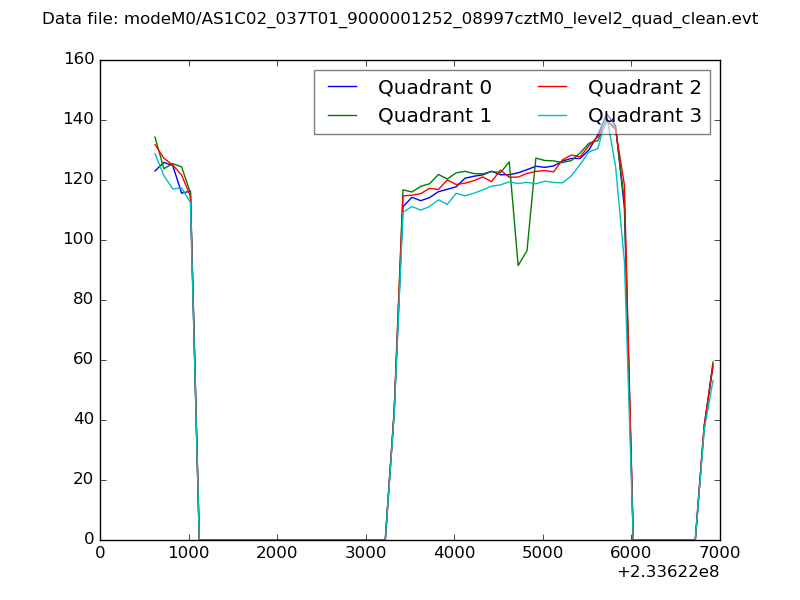 |
|
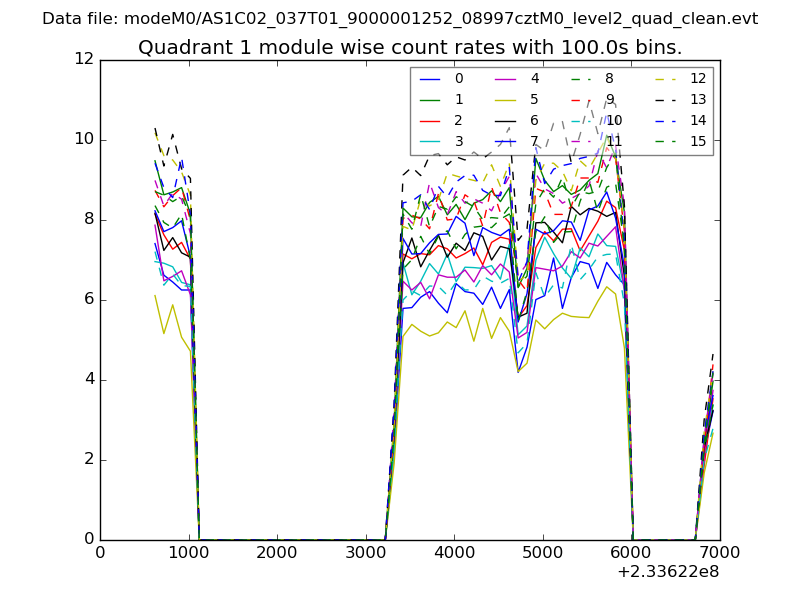
| Module-wise count rates for Quadrant A Data is divided into 100 sec bins |
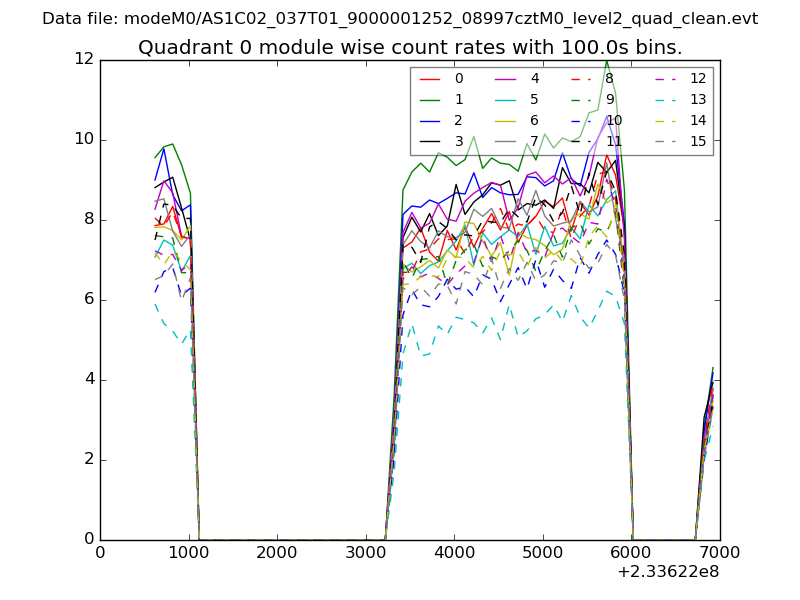 |
 |
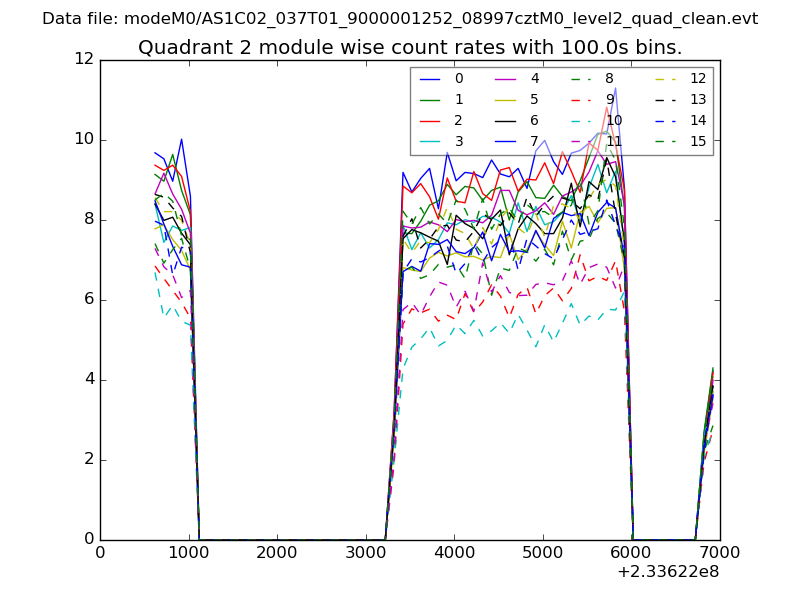
| Module-wise count rates for Quadrant B Data is divided into 100 sec bins |
 |
 |
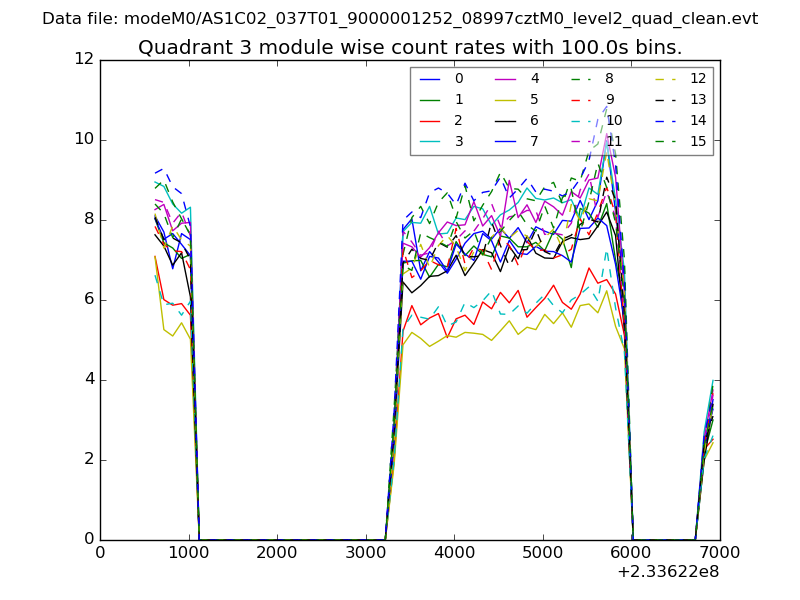
| Module-wise count rates for Quadrant C Data is divided into 100 sec bins |
 |
 |
| Module-wise count rates for Quadrant D Data is divided into 100 sec bins |
 |
 |
| Parameter | Plot |
|---|---|
| CZT HV Monitor | 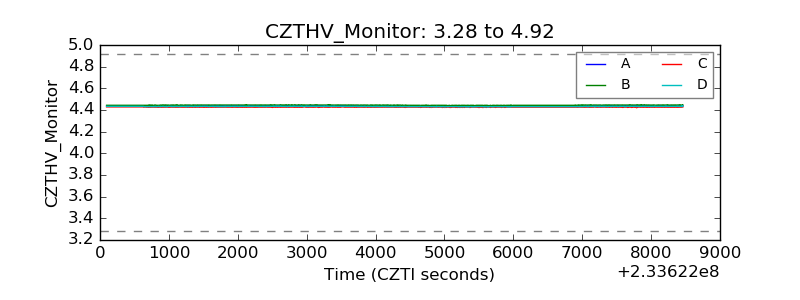 |
| D_VDD |  |
| Temperature 1 | 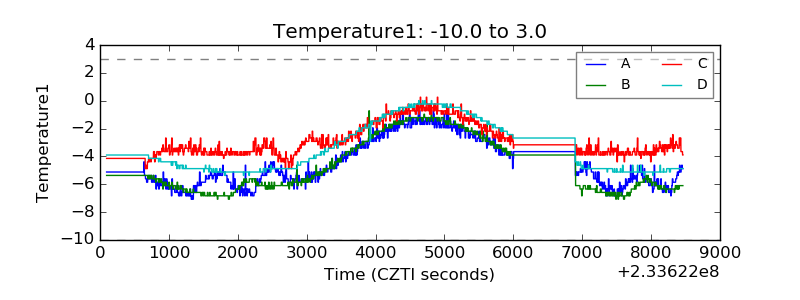 |
| Veto HV Monitor | 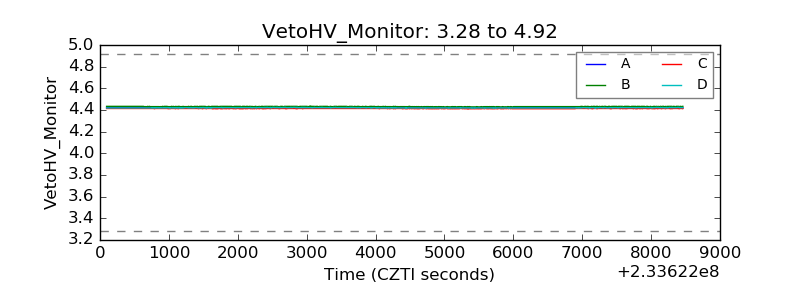 |
| Veto LLD | 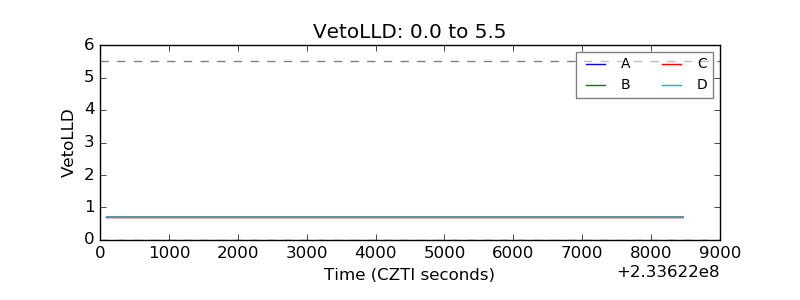 |
| Alpha Counter | 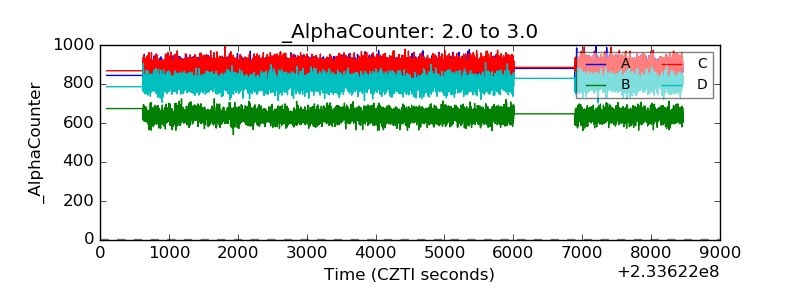 |
| _CPM_Rate | 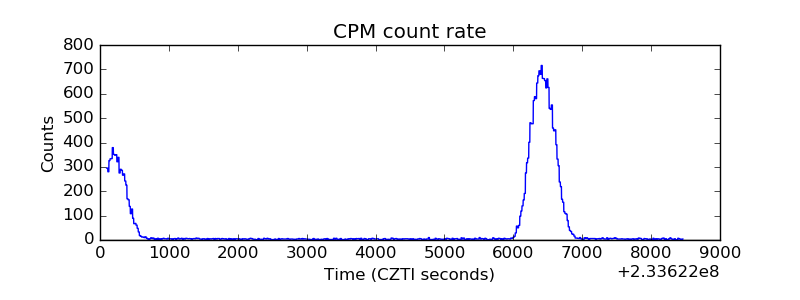 |
| CZT Counter | 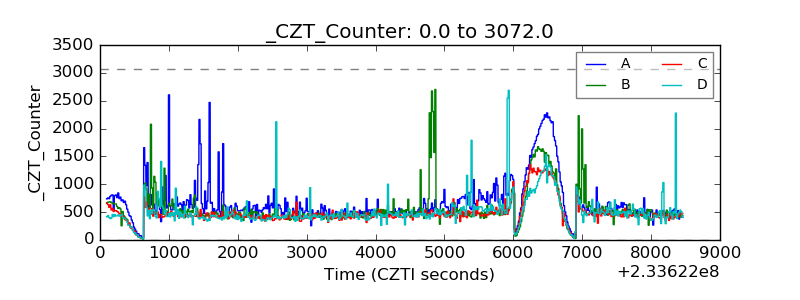 |
| +2.5 Volts monitor |  |
| +5 Volts monitor |  |
| _ROLL_ROT | 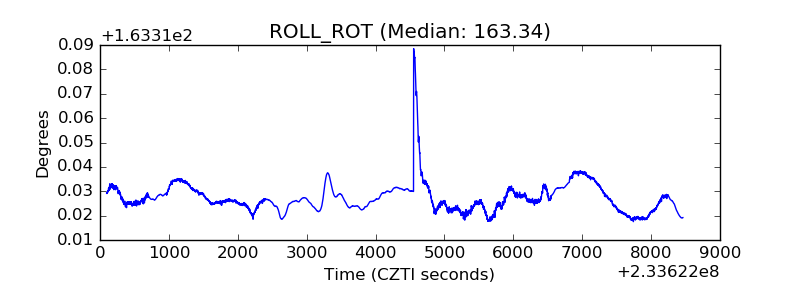 |
| _Roll_DEC | 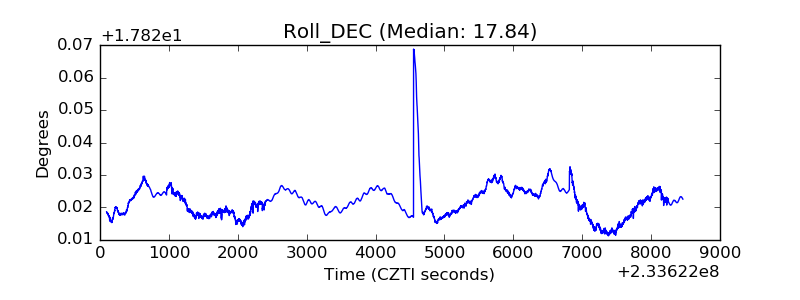 |
| _Roll_RA | 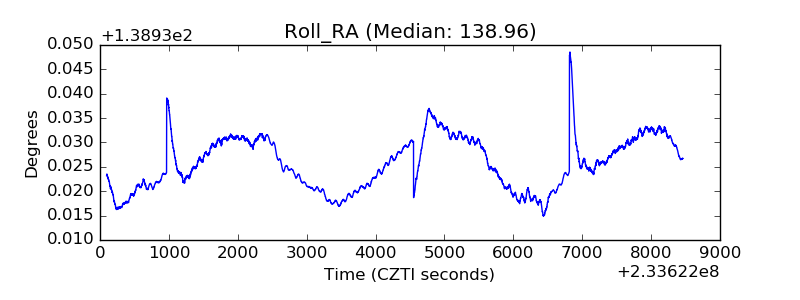 |
| Veto Counter | 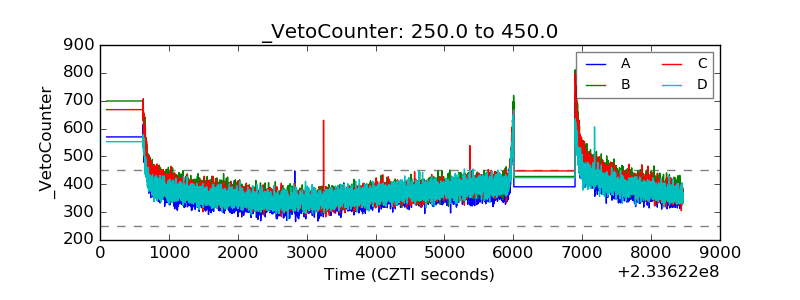 |