| Param | Original file | Final file |
|---|---|---|
| Filename | modeM0/AS1C02_037T01_9000001252_09000cztM0_level2.evt | modeM0/AS1C02_037T01_9000001252_09000cztM0_level2_quad_clean.evt |
| Size (bytes) | 494,156,160 | 69,986,880 |
| Size | 471.3 MB | 66.7 MB |
| Events in quadrant A | 3,961,365 | 430,011 |
| Events in quadrant B | 3,628,902 | 421,332 |
| Events in quadrant C | 3,096,051 | 409,704 |
| Events in quadrant D | 3,836,151 | 402,555 |
| Mode SS | |||
|---|---|---|---|
| Quadrant | BADHDUFLAG | Total packets | Discarded packets |
| A | 0 | 134 | 0 |
| B | 0 | 134 | 0 |
| C | 0 | 134 | 0 |
| D | 0 | 134 | 0 |
| Mode M0 | |||
|---|---|---|---|
| Quadrant | BADHDUFLAG | Total packets | Discarded packets |
| A | 0 | 15983 | 3 |
| B | 0 | 14719 | 2 |
| C | 0 | 13409 | 2 |
| D | 0 | 15437 | 2 |
| Mode M9 | |||
|---|---|---|---|
| Quadrant | BADHDUFLAG | Total packets | Discarded packets |
| A | 0 | 13 | 0 |
| B | 0 | 13 | 0 |
| C | 0 | 13 | 0 |
| D | 0 | 14 | 0 |
| Quadrant | Total seconds | Saturated seconds | Saturation percentage |
|---|---|---|---|
| A | 6526 | 69 | 1.057309% |
| B | 6526 | 152 | 2.329145% |
| C | 6526 | 33 | 0.505670% |
| D | 6526 | 108 | 1.654919% |
Noise dominated data is calculated using 1-second bins in cleaned event files. If a bin has >2000 counts, and if more than 50% of those come from <1% of pixels, then it is considered to be noise-dominated and hence unusable.
| Quadrant | # 1 sec bins | Bins with >0 counts | Bins with >2000 counts | High rate bins dominated by noise | Noise dominated (total time) | Noise dominated (detector-on time) | Marked lightcurve |
|---|---|---|---|---|---|---|---|
| A | 7641 | 6526 | 1 | 1 | 0.01% | 0.02% | 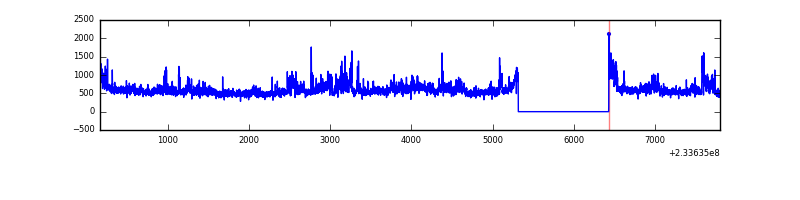 |
| B | 7641 | 6527 | 65 | 65 | 0.85% | 1.00% | 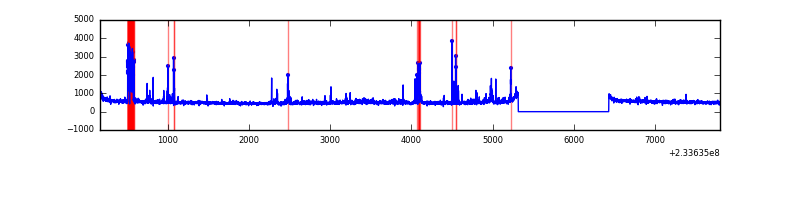 |
| C | 7641 | 6527 | 0 | 0 | 0.00% | 0.00% | 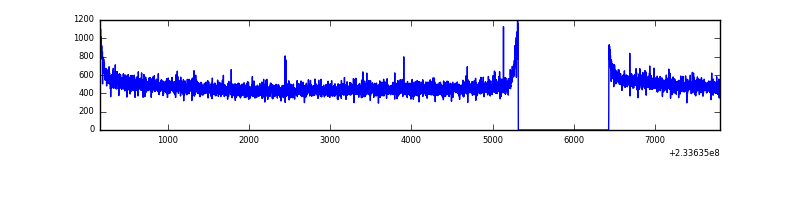 |
| D | 7641 | 6527 | 76 | 76 | 0.99% | 1.16% | 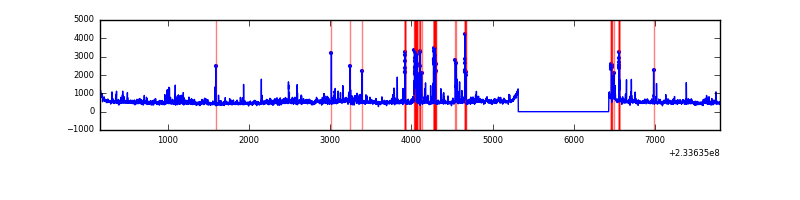 |
Top three noisy pixels from each quadrant. If the there are fewer than three noisy pixels in the level2.evt file, extra rows are filled as -1
| Pixel properties | Quadrant properties | ||||||
|---|---|---|---|---|---|---|---|
| Quadrant | DetID | PixID | Counts | Sigma | Mean | Median | Sigma |
| A | 8 | 5 | 672008 | 3953.05 | 828 | 811 | 169.8 |
| A | 3 | 1 | 76894 | 448.09 | 828 | 811 | 169.8 |
| A | 15 | 174 | 13889 | 77.02 | 828 | 811 | 169.8 |
| B | 10 | 16 | 296719 | 1884.58 | 824 | 805 | 157.0 |
| B | 0 | 219 | 28108 | 173.88 | 824 | 805 | 157.0 |
| B | 0 | 214 | 26415 | 163.1 | 824 | 805 | 157.0 |
| C | 9 | 68 | 10994 | 55.77 | 790 | 795 | 182.9 |
| C | 13 | 61 | 6019 | 28.57 | 790 | 795 | 182.9 |
| C | 14 | 67 | 3500 | 14.79 | 790 | 795 | 182.9 |
| D | 10 | 253 | 248161 | 1160.36 | 784 | 768 | 213.2 |
| D | 1 | 52 | 234859 | 1097.97 | 784 | 768 | 213.2 |
| D | 12 | 233 | 97779 | 455.01 | 784 | 768 | 213.2 |
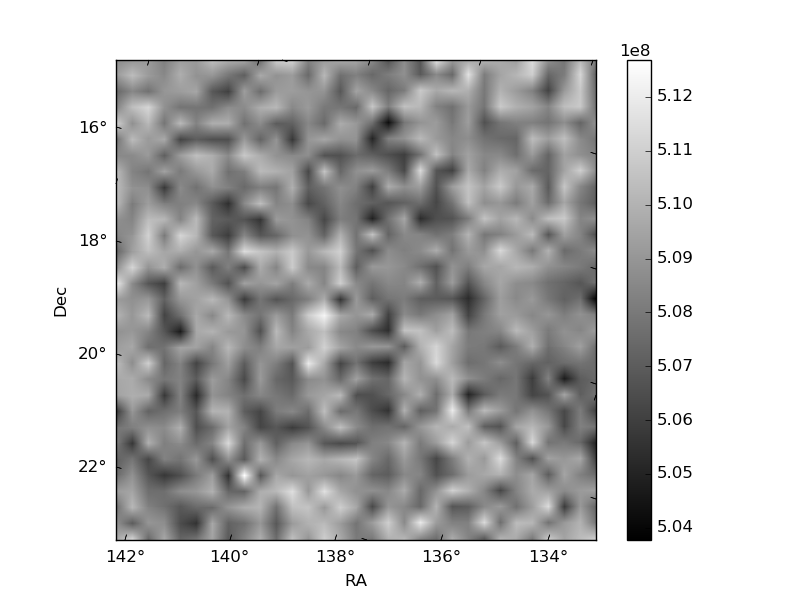
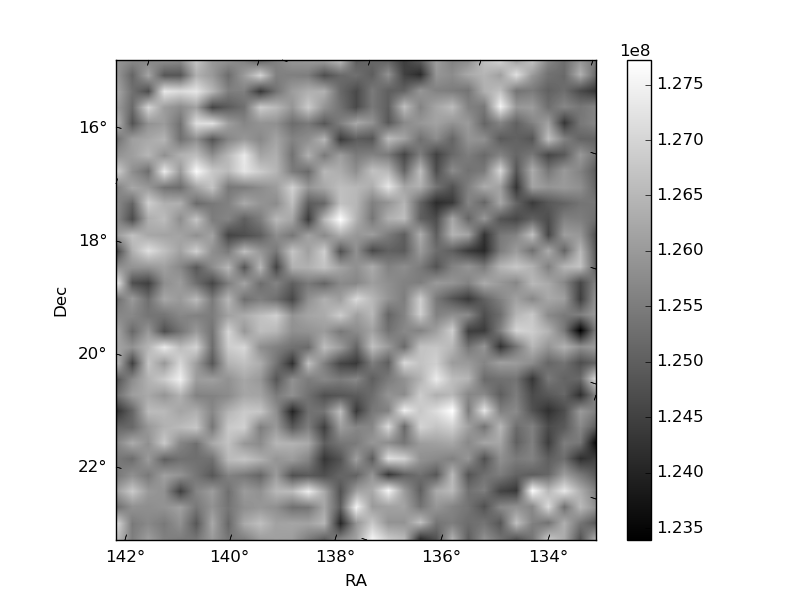
Histogram calculated using DETX and DETY for each event in the final _common_clean file
| Quadrant A | 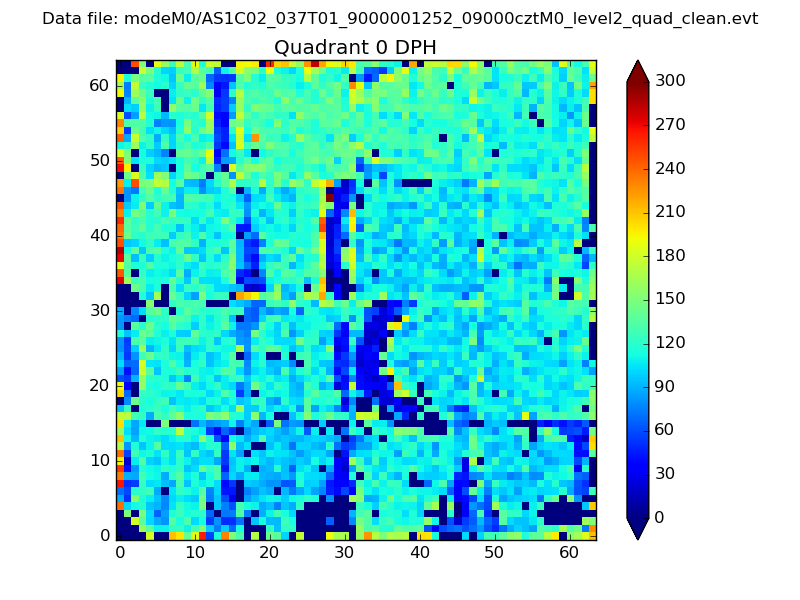 |
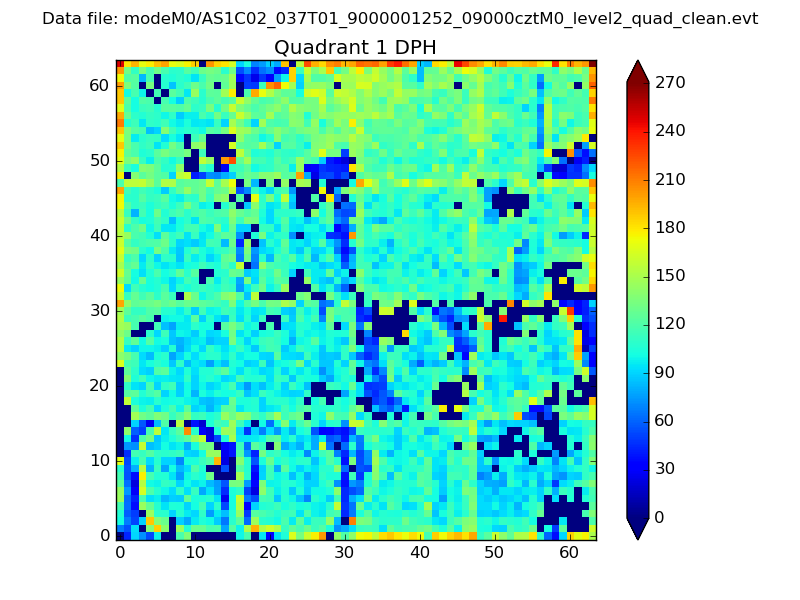 |
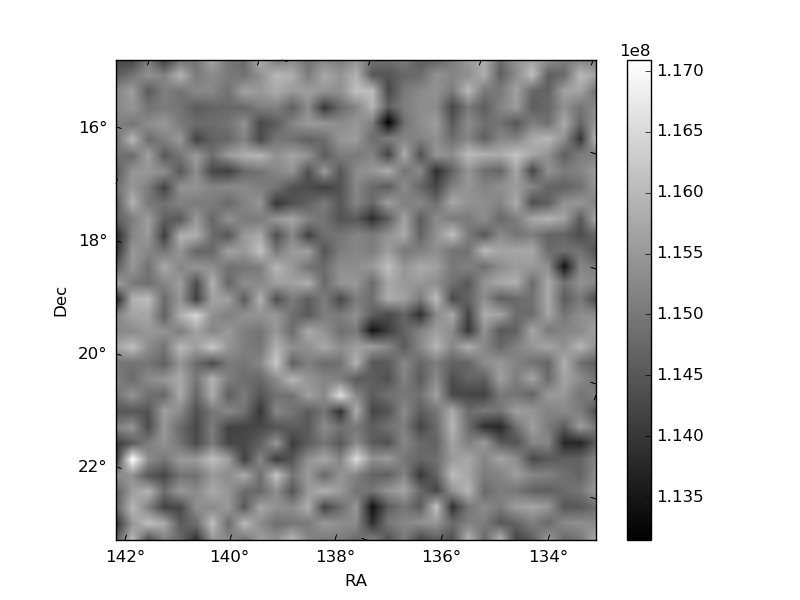
Quadrant B |
|---|---|---|---|
| Quadrant D | 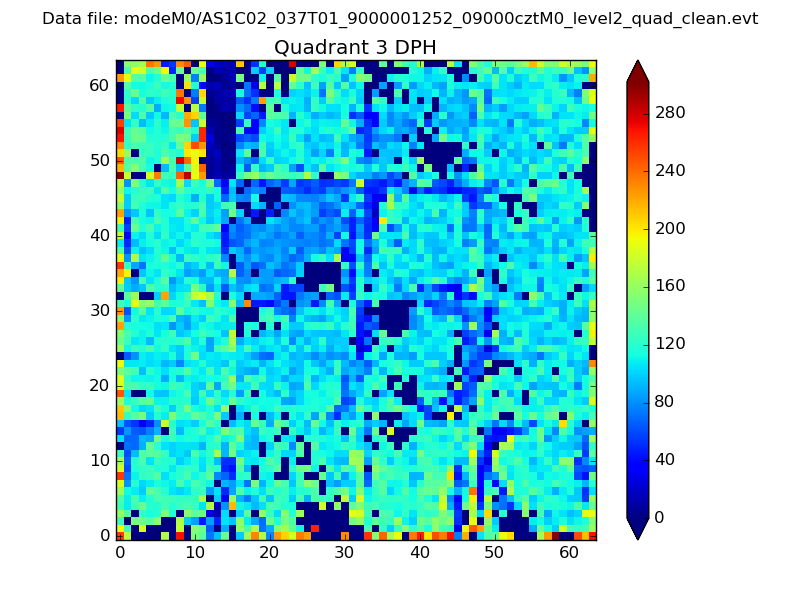 |
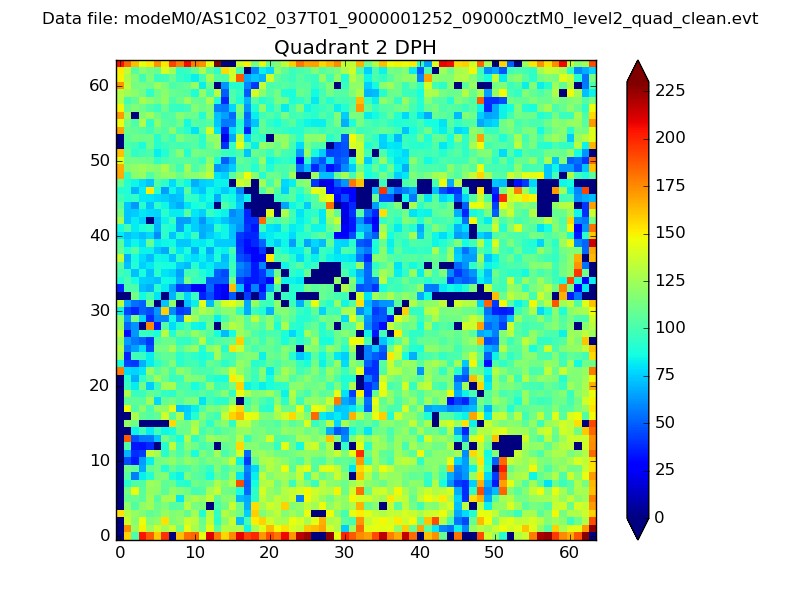 |
Quadrant C |
| Plot type | Count rate plots | Images |
|---|---|---|
| Comparison with Poisson distribution Blue bars denote a histogram of data divided into 1 sec bins. Red curve is a Poisson curve with rate = median count rate of data. |
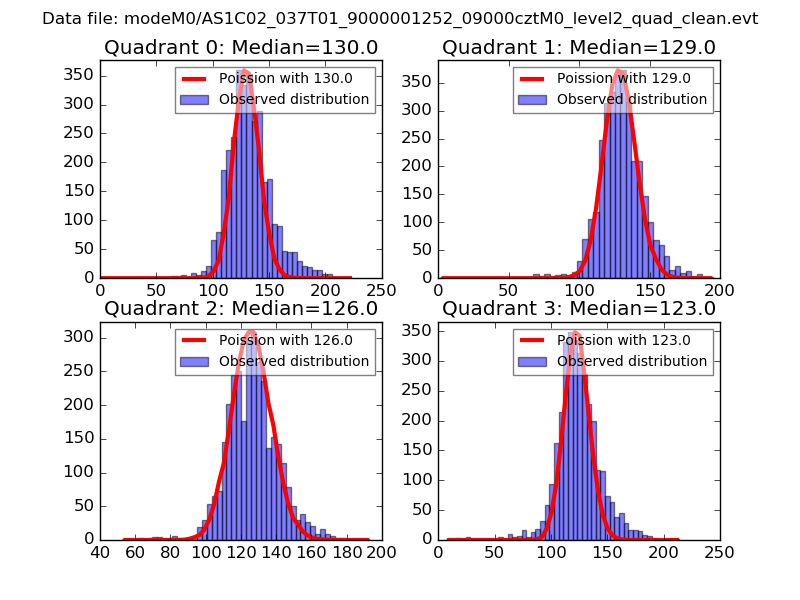 |
 |
| Quadrant-wise count rates Data is divided into 100 sec bins |
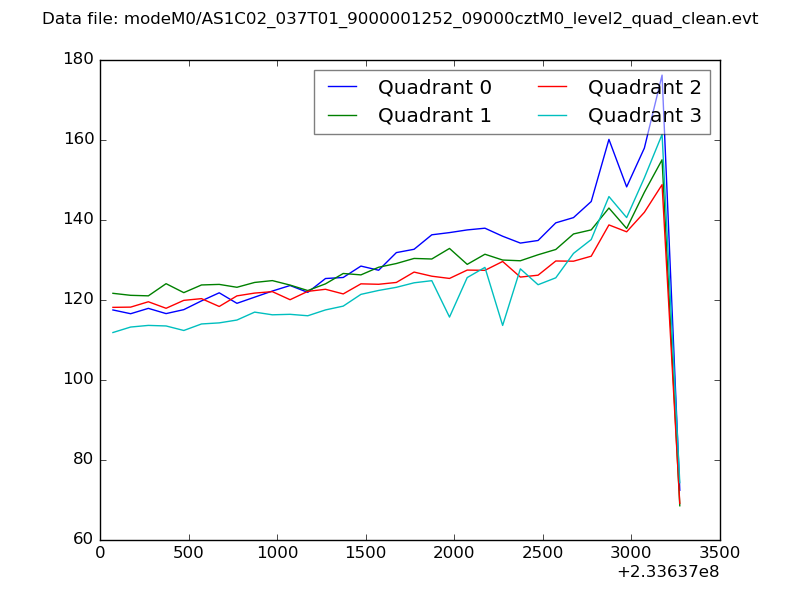 |
|
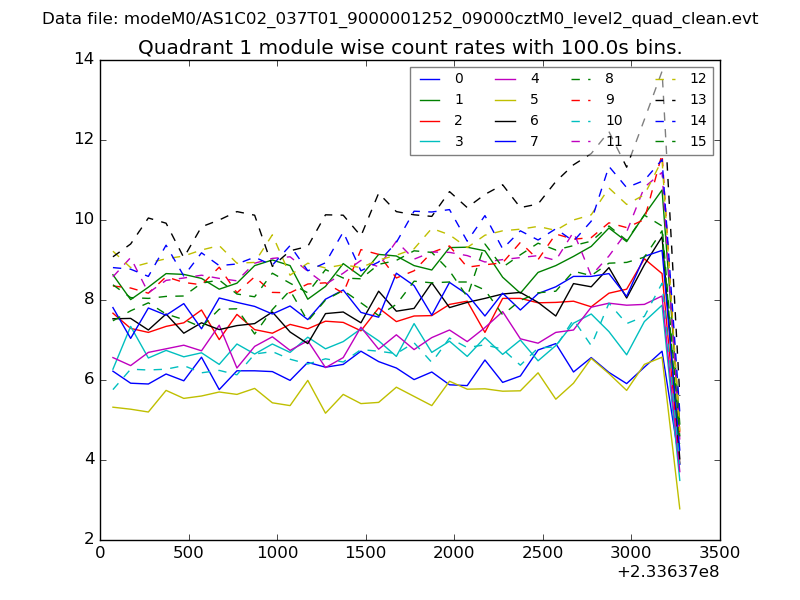
| Module-wise count rates for Quadrant A Data is divided into 100 sec bins |
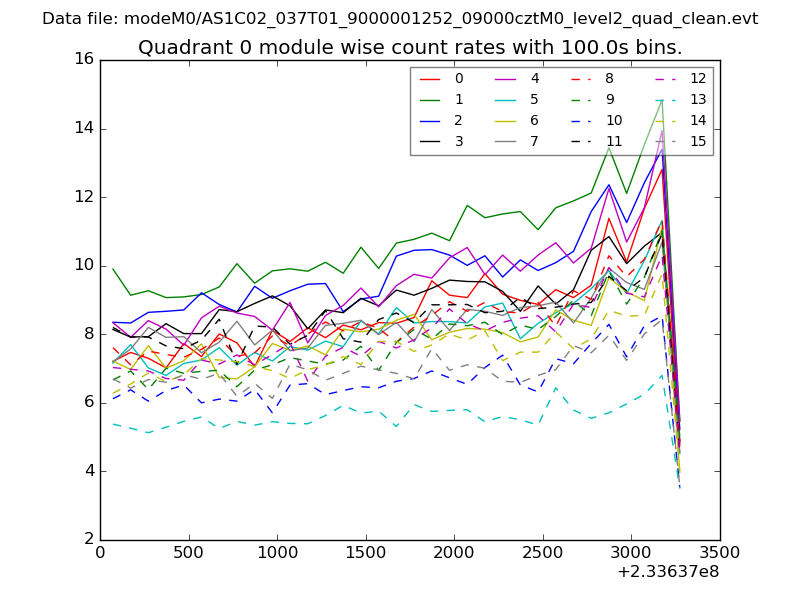 |
 |
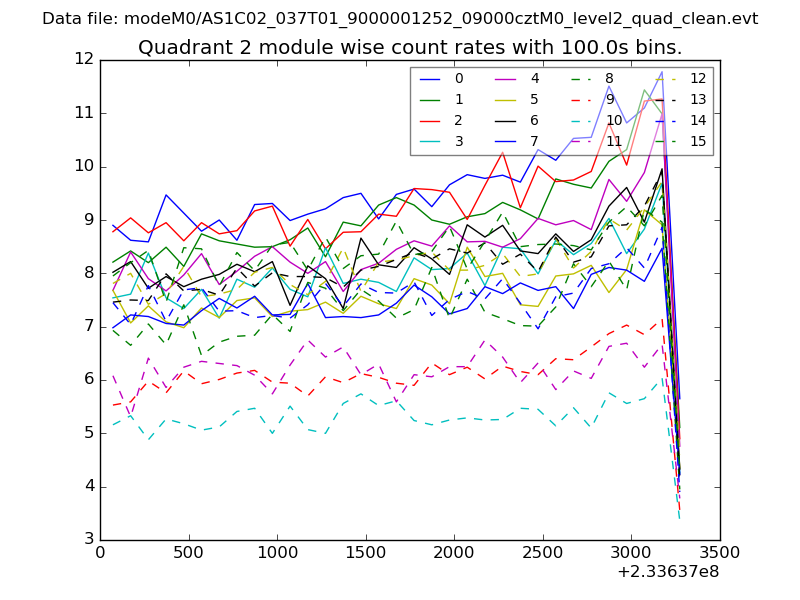
| Module-wise count rates for Quadrant B Data is divided into 100 sec bins |
 |
 |
| Module-wise count rates for Quadrant C Data is divided into 100 sec bins |
 |
 |
| Module-wise count rates for Quadrant D Data is divided into 100 sec bins |
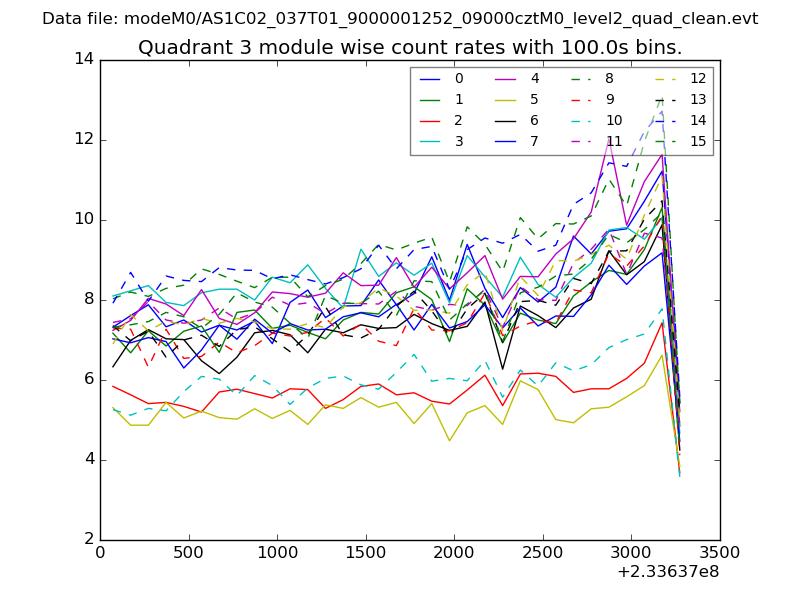 |
 |
| Parameter | Plot |
|---|---|
| CZT HV Monitor | 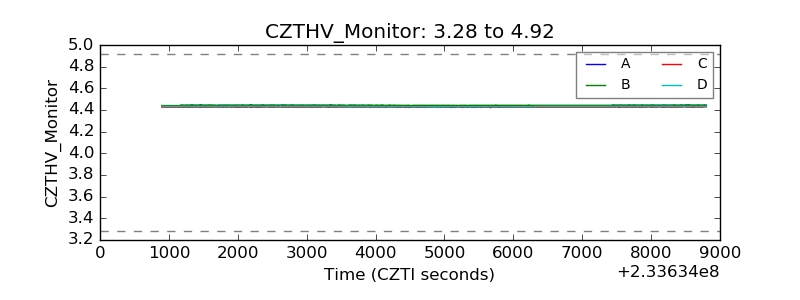 |
| D_VDD | 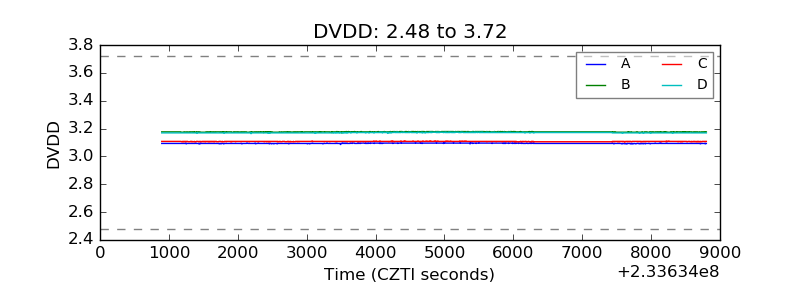 |
| Temperature 1 | 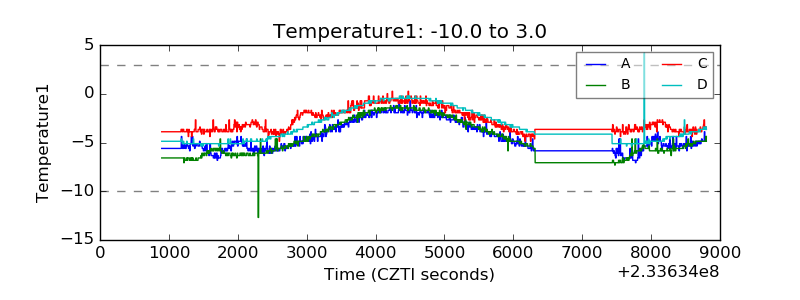 |
| Veto HV Monitor | 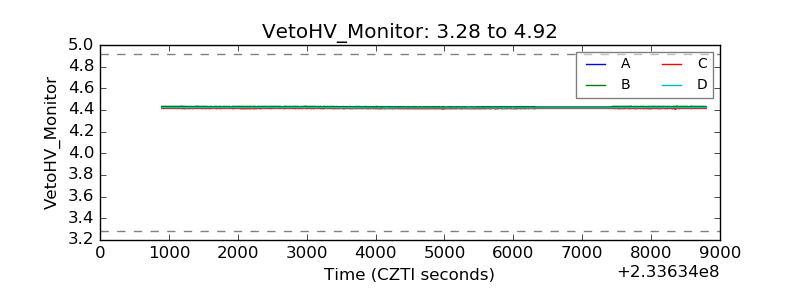 |
| Veto LLD | 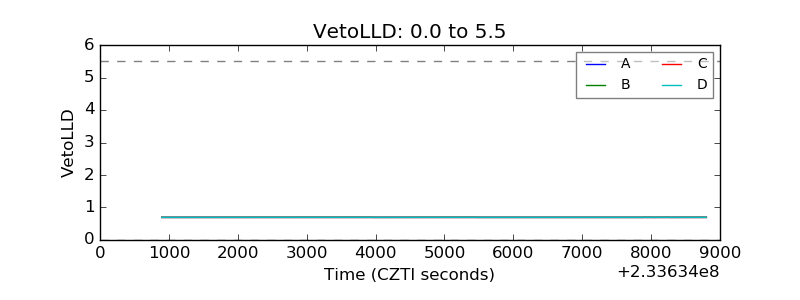 |
| Alpha Counter | 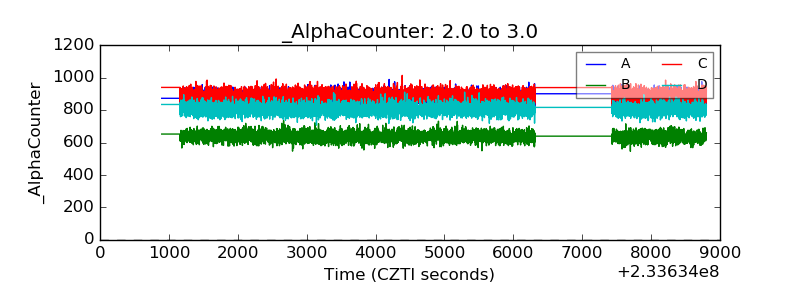 |
| _CPM_Rate | 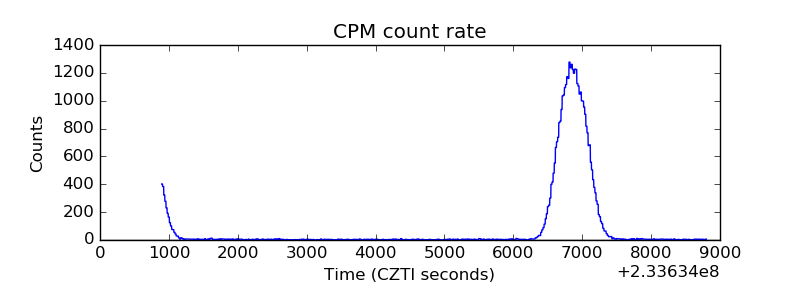 |
| CZT Counter | 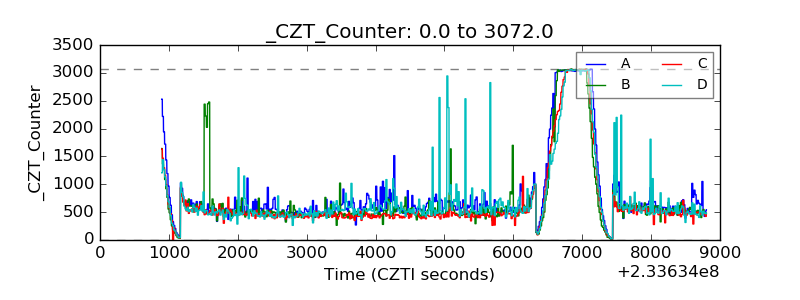 |
| +2.5 Volts monitor |  |
| +5 Volts monitor |  |
| _ROLL_ROT | 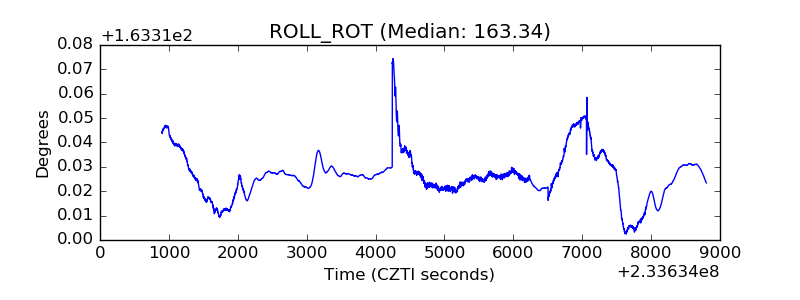 |
| _Roll_DEC | 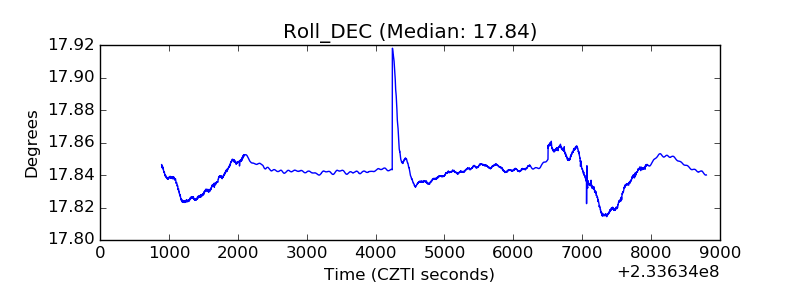 |
| _Roll_RA | 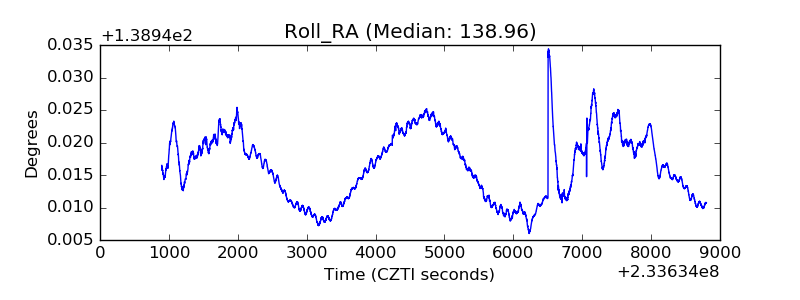 |
| Veto Counter | 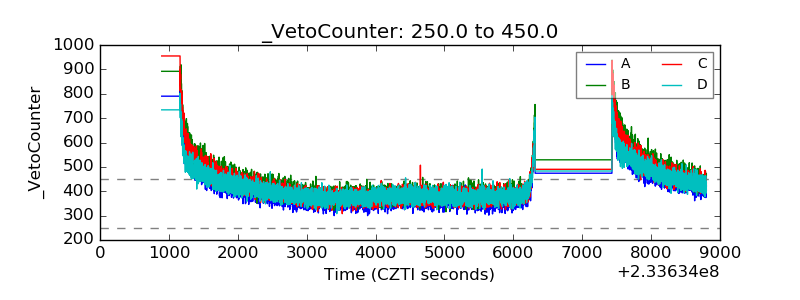 |