| Param | Original file | Final file |
|---|---|---|
| Filename | modeM0/AS1C02_037T01_9000001252_09001cztM0_level2.evt | modeM0/AS1C02_037T01_9000001252_09001cztM0_level2_quad_clean.evt |
| Size (bytes) | 476,098,560 | 78,281,280 |
| Size | 454.0 MB | 74.7 MB |
| Events in quadrant A | 3,864,220 | 486,985 |
| Events in quadrant B | 3,361,348 | 493,522 |
| Events in quadrant C | 3,133,101 | 480,830 |
| Events in quadrant D | 3,628,533 | 465,467 |
| Mode SS | |||
|---|---|---|---|
| Quadrant | BADHDUFLAG | Total packets | Discarded packets |
| A | 0 | 128 | 0 |
| B | 0 | 128 | 0 |
| C | 0 | 128 | 0 |
| D | 0 | 128 | 0 |
| Mode M0 | |||
|---|---|---|---|
| Quadrant | BADHDUFLAG | Total packets | Discarded packets |
| A | 0 | 15650 | 3 |
| B | 0 | 13809 | 2 |
| C | 0 | 13307 | 2 |
| D | 0 | 14700 | 2 |
| Mode M9 | |||
|---|---|---|---|
| Quadrant | BADHDUFLAG | Total packets | Discarded packets |
| A | 0 | 16 | 0 |
| B | 0 | 16 | 0 |
| C | 0 | 16 | 0 |
| D | 0 | 17 | 0 |
| Quadrant | Total seconds | Saturated seconds | Saturation percentage |
|---|---|---|---|
| A | 6361 | 100 | 1.572080% |
| B | 6361 | 94 | 1.477755% |
| C | 6361 | 72 | 1.131898% |
| D | 6361 | 114 | 1.792171% |
Noise dominated data is calculated using 1-second bins in cleaned event files. If a bin has >2000 counts, and if more than 50% of those come from <1% of pixels, then it is considered to be noise-dominated and hence unusable.
| Quadrant | # 1 sec bins | Bins with >0 counts | Bins with >2000 counts | High rate bins dominated by noise | Noise dominated (total time) | Noise dominated (detector-on time) | Marked lightcurve |
|---|---|---|---|---|---|---|---|
| A | 7551 | 6361 | 1 | 1 | 0.01% | 0.02% | 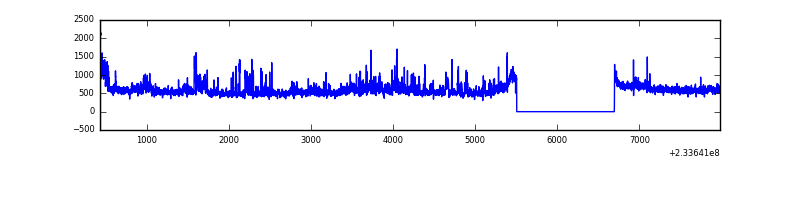 |
| B | 7551 | 6361 | 2 | 2 | 0.03% | 0.03% | 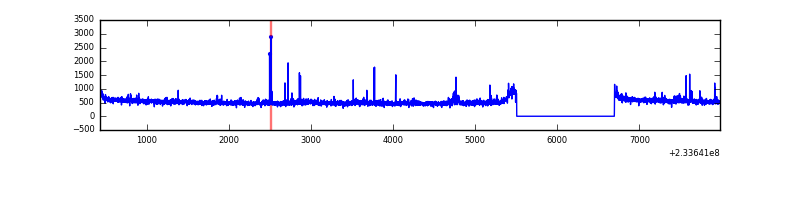 |
| C | 7551 | 6361 | 6 | 6 | 0.08% | 0.09% | 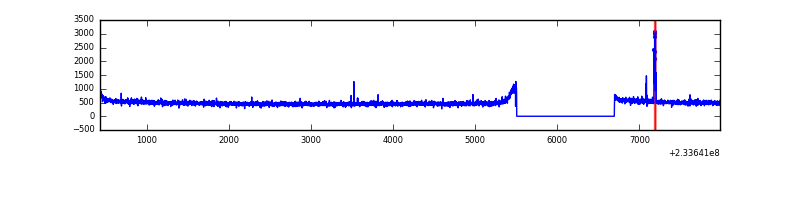 |
| D | 7551 | 6361 | 38 | 38 | 0.50% | 0.60% | 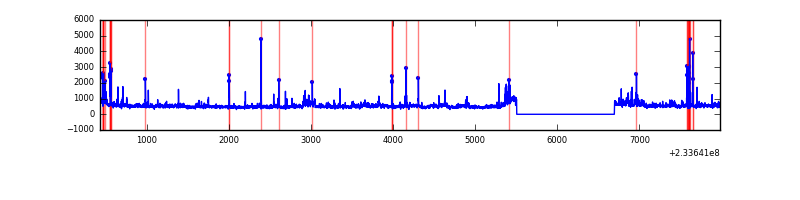 |
Top three noisy pixels from each quadrant. If the there are fewer than three noisy pixels in the level2.evt file, extra rows are filled as -1
| Pixel properties | Quadrant properties | ||||||
|---|---|---|---|---|---|---|---|
| Quadrant | DetID | PixID | Counts | Sigma | Mean | Median | Sigma |
| A | 8 | 5 | 614452 | 3648.83 | 826 | 810 | 168.2 |
| A | 3 | 1 | 40999 | 238.97 | 826 | 810 | 168.2 |
| A | 13 | 248 | 12905 | 71.92 | 826 | 810 | 168.2 |
| B | 6 | 51 | 36826 | 230.1 | 825 | 808 | 156.5 |
| B | 0 | 214 | 29833 | 185.43 | 825 | 808 | 156.5 |
| B | 0 | 230 | 16328 | 99.15 | 825 | 808 | 156.5 |
| C | 9 | 68 | 51898 | 279.49 | 787 | 793 | 182.9 |
| C | 1 | 3 | 6823 | 32.98 | 787 | 793 | 182.9 |
| C | 13 | 61 | 5920 | 28.04 | 787 | 793 | 182.9 |
| D | 1 | 52 | 233042 | 1092.42 | 783 | 767 | 212.6 |
| D | 14 | 50 | 114685 | 535.77 | 783 | 767 | 212.6 |
| D | 6 | 225 | 82281 | 383.37 | 783 | 767 | 212.6 |
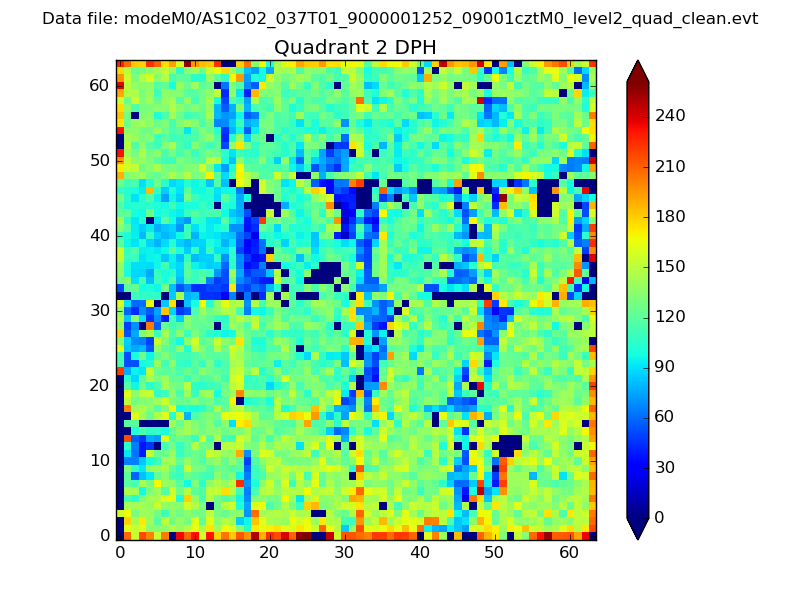
Histogram calculated using DETX and DETY for each event in the final _common_clean file
| Quadrant A | 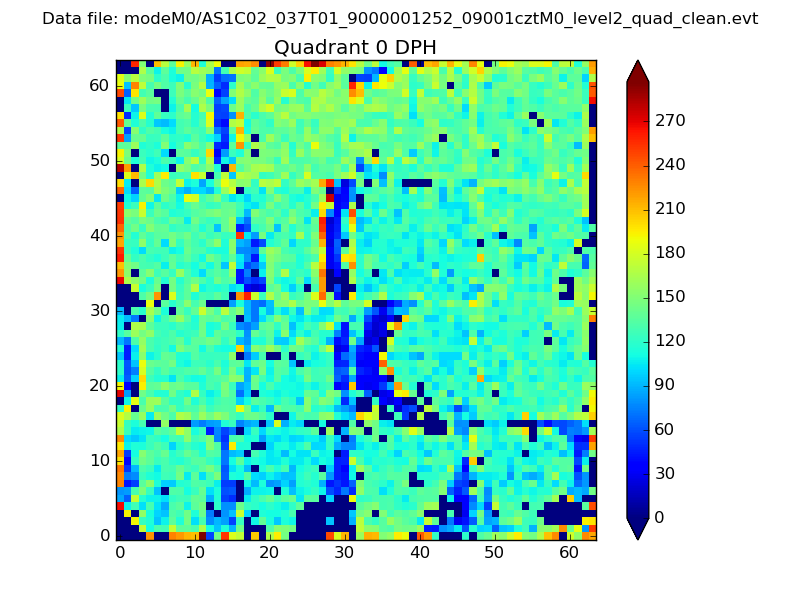 |
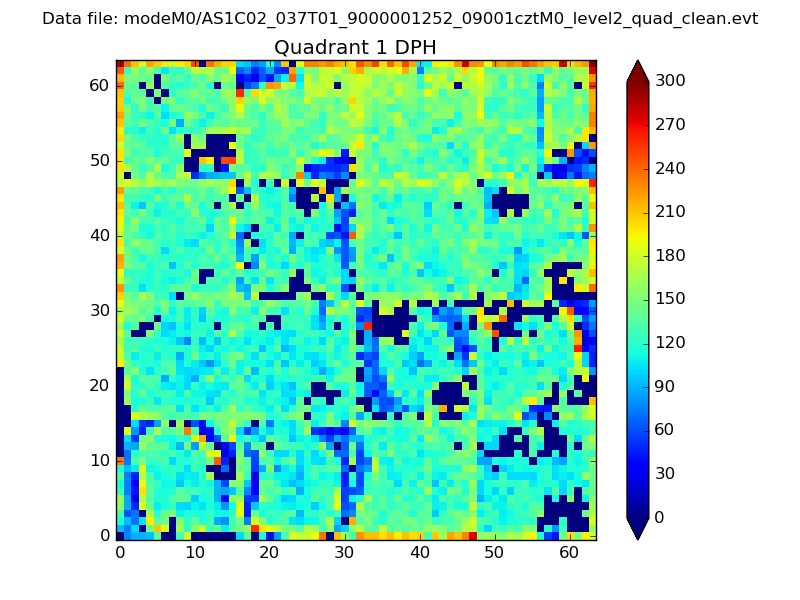 |
Quadrant B |
|---|---|---|---|
| Quadrant D | 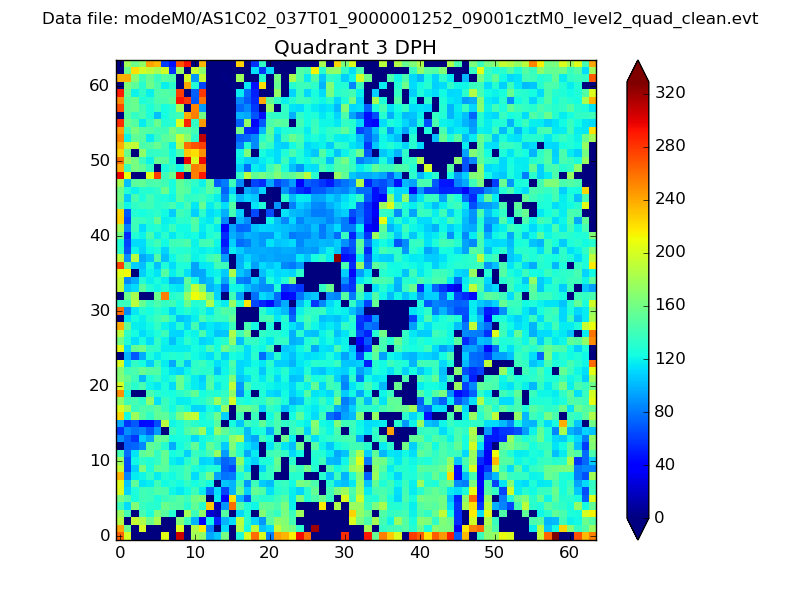 |
 |
Quadrant C |
| Plot type | Count rate plots | Images |
|---|---|---|
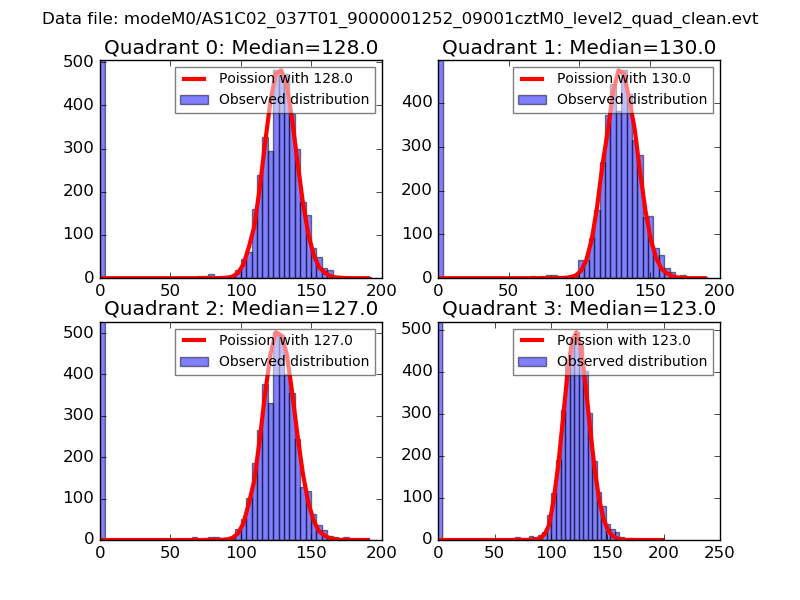
| Comparison with Poisson distribution Blue bars denote a histogram of data divided into 1 sec bins. Red curve is a Poisson curve with rate = median count rate of data. |
 |
 |
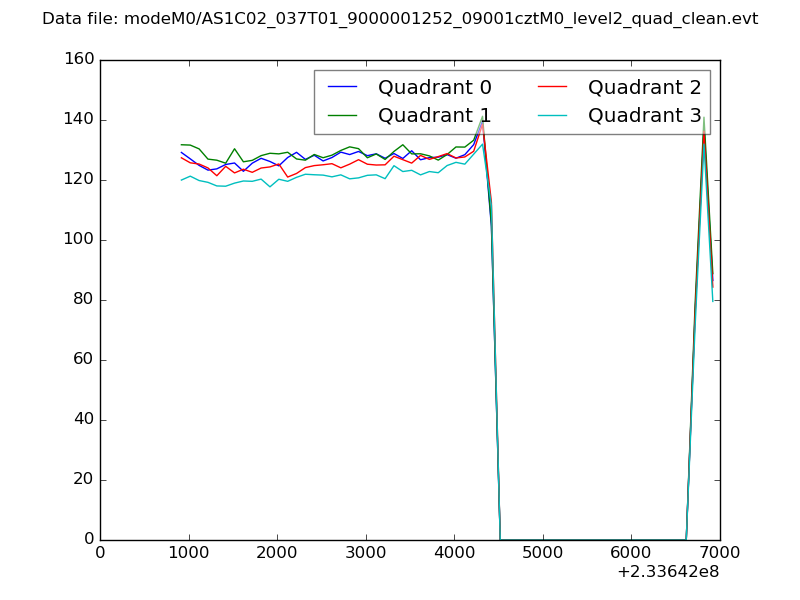
| Quadrant-wise count rates Data is divided into 100 sec bins |
 |
|
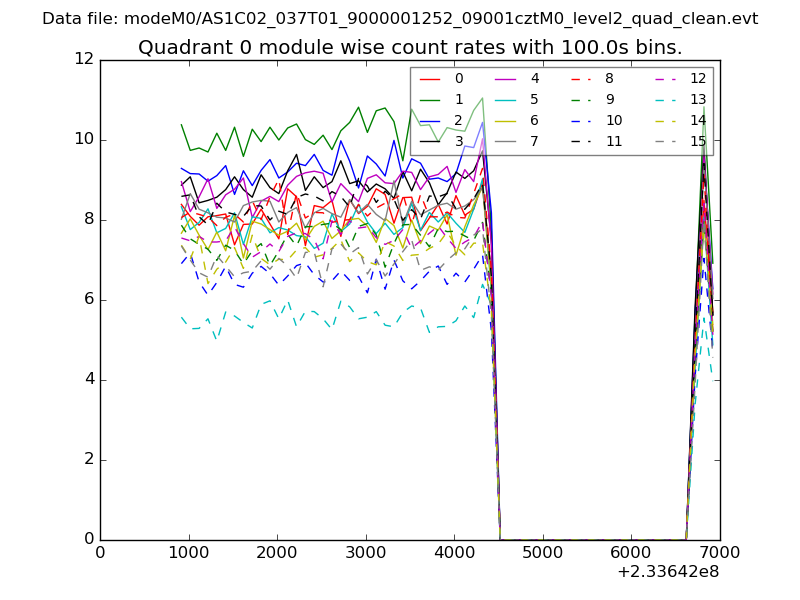
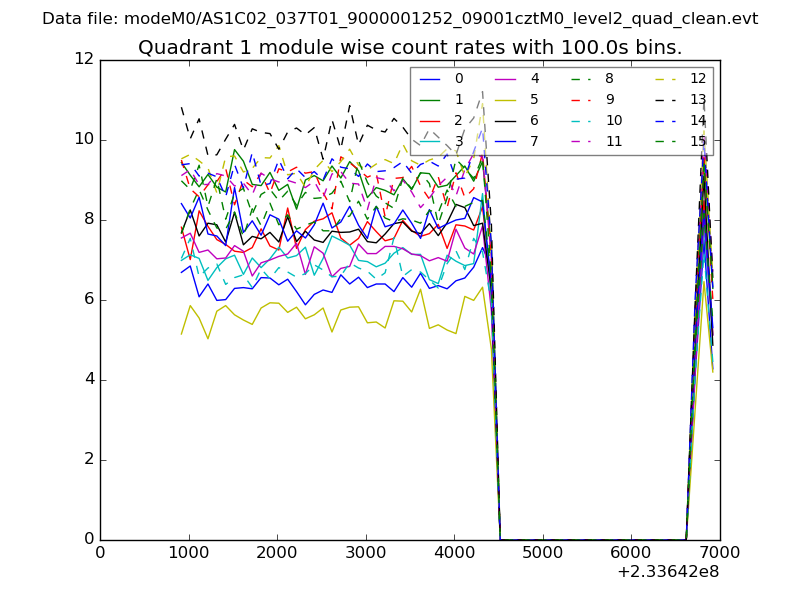
| Module-wise count rates for Quadrant A Data is divided into 100 sec bins |
 |
 |
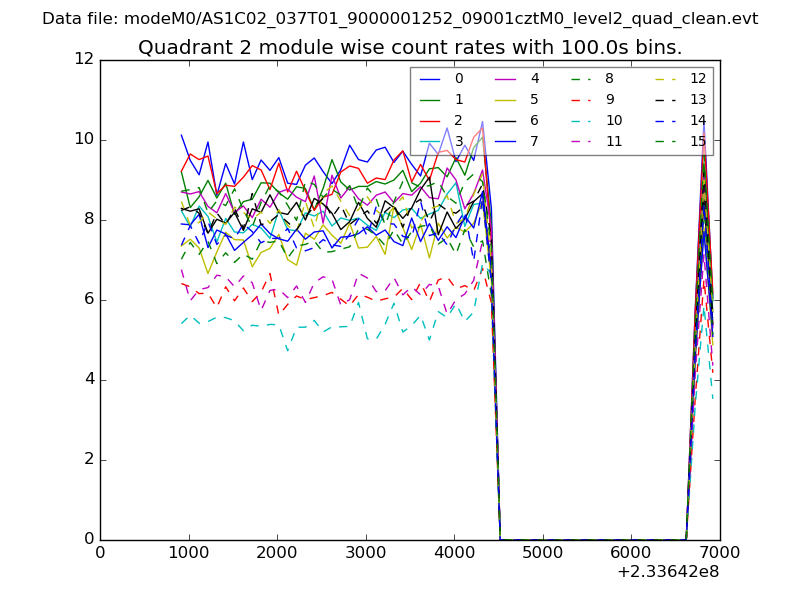
| Module-wise count rates for Quadrant B Data is divided into 100 sec bins |
 |
 |
| Module-wise count rates for Quadrant C Data is divided into 100 sec bins |
 |
 |
| Module-wise count rates for Quadrant D Data is divided into 100 sec bins |
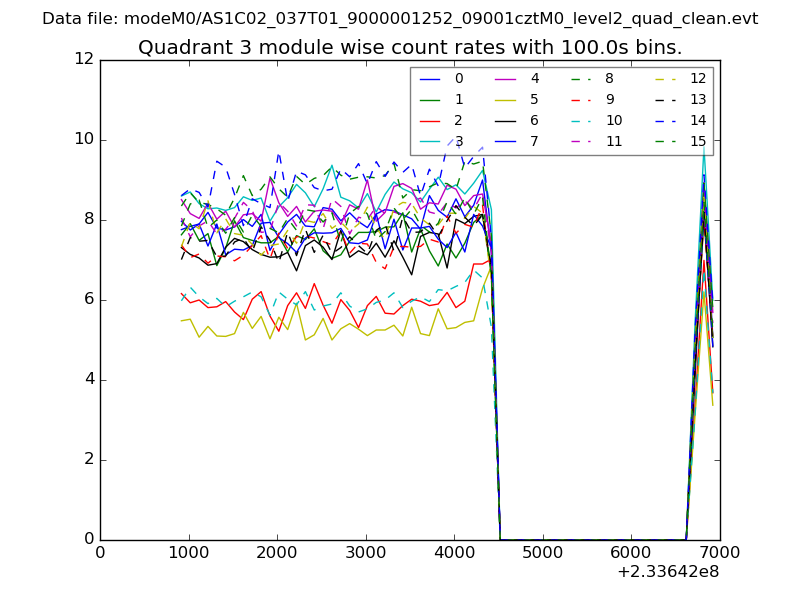 |
 |
| Parameter | Plot |
|---|---|
| CZT HV Monitor | 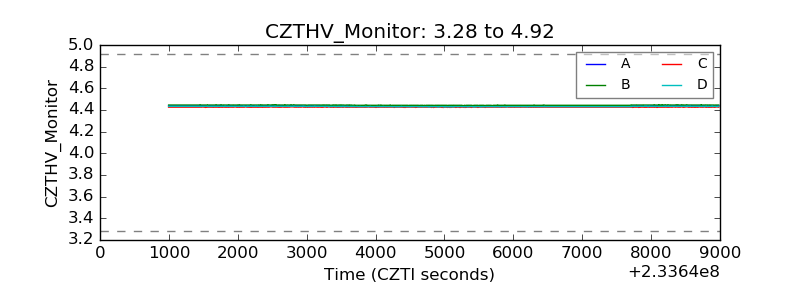 |
| D_VDD | 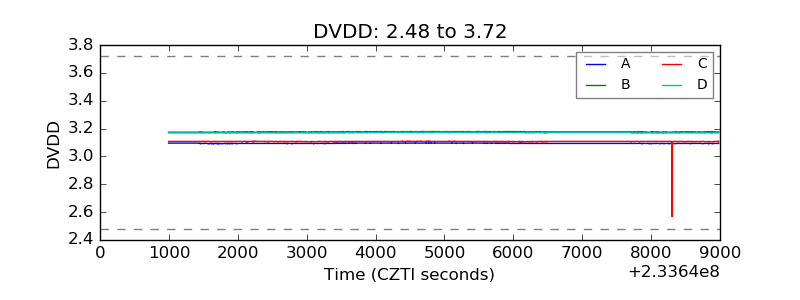 |
| Temperature 1 | 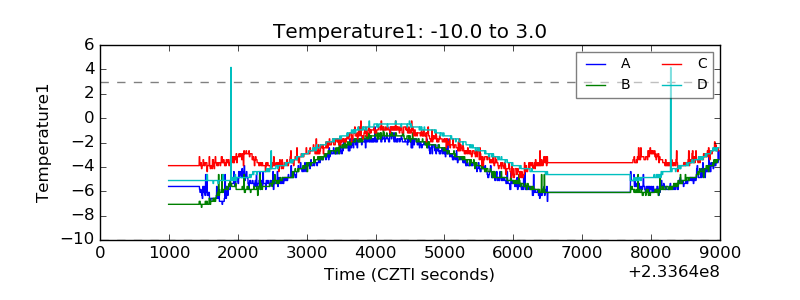 |
| Veto HV Monitor | 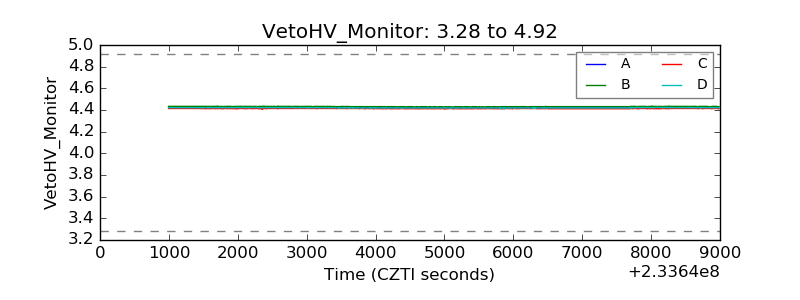 |
| Veto LLD | 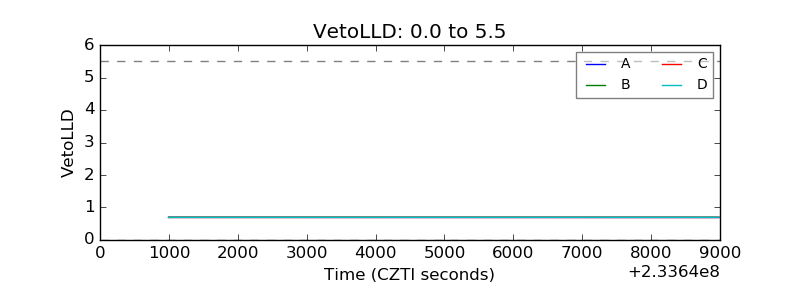 |
| Alpha Counter | 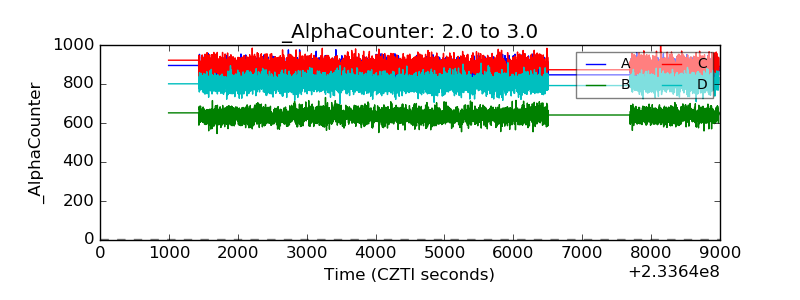 |
| _CPM_Rate | 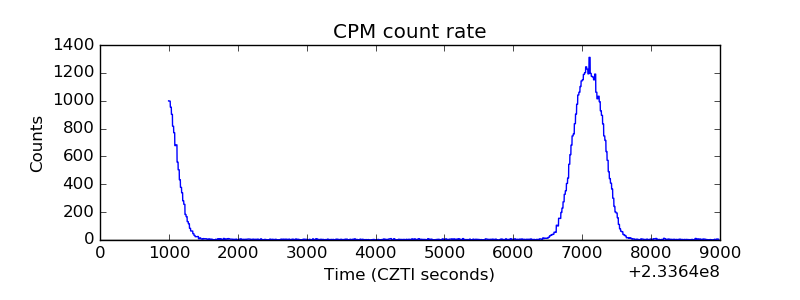 |
| CZT Counter | 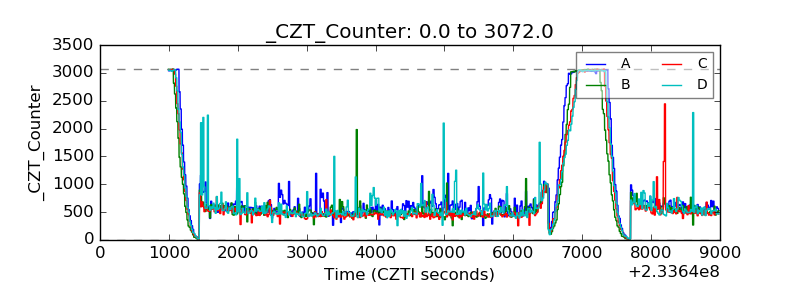 |
| +2.5 Volts monitor | 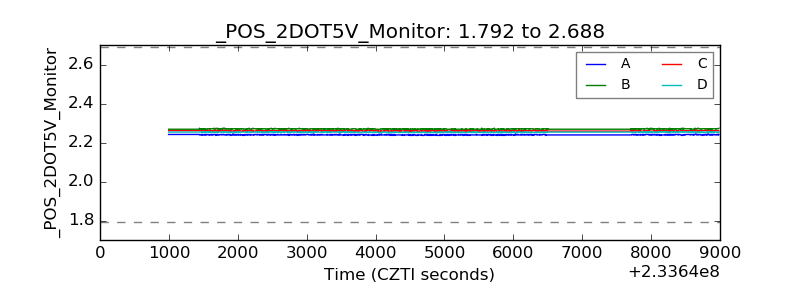 |
| +5 Volts monitor |  |
| _ROLL_ROT | 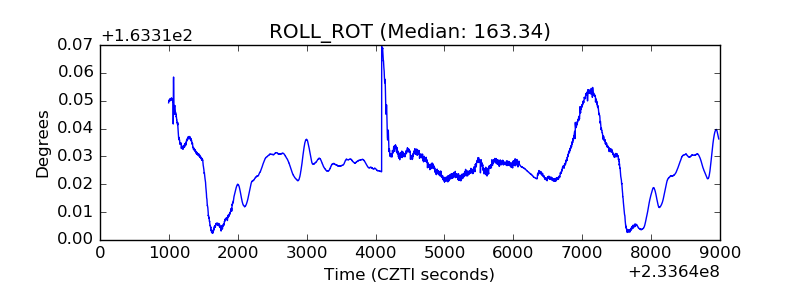 |
| _Roll_DEC | 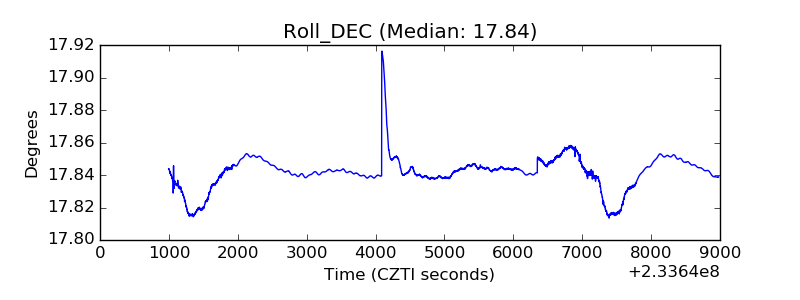 |
| _Roll_RA | 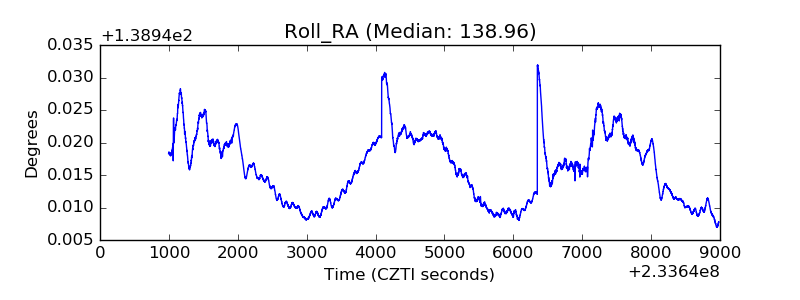 |
| Veto Counter | 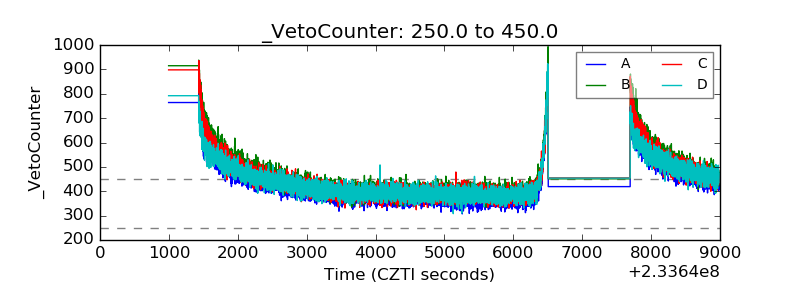 |