| Param | Original file | Final file |
|---|---|---|
| Filename | modeM0/AS1C02_037T01_9000001252_09002cztM0_level2.evt | modeM0/AS1C02_037T01_9000001252_09002cztM0_level2_quad_clean.evt |
| Size (bytes) | 488,882,880 | 87,793,920 |
| Size | 466.2 MB | 83.7 MB |
| Events in quadrant A | 4,063,456 | 560,469 |
| Events in quadrant B | 3,450,649 | 569,289 |
| Events in quadrant C | 3,164,279 | 551,003 |
| Events in quadrant D | 3,693,714 | 532,010 |
| Mode SS | |||
|---|---|---|---|
| Quadrant | BADHDUFLAG | Total packets | Discarded packets |
| A | 0 | 128 | 0 |
| B | 0 | 128 | 0 |
| C | 0 | 128 | 0 |
| D | 0 | 128 | 0 |
| Mode M0 | |||
|---|---|---|---|
| Quadrant | BADHDUFLAG | Total packets | Discarded packets |
| A | 0 | 16481 | 3 |
| B | 0 | 14107 | 2 |
| C | 0 | 13434 | 2 |
| D | 0 | 14917 | 2 |
| Mode M9 | |||
|---|---|---|---|
| Quadrant | BADHDUFLAG | Total packets | Discarded packets |
| A | 0 | 17 | 0 |
| B | 0 | 17 | 0 |
| C | 0 | 17 | 0 |
| D | 0 | 18 | 0 |
| Quadrant | Total seconds | Saturated seconds | Saturation percentage |
|---|---|---|---|
| A | 6396 | 131 | 2.048155% |
| B | 6396 | 118 | 1.844903% |
| C | 6396 | 88 | 1.375860% |
| D | 6396 | 123 | 1.923077% |
Noise dominated data is calculated using 1-second bins in cleaned event files. If a bin has >2000 counts, and if more than 50% of those come from <1% of pixels, then it is considered to be noise-dominated and hence unusable.
| Quadrant | # 1 sec bins | Bins with >0 counts | Bins with >2000 counts | High rate bins dominated by noise | Noise dominated (total time) | Noise dominated (detector-on time) | Marked lightcurve |
|---|---|---|---|---|---|---|---|
| A | 7591 | 6396 | 6 | 6 | 0.08% | 0.09% | 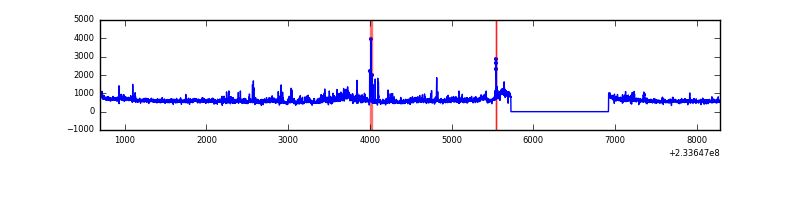 |
| B | 7591 | 6396 | 4 | 4 | 0.05% | 0.06% | 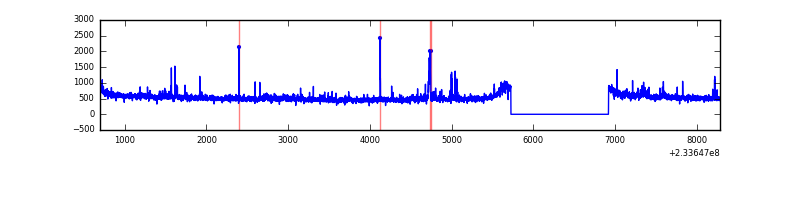 |
| C | 7591 | 6396 | 6 | 6 | 0.08% | 0.09% | 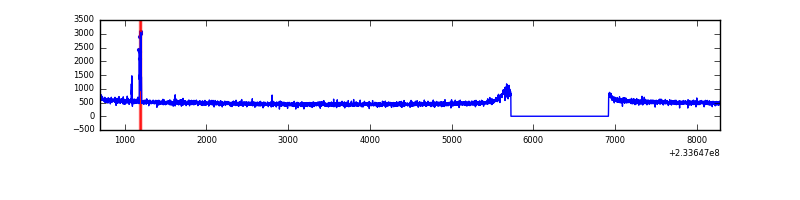 |
| D | 7591 | 6396 | 28 | 28 | 0.37% | 0.44% | 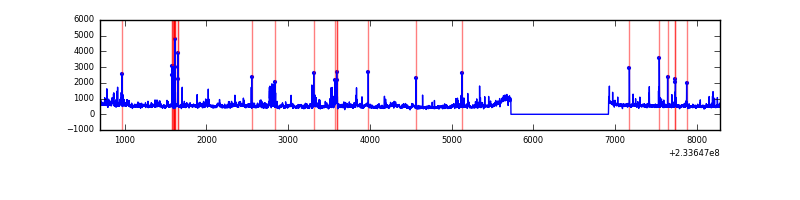 |
Top three noisy pixels from each quadrant. If the there are fewer than three noisy pixels in the level2.evt file, extra rows are filled as -1
| Pixel properties | Quadrant properties | ||||||
|---|---|---|---|---|---|---|---|
| Quadrant | DetID | PixID | Counts | Sigma | Mean | Median | Sigma |
| A | 8 | 5 | 673118 | 3970.92 | 841 | 825 | 169.3 |
| A | 3 | 1 | 109612 | 642.55 | 841 | 825 | 169.3 |
| A | 5 | 16 | 18547 | 104.68 | 841 | 825 | 169.3 |
| B | 6 | 51 | 63923 | 397.57 | 838 | 822 | 158.7 |
| B | 0 | 230 | 34661 | 213.2 | 838 | 822 | 158.7 |
| B | 0 | 219 | 27032 | 165.13 | 838 | 822 | 158.7 |
| C | 9 | 68 | 34668 | 181.71 | 801 | 805 | 186.4 |
| C | 1 | 3 | 6659 | 31.41 | 801 | 805 | 186.4 |
| C | 13 | 61 | 5985 | 27.79 | 801 | 805 | 186.4 |
| D | 1 | 52 | 273321 | 1243.5 | 804 | 789 | 219.2 |
| D | 14 | 50 | 132997 | 603.23 | 804 | 789 | 219.2 |
| D | 12 | 233 | 73135 | 330.1 | 804 | 789 | 219.2 |
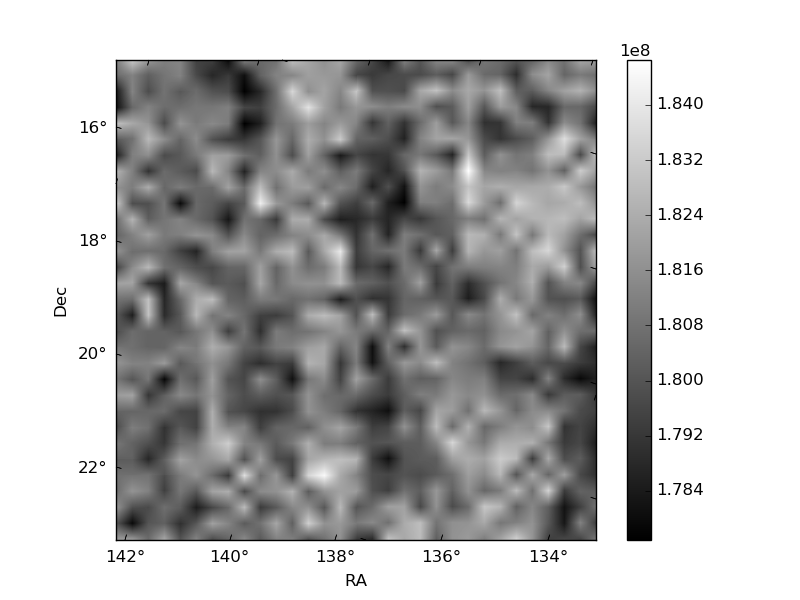
Histogram calculated using DETX and DETY for each event in the final _common_clean file
| Quadrant A | 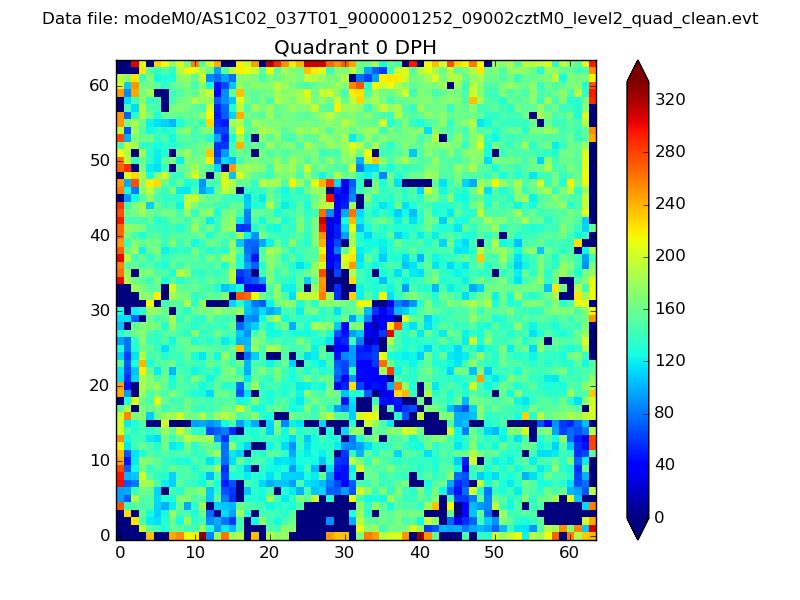 |
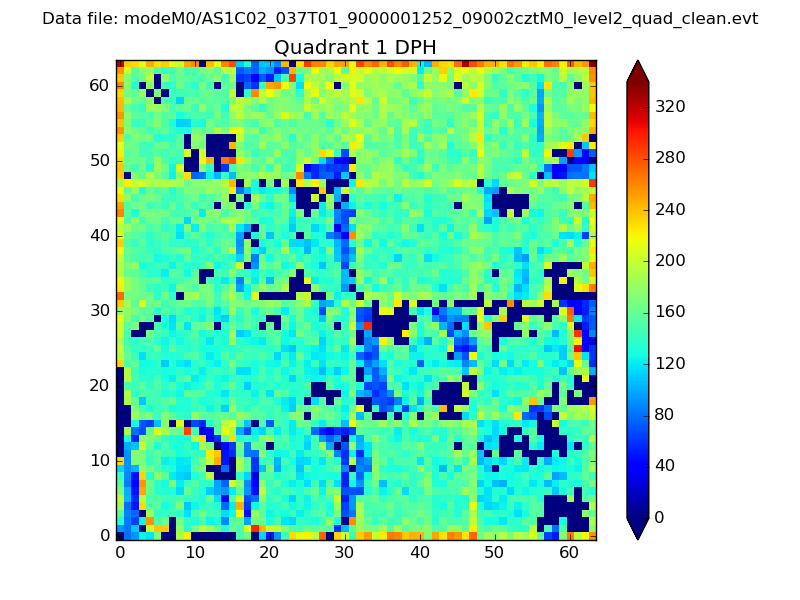 |
Quadrant B |
|---|---|---|---|
| Quadrant D | 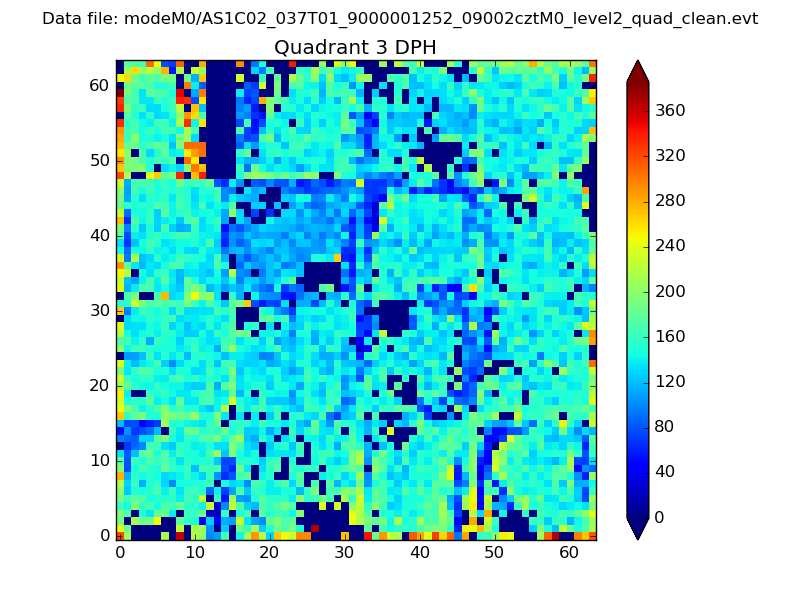 |
 |
Quadrant C |
| Plot type | Count rate plots | Images |
|---|---|---|
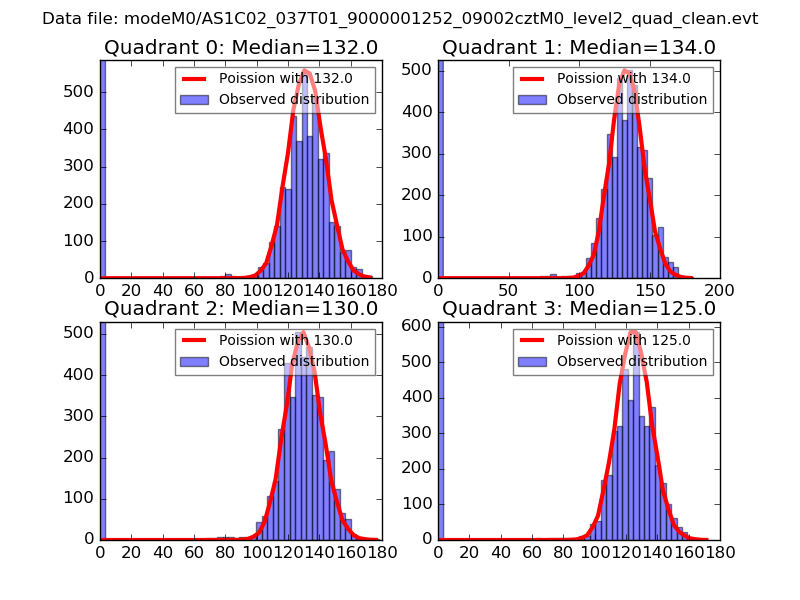
| Comparison with Poisson distribution Blue bars denote a histogram of data divided into 1 sec bins. Red curve is a Poisson curve with rate = median count rate of data. |
 |
 |
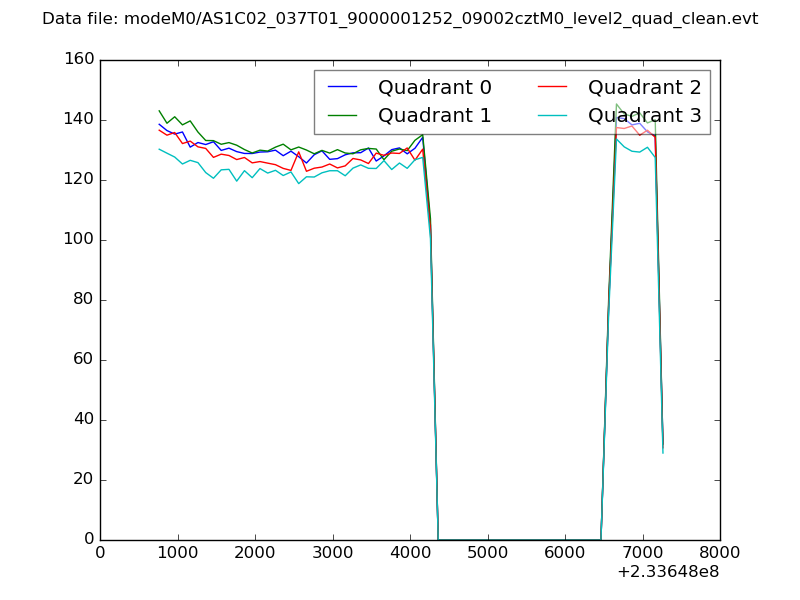
| Quadrant-wise count rates Data is divided into 100 sec bins |
 |
|
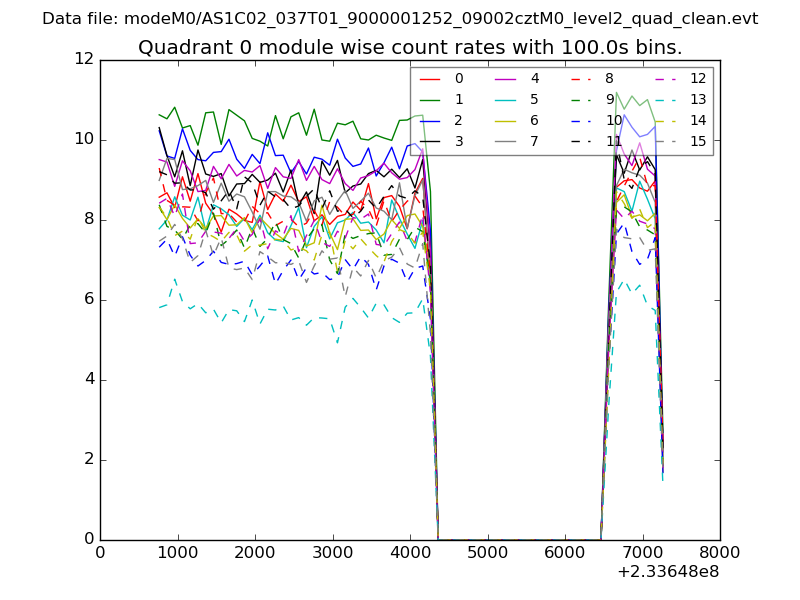
| Module-wise count rates for Quadrant A Data is divided into 100 sec bins |
 |
 |
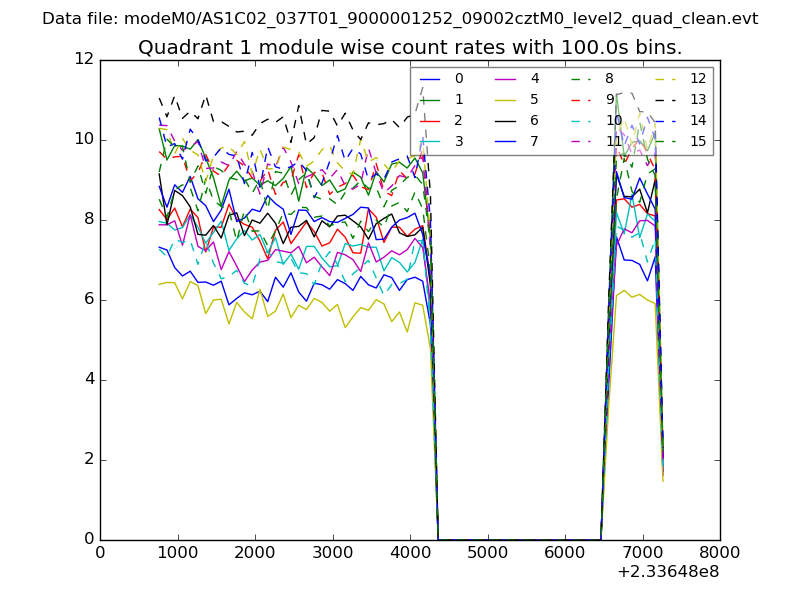
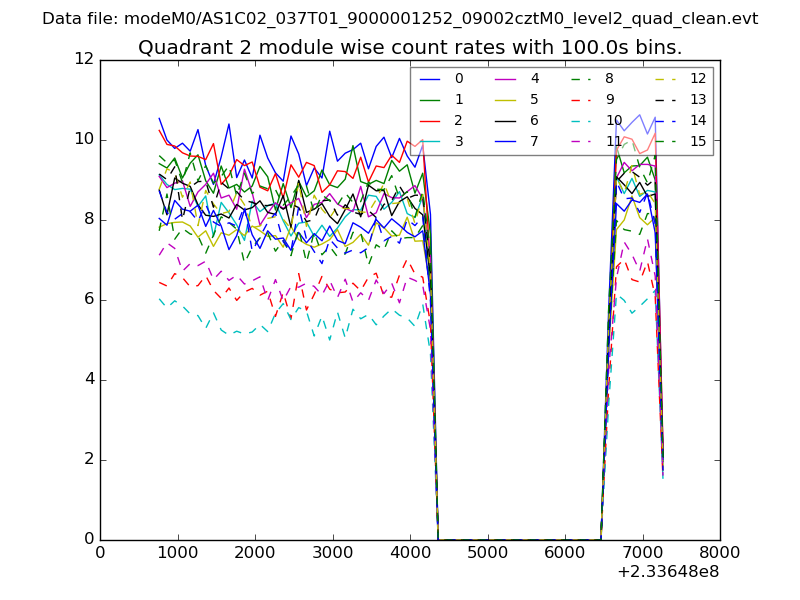
| Module-wise count rates for Quadrant B Data is divided into 100 sec bins |
 |
 |
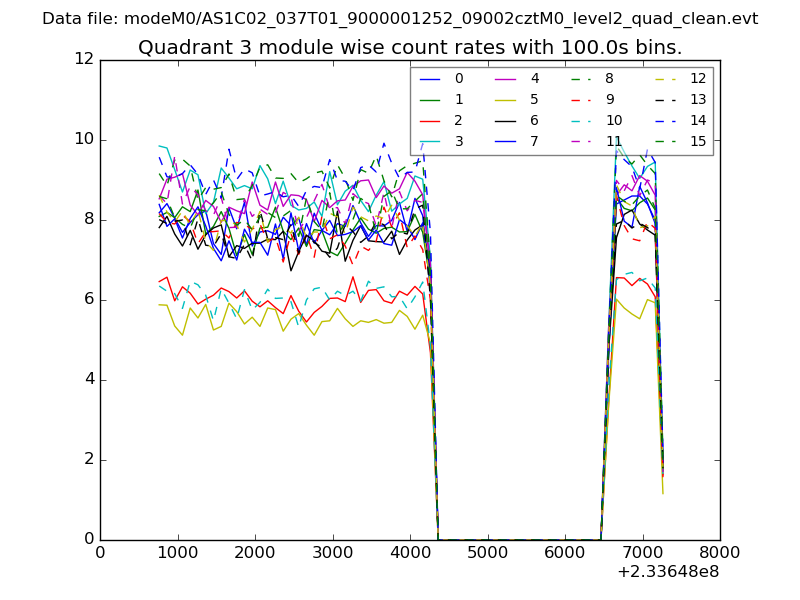
| Module-wise count rates for Quadrant C Data is divided into 100 sec bins |
 |
 |
| Module-wise count rates for Quadrant D Data is divided into 100 sec bins |
 |
 |
| Parameter | Plot |
|---|---|
| CZT HV Monitor | 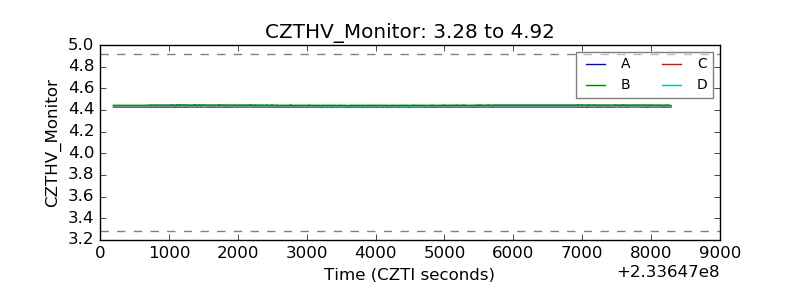 |
| D_VDD | 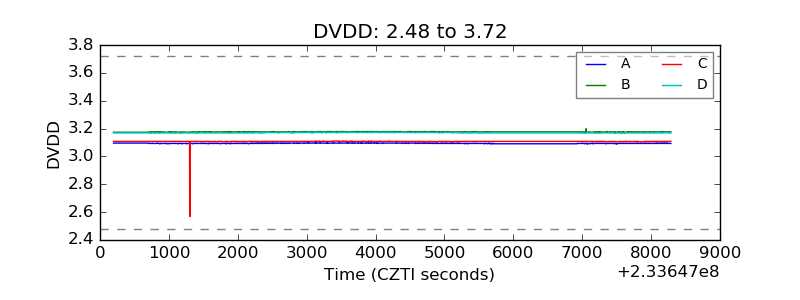 |
| Temperature 1 | 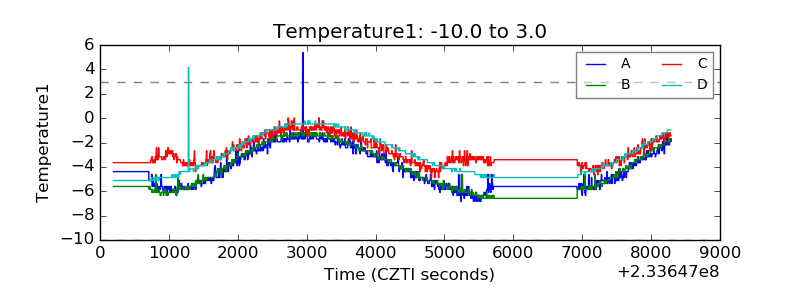 |
| Veto HV Monitor | 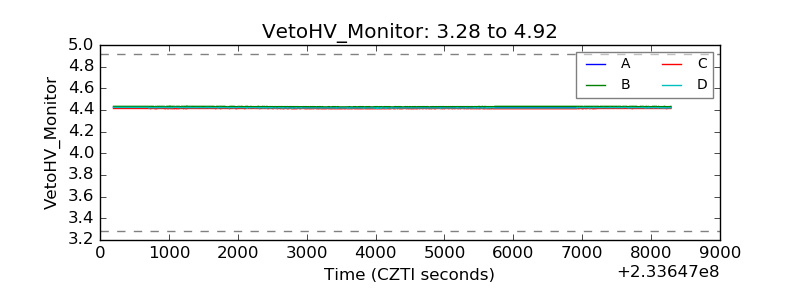 |
| Veto LLD | 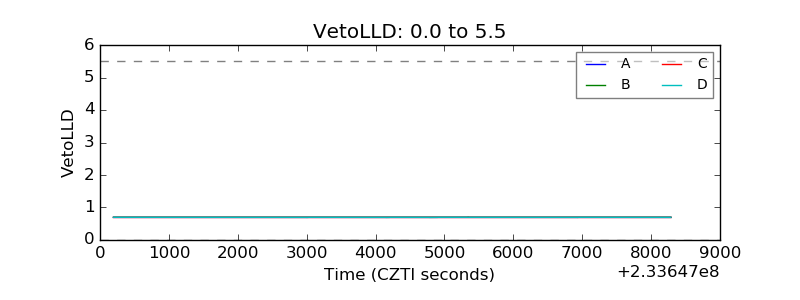 |
| Alpha Counter | 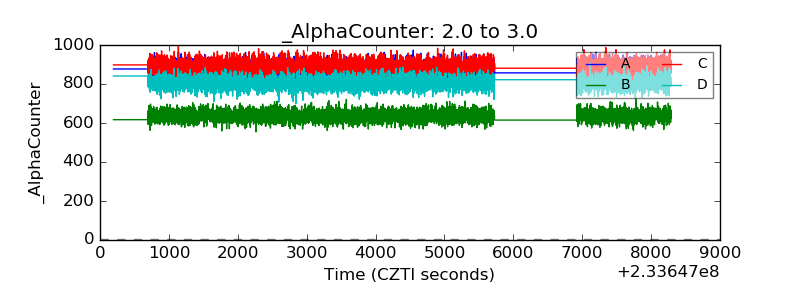 |
| _CPM_Rate | 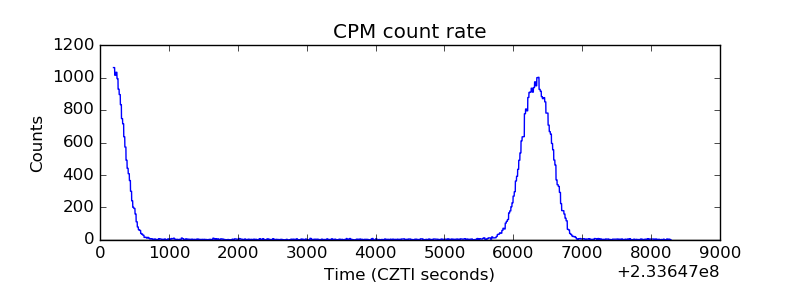 |
| CZT Counter |  |
| +2.5 Volts monitor |  |
| +5 Volts monitor |  |
| _ROLL_ROT | 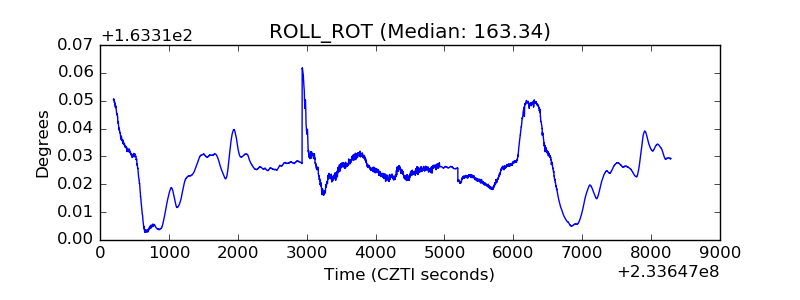 |
| _Roll_DEC | 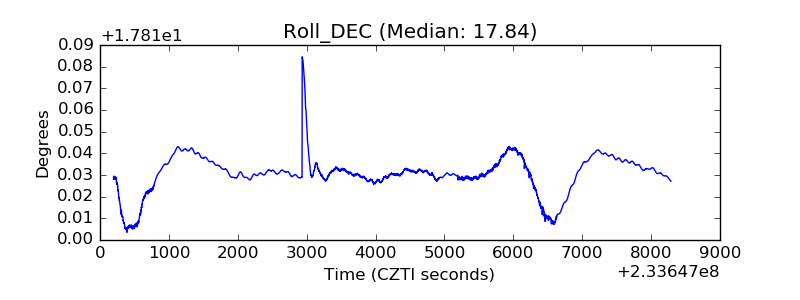 |
| _Roll_RA | 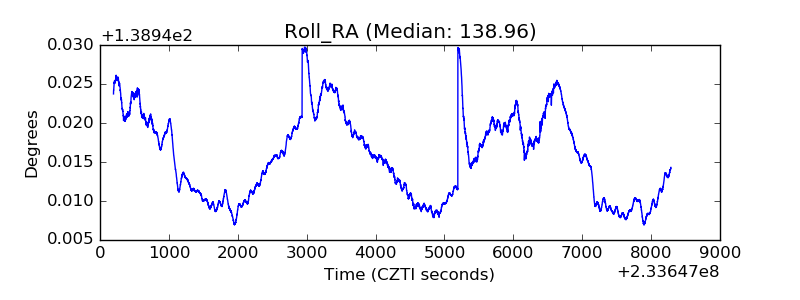 |
| Veto Counter | 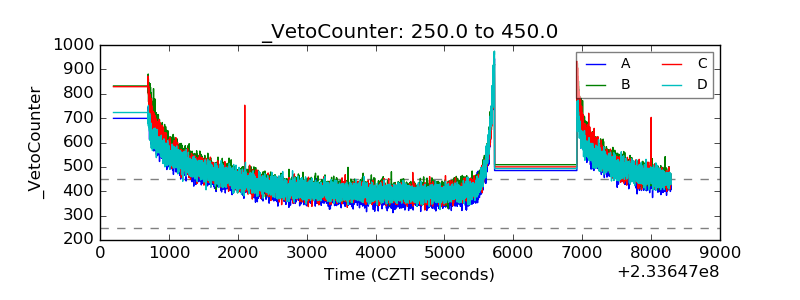 |