| Param | Original file | Final file |
|---|---|---|
| Filename | modeM0/AS1C02_037T01_9000001252_09003cztM0_level2.evt | modeM0/AS1C02_037T01_9000001252_09003cztM0_level2_quad_clean.evt |
| Size (bytes) | 480,352,320 | 93,412,800 |
| Size | 458.1 MB | 89.1 MB |
| Events in quadrant A | 3,964,597 | 606,022 |
| Events in quadrant B | 3,479,407 | 610,501 |
| Events in quadrant C | 3,084,847 | 592,835 |
| Events in quadrant D | 3,584,460 | 573,385 |
| Mode SS | |||
|---|---|---|---|
| Quadrant | BADHDUFLAG | Total packets | Discarded packets |
| A | 0 | 130 | 0 |
| B | 0 | 130 | 0 |
| C | 0 | 130 | 0 |
| D | 0 | 130 | 0 |
| Mode M0 | |||
|---|---|---|---|
| Quadrant | BADHDUFLAG | Total packets | Discarded packets |
| A | 0 | 15975 | 3 |
| B | 0 | 14184 | 2 |
| C | 0 | 13286 | 2 |
| D | 0 | 14608 | 2 |
| Mode M9 | |||
|---|---|---|---|
| Quadrant | BADHDUFLAG | Total packets | Discarded packets |
| A | 0 | 16 | 0 |
| B | 0 | 16 | 0 |
| C | 0 | 16 | 0 |
| D | 0 | 17 | 0 |
| Quadrant | Total seconds | Saturated seconds | Saturation percentage |
|---|---|---|---|
| A | 6393 | 155 | 2.424527% |
| B | 6393 | 158 | 2.471453% |
| C | 6393 | 92 | 1.439074% |
| D | 6393 | 193 | 3.018927% |
Noise dominated data is calculated using 1-second bins in cleaned event files. If a bin has >2000 counts, and if more than 50% of those come from <1% of pixels, then it is considered to be noise-dominated and hence unusable.
| Quadrant | # 1 sec bins | Bins with >0 counts | Bins with >2000 counts | High rate bins dominated by noise | Noise dominated (total time) | Noise dominated (detector-on time) | Marked lightcurve |
|---|---|---|---|---|---|---|---|
| A | 7563 | 6393 | 3 | 3 | 0.04% | 0.05% | 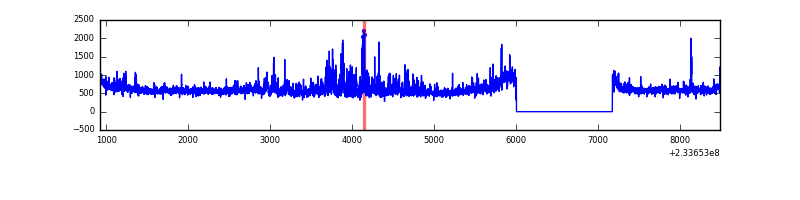 |
| B | 7563 | 6393 | 18 | 18 | 0.24% | 0.28% |  |
| C | 7563 | 6393 | 0 | 0 | 0.00% | 0.00% | 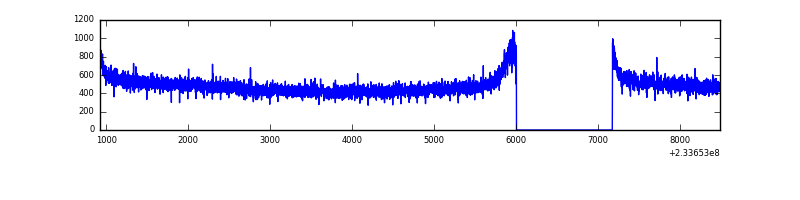 |
| D | 7563 | 6393 | 76 | 76 | 1.00% | 1.19% | 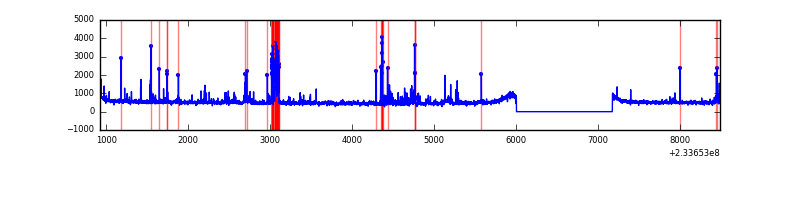 |
Top three noisy pixels from each quadrant. If the there are fewer than three noisy pixels in the level2.evt file, extra rows are filled as -1
| Pixel properties | Quadrant properties | ||||||
|---|---|---|---|---|---|---|---|
| Quadrant | DetID | PixID | Counts | Sigma | Mean | Median | Sigma |
| A | 8 | 5 | 725696 | 4325.88 | 830 | 814 | 167.6 |
| A | 3 | 1 | 19018 | 108.64 | 830 | 814 | 167.6 |
| A | 13 | 248 | 13664 | 76.68 | 830 | 814 | 167.6 |
| B | 10 | 16 | 83813 | 527.23 | 822 | 803 | 157.4 |
| B | 0 | 214 | 68538 | 430.21 | 822 | 803 | 157.4 |
| B | 6 | 51 | 35095 | 217.8 | 822 | 803 | 157.4 |
| C | 13 | 61 | 6030 | 28.55 | 790 | 793 | 183.4 |
| C | 9 | 68 | 2555 | 9.61 | 790 | 793 | 183.4 |
| C | 3 | 202 | 2057 | 6.89 | 790 | 793 | 183.4 |
| D | 4 | 95 | 258641 | 1315.42 | 802 | 780 | 196.0 |
| D | 1 | 52 | 72906 | 367.94 | 802 | 780 | 196.0 |
| D | 14 | 50 | 67841 | 342.1 | 802 | 780 | 196.0 |
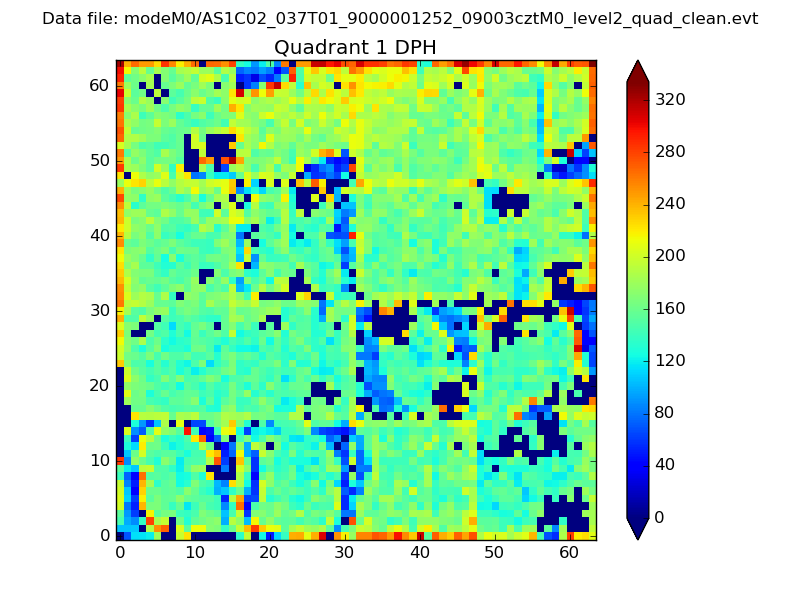
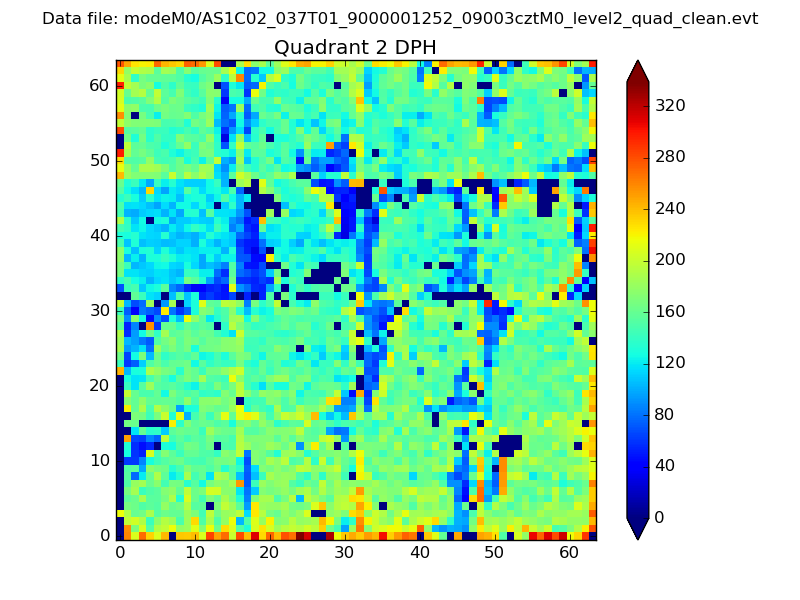
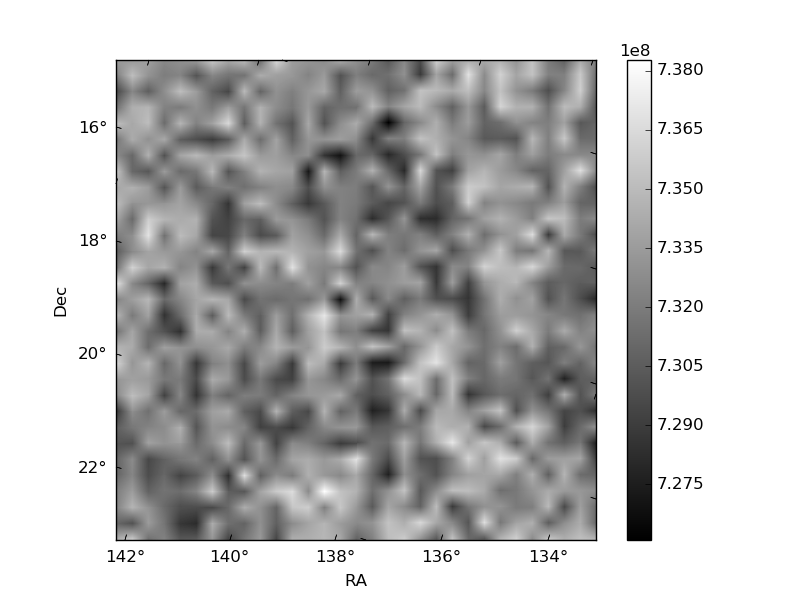
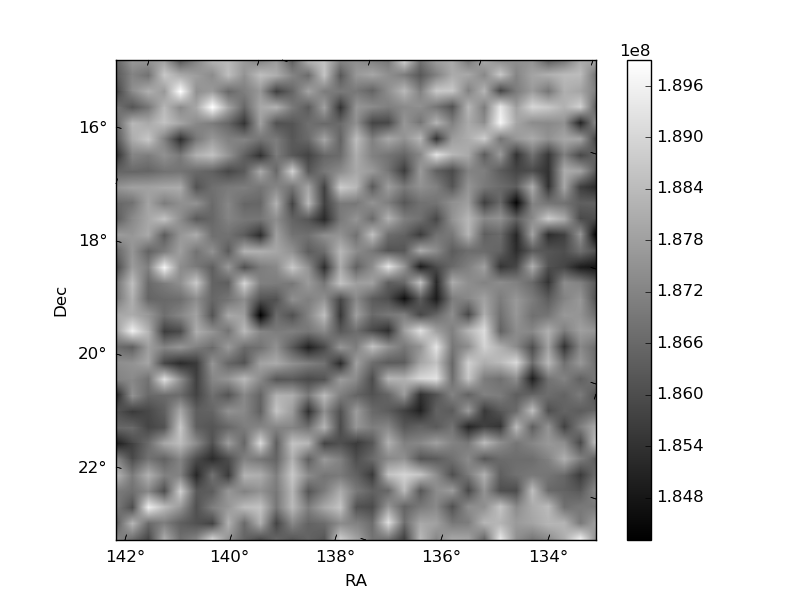
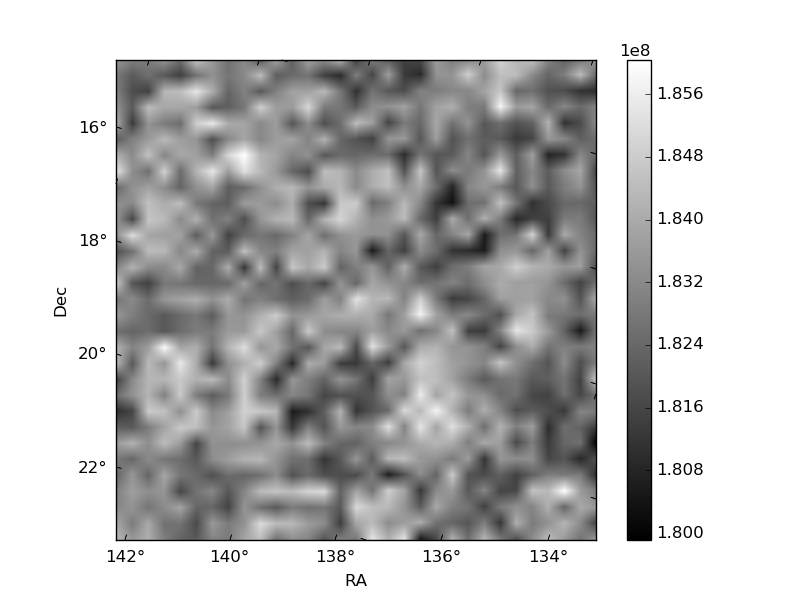
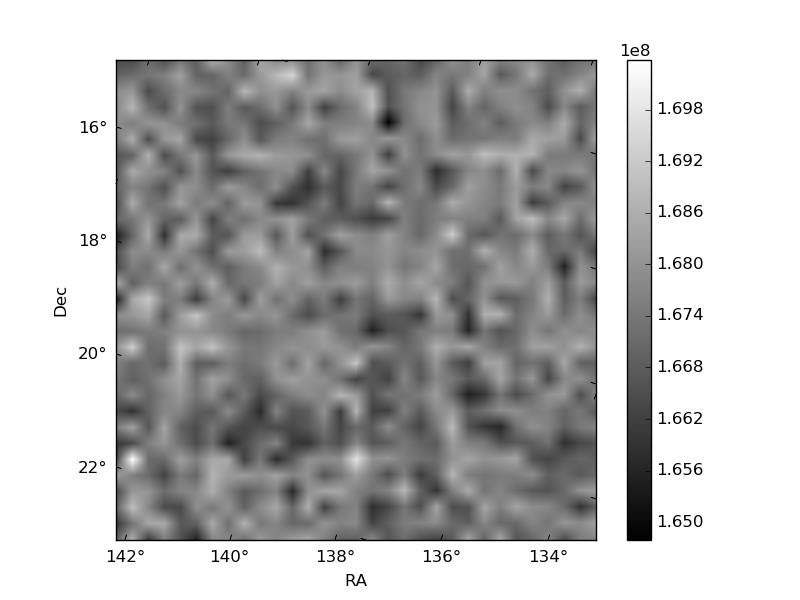
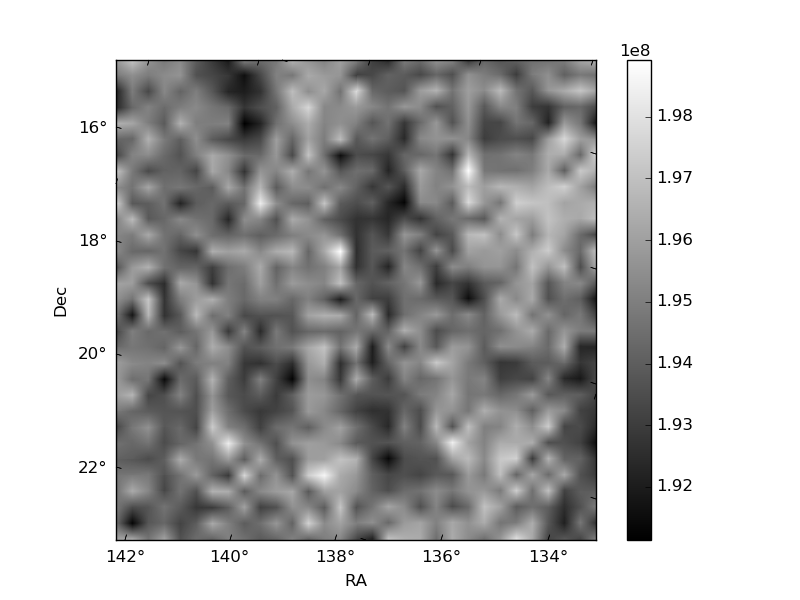
Histogram calculated using DETX and DETY for each event in the final _common_clean file
| Quadrant A | 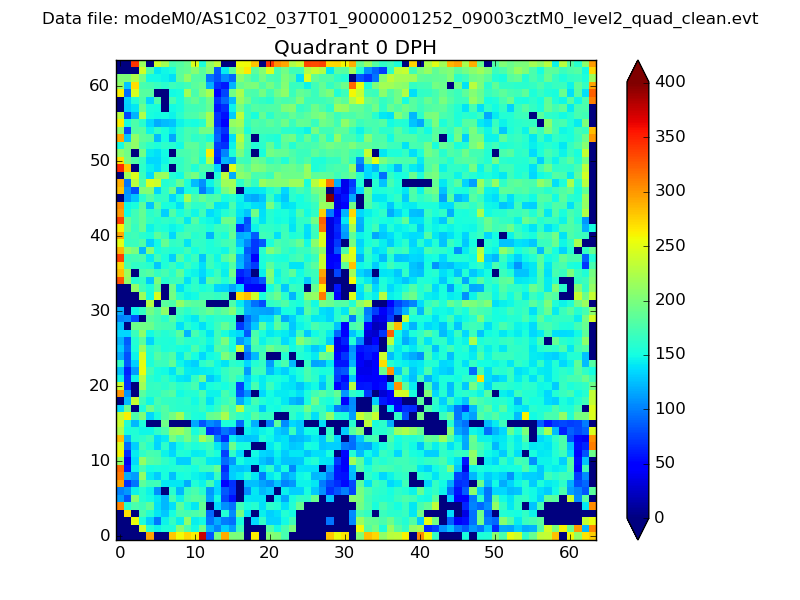 |
 |
Quadrant B |
|---|---|---|---|
| Quadrant D | 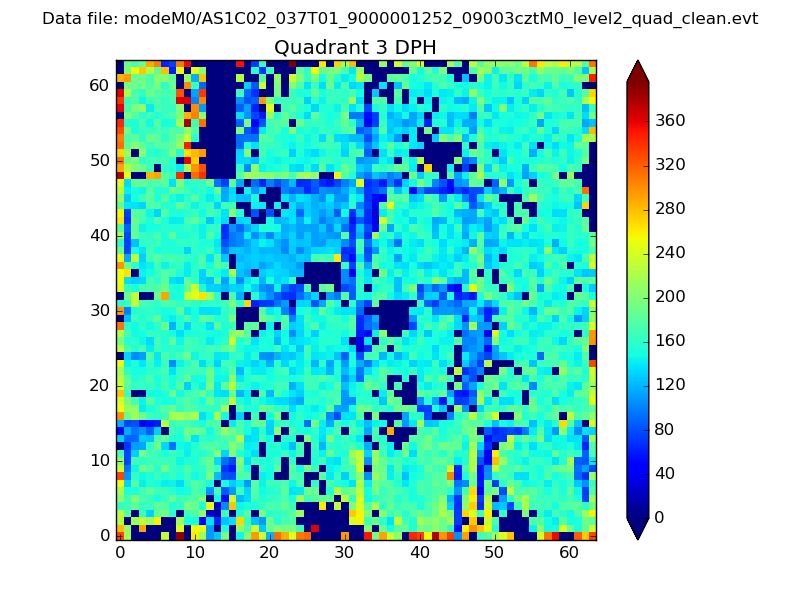 |
 |
Quadrant C |
| Plot type | Count rate plots | Images |
|---|---|---|
| Comparison with Poisson distribution Blue bars denote a histogram of data divided into 1 sec bins. Red curve is a Poisson curve with rate = median count rate of data. |
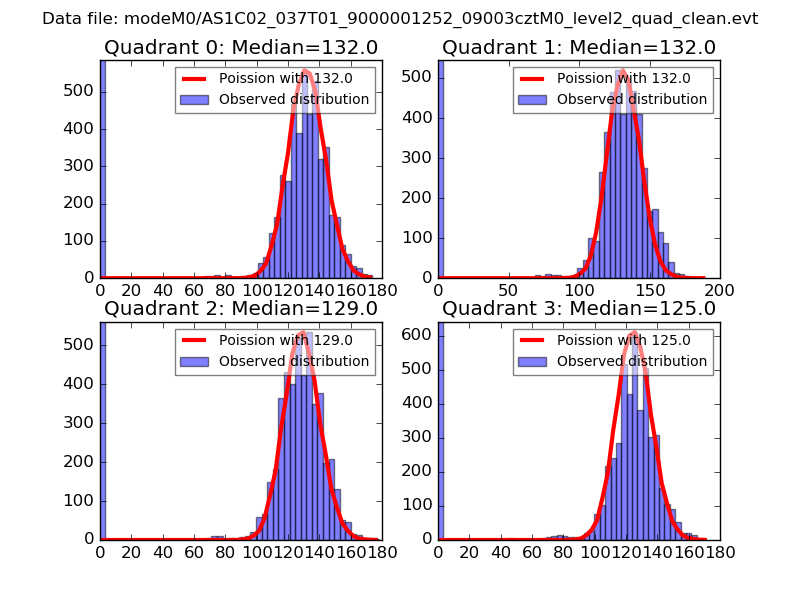 |
 |
| Quadrant-wise count rates Data is divided into 100 sec bins |
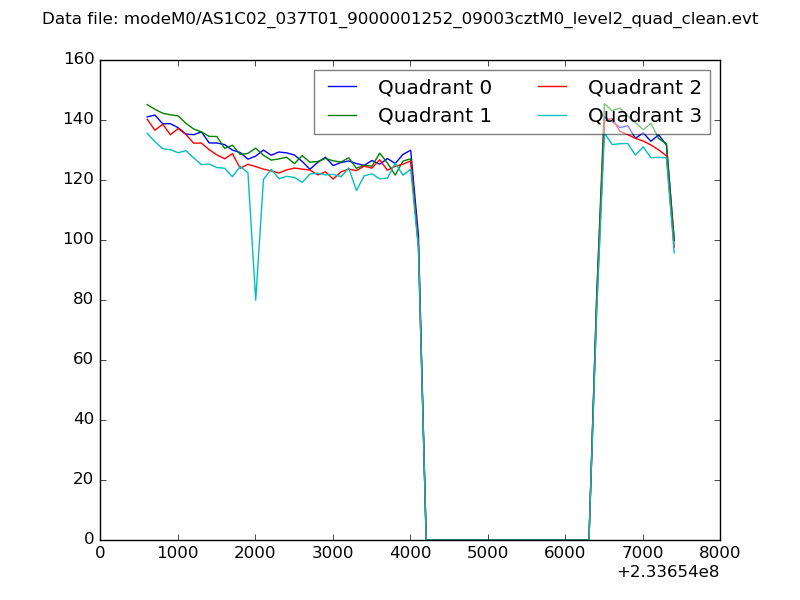 |
|
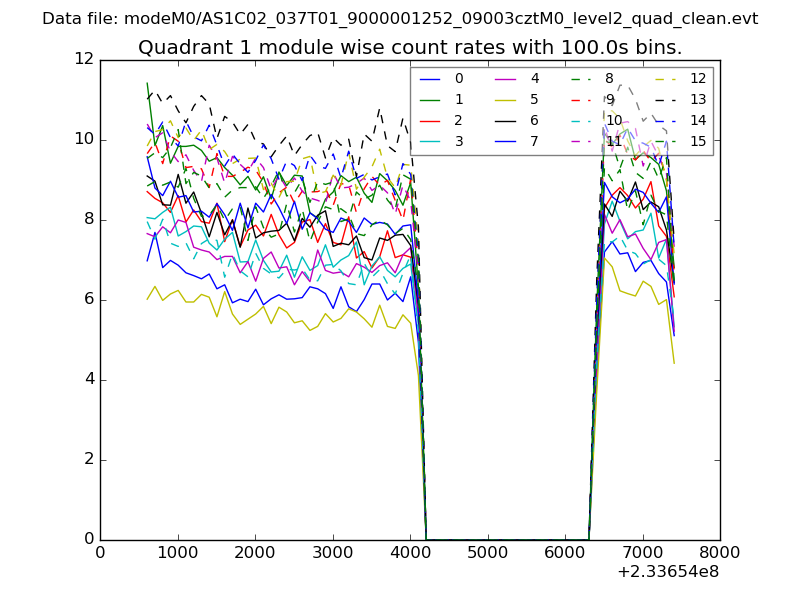
| Module-wise count rates for Quadrant A Data is divided into 100 sec bins |
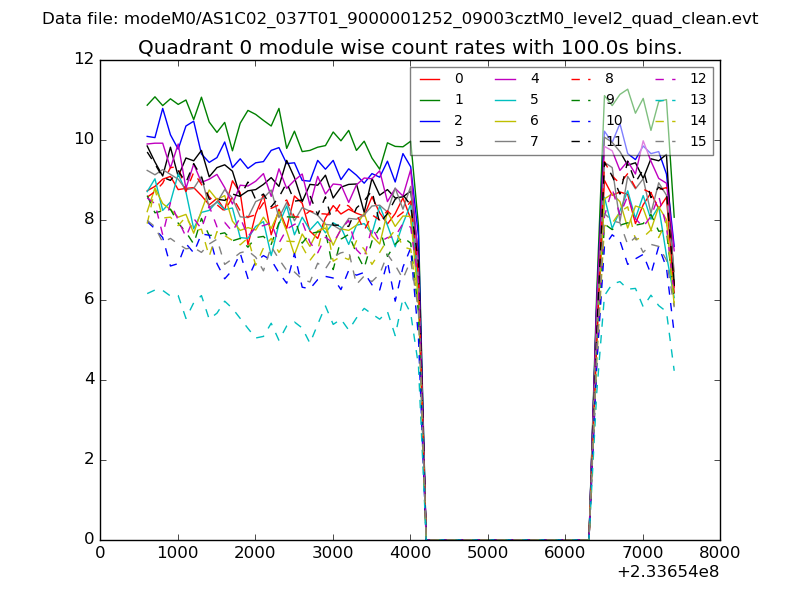 |
 |
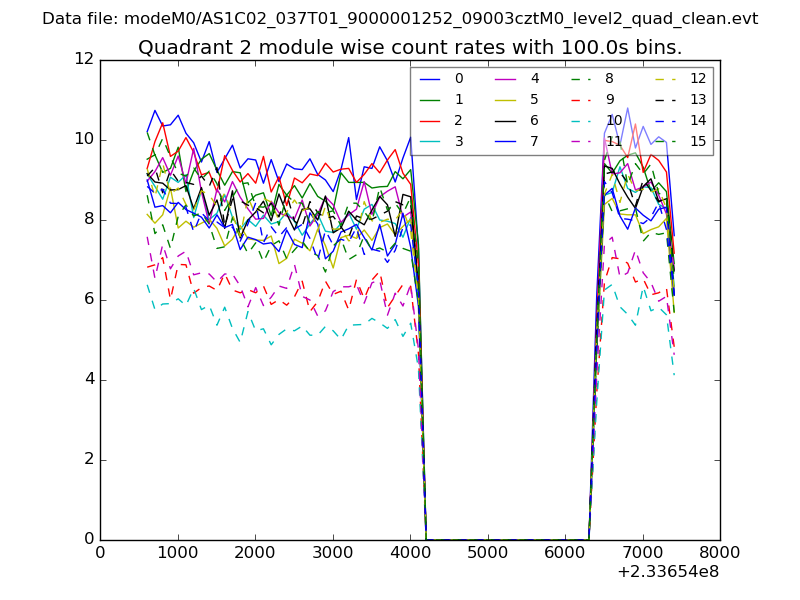
| Module-wise count rates for Quadrant B Data is divided into 100 sec bins |
 |
 |
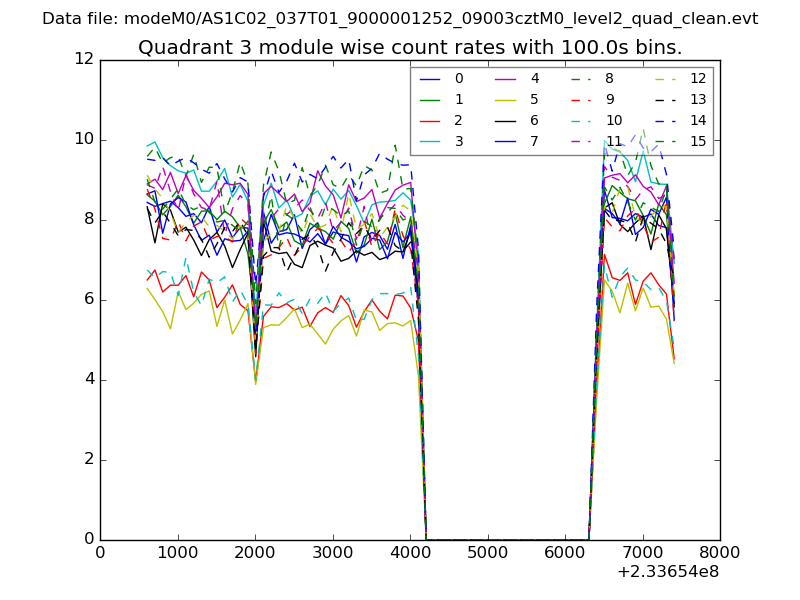
| Module-wise count rates for Quadrant C Data is divided into 100 sec bins |
 |
 |
| Module-wise count rates for Quadrant D Data is divided into 100 sec bins |
 |
 |
| Parameter | Plot |
|---|---|
| CZT HV Monitor | 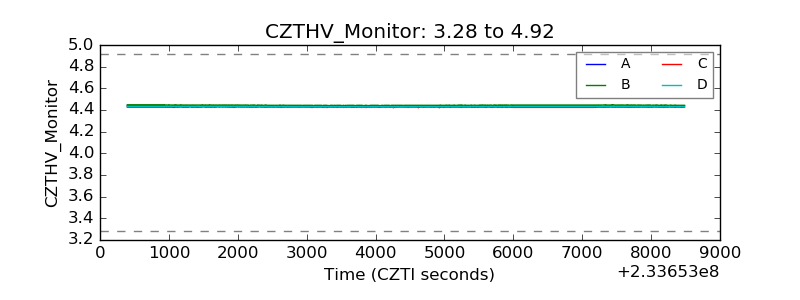 |
| D_VDD | 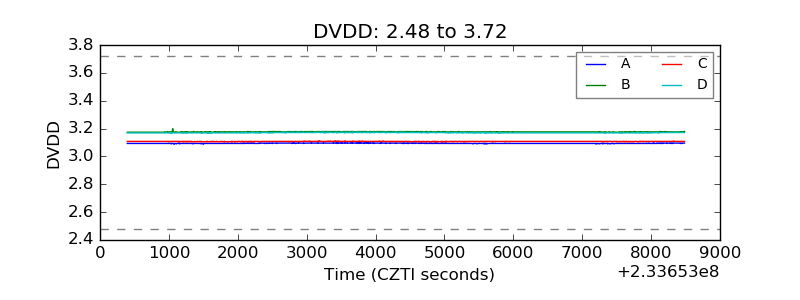 |
| Temperature 1 | 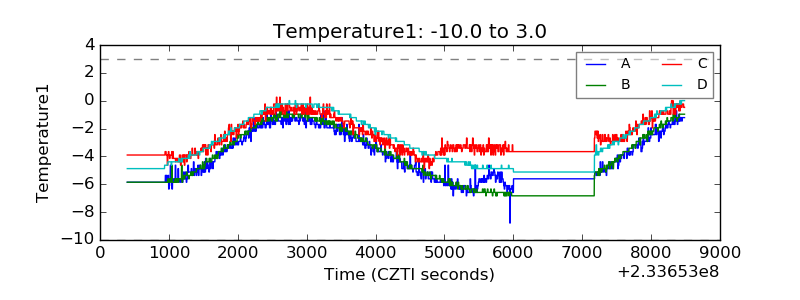 |
| Veto HV Monitor | 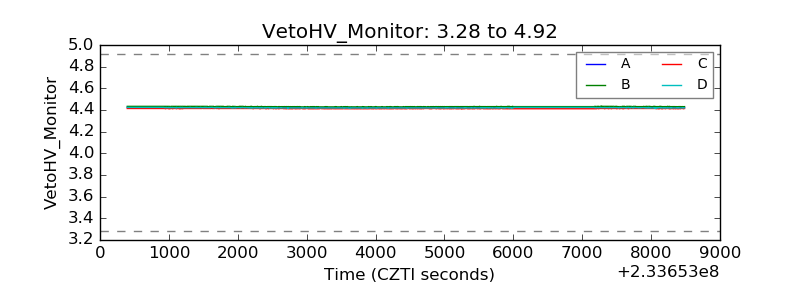 |
| Veto LLD | 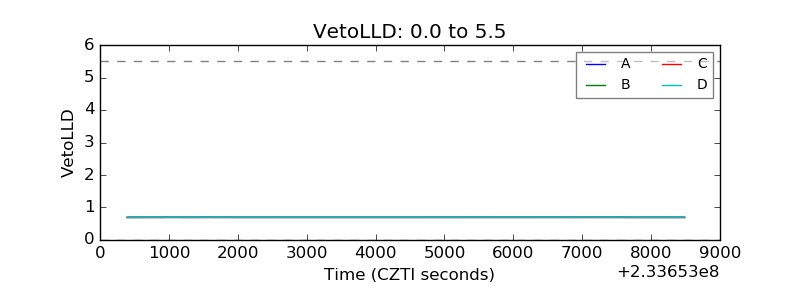 |
| Alpha Counter | 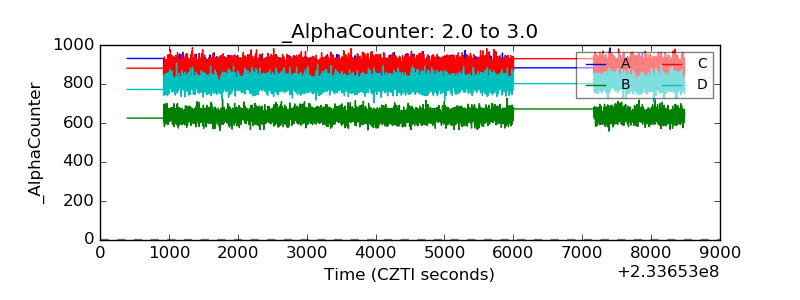 |
| _CPM_Rate | 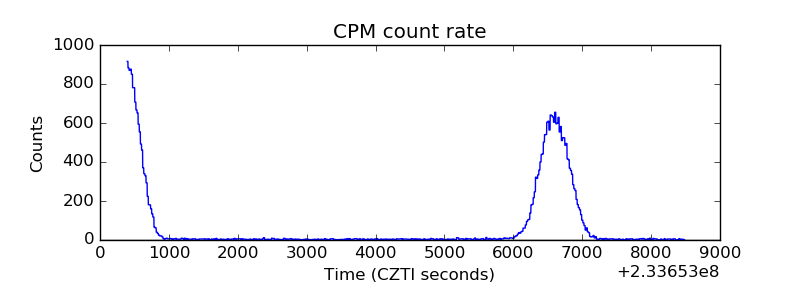 |
| CZT Counter | 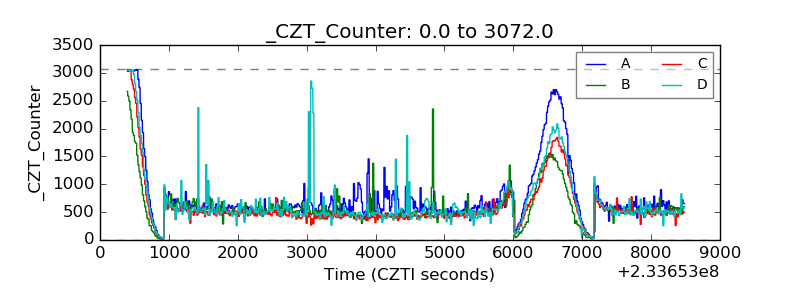 |
| +2.5 Volts monitor |  |
| +5 Volts monitor |  |
| _ROLL_ROT | 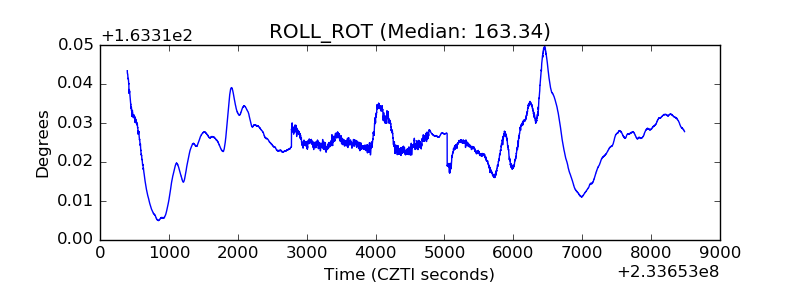 |
| _Roll_DEC | 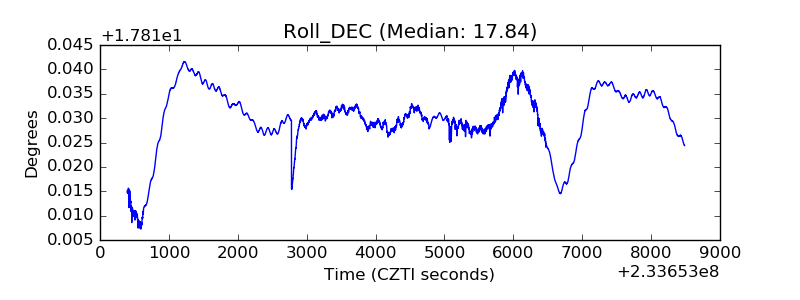 |
| _Roll_RA | 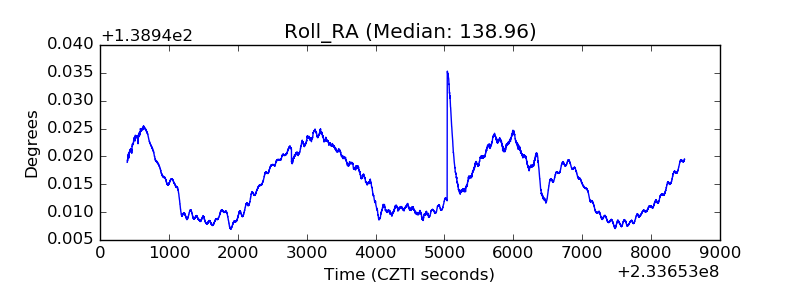 |
| Veto Counter | 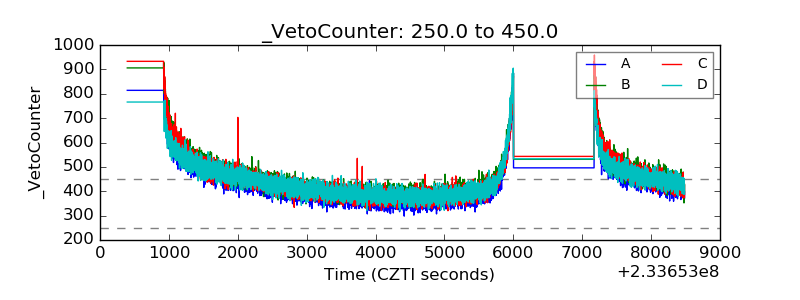 |