| Param | Original file | Final file |
|---|---|---|
| Filename | modeM0/AS1C02_037T01_9000001252_09004cztM0_level2.evt | modeM0/AS1C02_037T01_9000001252_09004cztM0_level2_quad_clean.evt |
| Size (bytes) | 505,350,720 | 102,741,120 |
| Size | 481.9 MB | 98.0 MB |
| Events in quadrant A | 4,009,347 | 666,924 |
| Events in quadrant B | 3,819,122 | 670,758 |
| Events in quadrant C | 3,195,518 | 659,702 |
| Events in quadrant D | 3,817,503 | 638,821 |
| Mode SS | |||
|---|---|---|---|
| Quadrant | BADHDUFLAG | Total packets | Discarded packets |
| A | 0 | 136 | 0 |
| B | 0 | 136 | 0 |
| C | 0 | 136 | 0 |
| D | 0 | 136 | 0 |
| Mode M0 | |||
|---|---|---|---|
| Quadrant | BADHDUFLAG | Total packets | Discarded packets |
| A | 0 | 16209 | 2 |
| B | 0 | 15558 | 1 |
| C | 0 | 14078 | 1 |
| D | 0 | 15714 | 1 |
| Mode M9 | |||
|---|---|---|---|
| Quadrant | BADHDUFLAG | Total packets | Discarded packets |
| A | 0 | 11 | 0 |
| B | 0 | 11 | 0 |
| C | 0 | 11 | 0 |
| D | 0 | 11 | 0 |
| Quadrant | Total seconds | Saturated seconds | Saturation percentage |
|---|---|---|---|
| A | 6830 | 147 | 2.152269% |
| B | 6830 | 145 | 2.122987% |
| C | 6830 | 97 | 1.420205% |
| D | 6830 | 154 | 2.254758% |
Noise dominated data is calculated using 1-second bins in cleaned event files. If a bin has >2000 counts, and if more than 50% of those come from <1% of pixels, then it is considered to be noise-dominated and hence unusable.
| Quadrant | # 1 sec bins | Bins with >0 counts | Bins with >2000 counts | High rate bins dominated by noise | Noise dominated (total time) | Noise dominated (detector-on time) | Marked lightcurve |
|---|---|---|---|---|---|---|---|
| A | 7860 | 6831 | 5 | 5 | 0.06% | 0.07% | 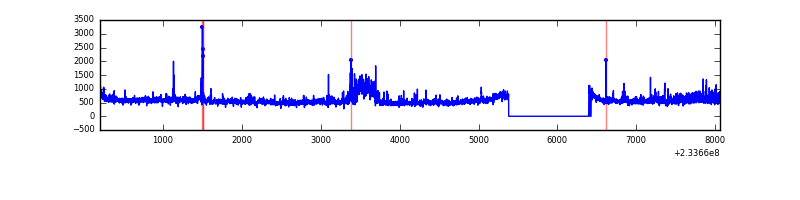 |
| B | 7860 | 6831 | 14 | 14 | 0.18% | 0.20% | 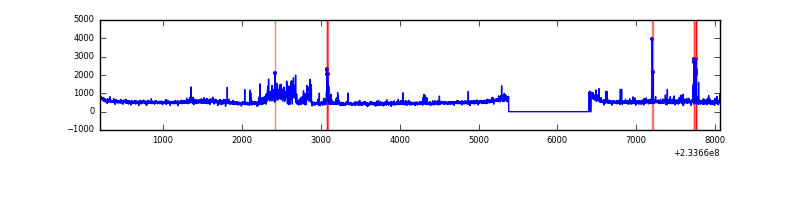 |
| C | 7860 | 6831 | 0 | 0 | 0.00% | 0.00% | 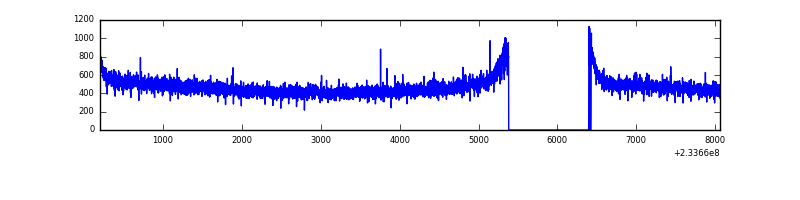 |
| D | 7860 | 6831 | 35 | 35 | 0.45% | 0.51% | 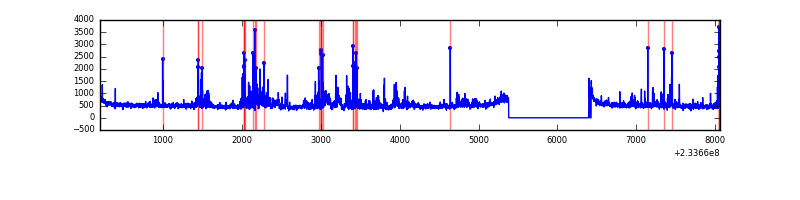 |
Top three noisy pixels from each quadrant. If the there are fewer than three noisy pixels in the level2.evt file, extra rows are filled as -1
| Pixel properties | Quadrant properties | ||||||
|---|---|---|---|---|---|---|---|
| Quadrant | DetID | PixID | Counts | Sigma | Mean | Median | Sigma |
| A | 8 | 5 | 651980 | 3766.54 | 849 | 831 | 172.9 |
| A | 1 | 162 | 27079 | 151.83 | 849 | 831 | 172.9 |
| A | 5 | 16 | 23879 | 133.32 | 849 | 831 | 172.9 |
| B | 0 | 230 | 276943 | 1709.08 | 845 | 827 | 161.6 |
| B | 0 | 214 | 92969 | 570.33 | 845 | 827 | 161.6 |
| B | 10 | 16 | 80865 | 495.41 | 845 | 827 | 161.6 |
| C | 13 | 61 | 6358 | 29.05 | 818 | 822 | 190.6 |
| C | 14 | 238 | 3720 | 15.21 | 818 | 822 | 190.6 |
| C | 3 | 202 | 2047 | 6.43 | 818 | 822 | 190.6 |
| D | 7 | 71 | 271847 | 1317.92 | 829 | 803 | 205.7 |
| D | 6 | 225 | 240684 | 1166.39 | 829 | 803 | 205.7 |
| D | 1 | 52 | 51712 | 247.54 | 829 | 803 | 205.7 |
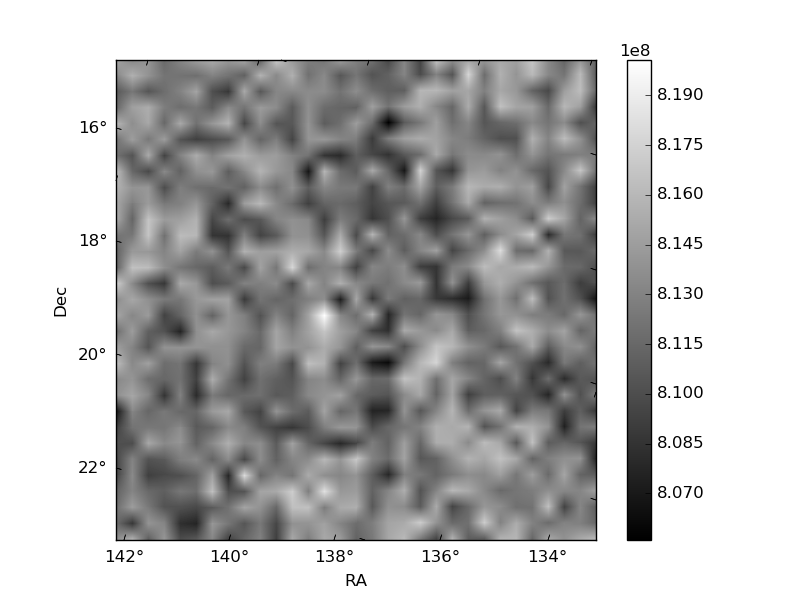
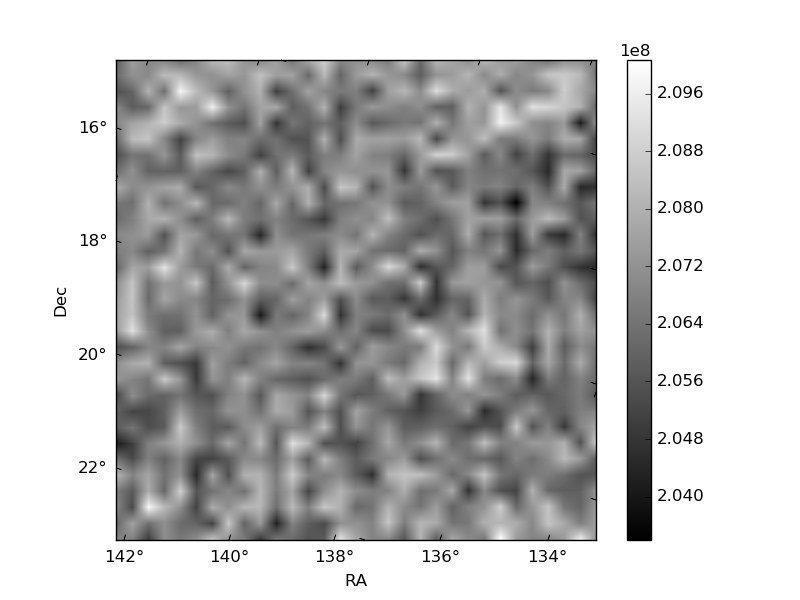
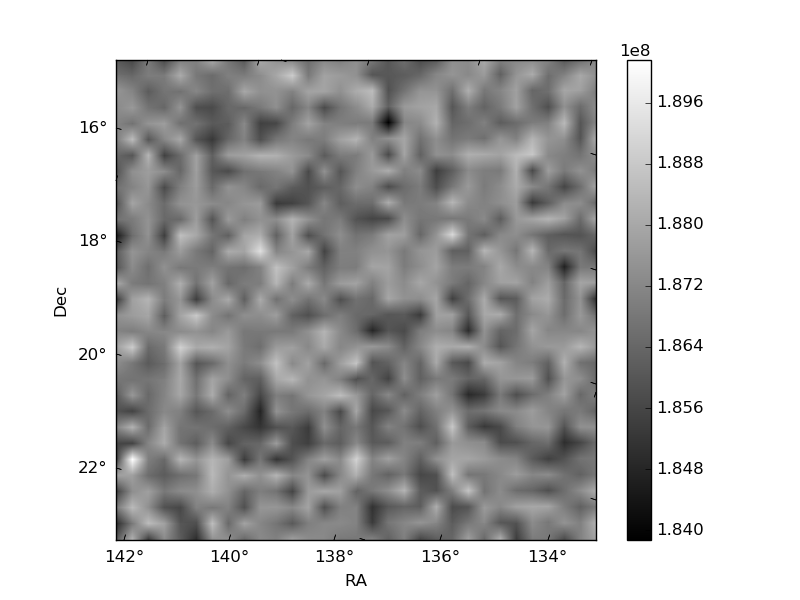
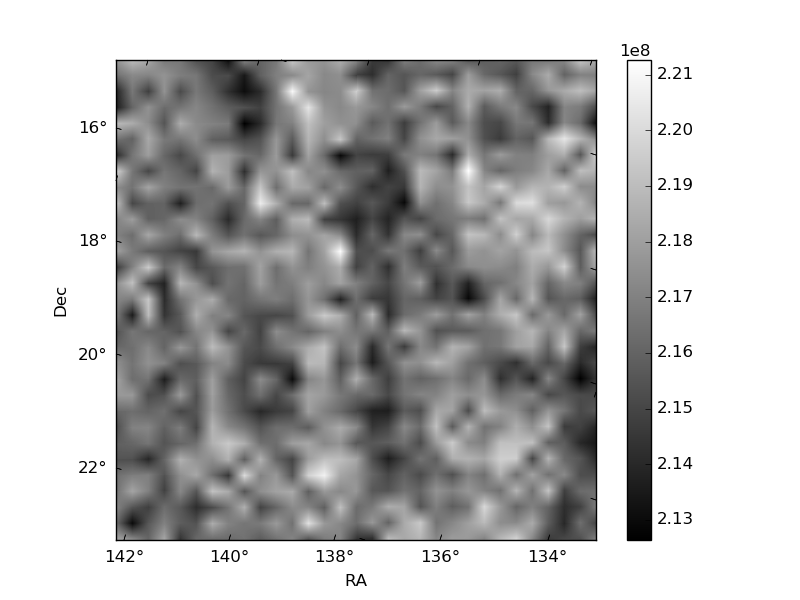
Histogram calculated using DETX and DETY for each event in the final _common_clean file
| Quadrant A | 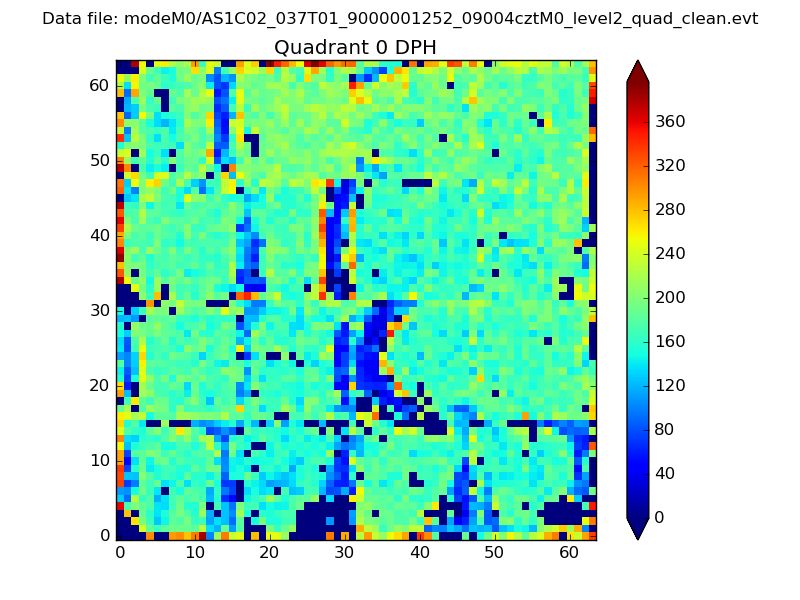 |
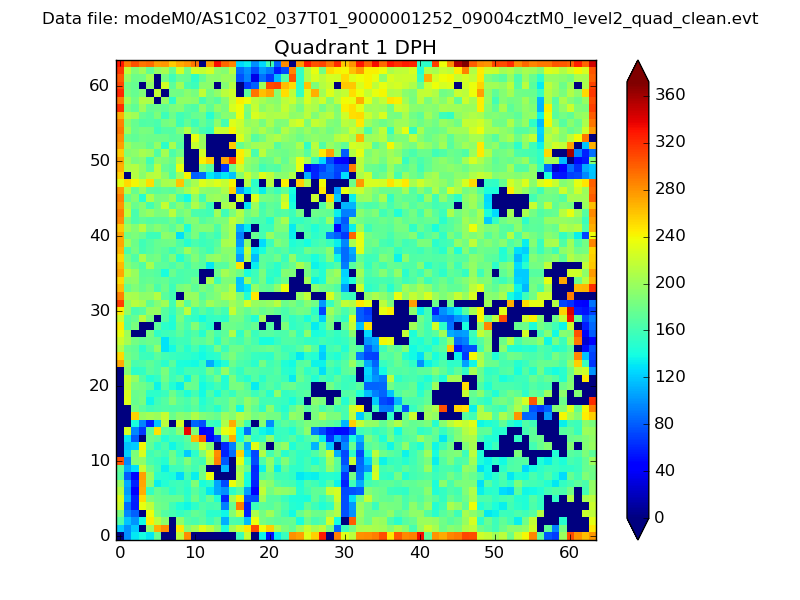 |
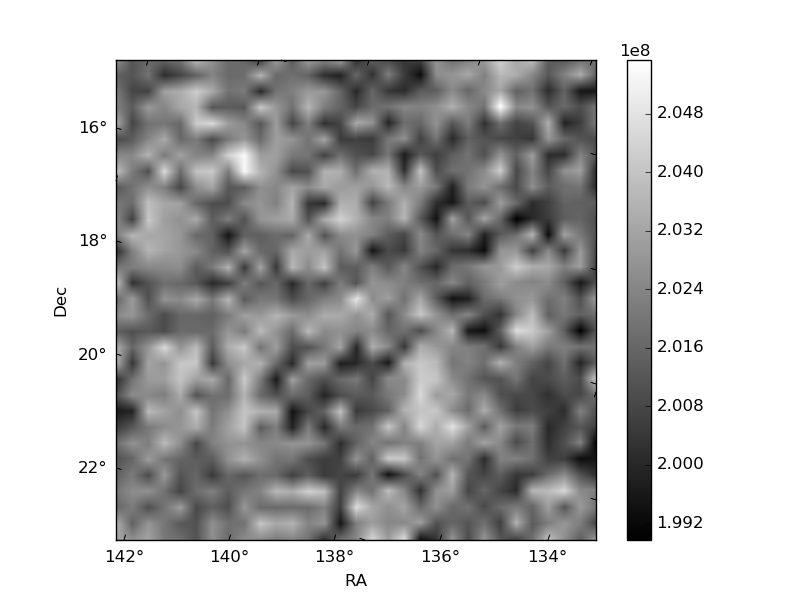
Quadrant B |
|---|---|---|---|
| Quadrant D | 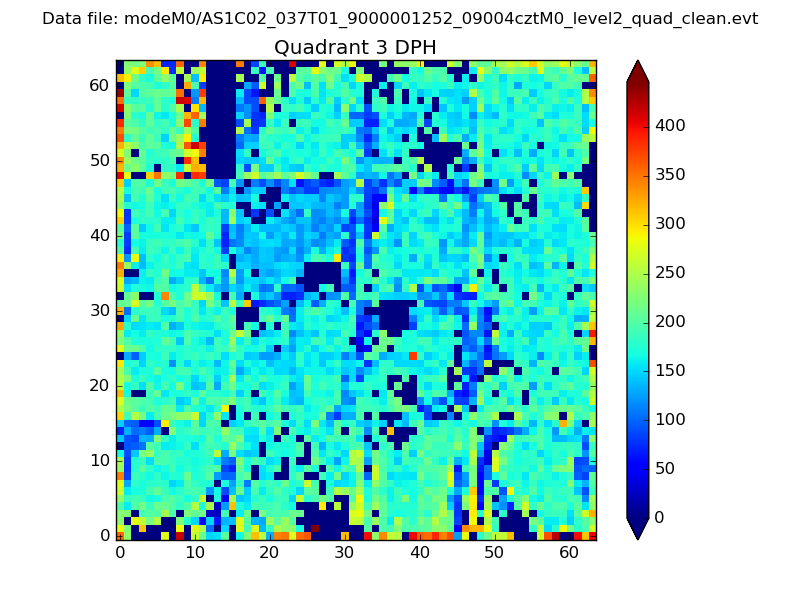 |
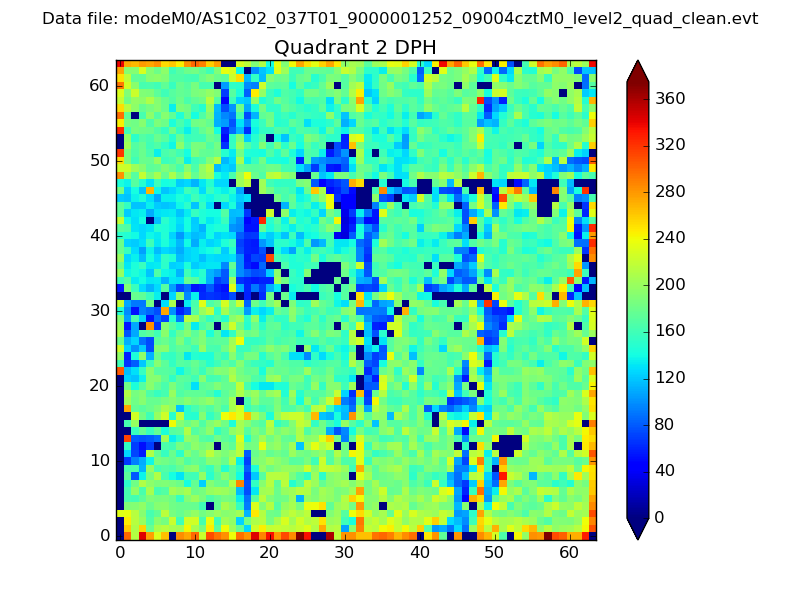 |
Quadrant C |
| Plot type | Count rate plots | Images |
|---|---|---|
| Comparison with Poisson distribution Blue bars denote a histogram of data divided into 1 sec bins. Red curve is a Poisson curve with rate = median count rate of data. |
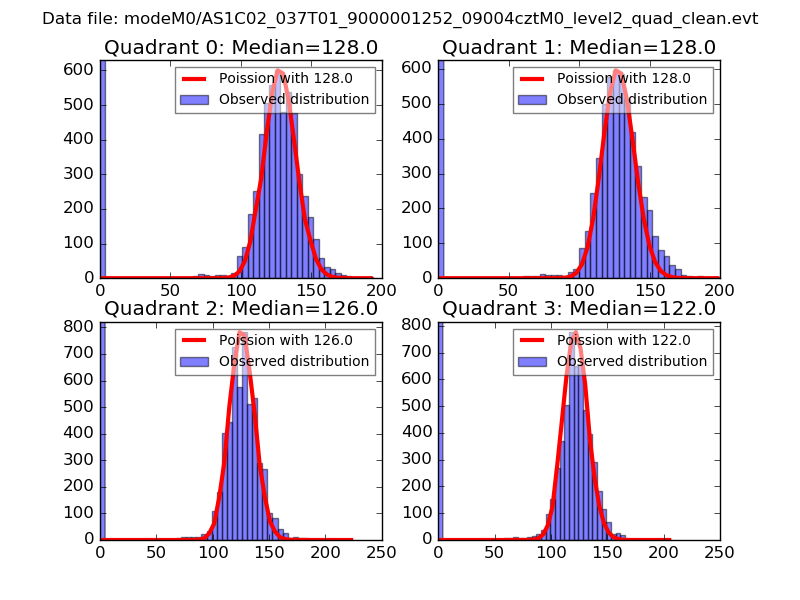 |
 |
| Quadrant-wise count rates Data is divided into 100 sec bins |
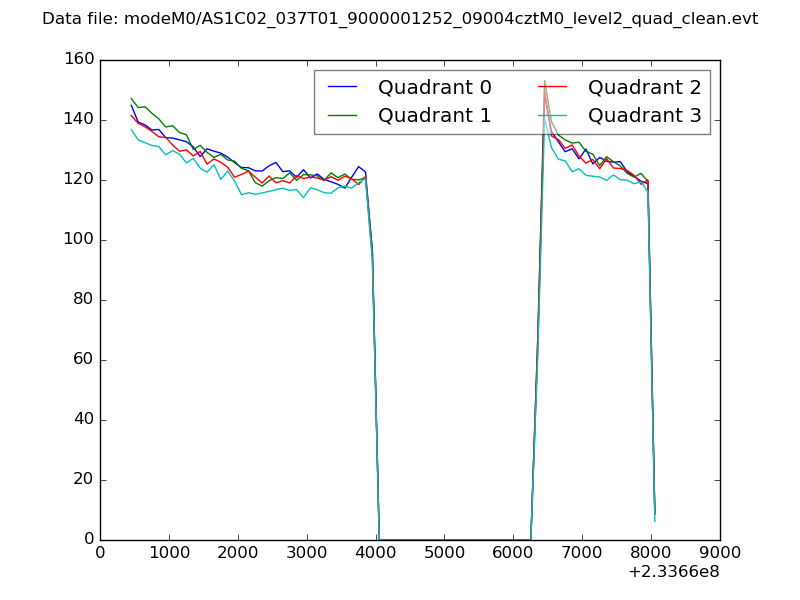 |
|
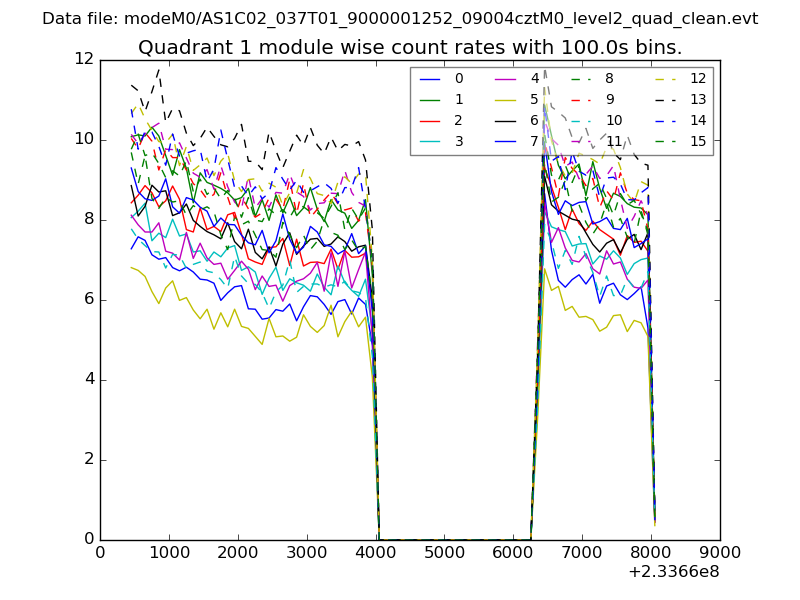
| Module-wise count rates for Quadrant A Data is divided into 100 sec bins |
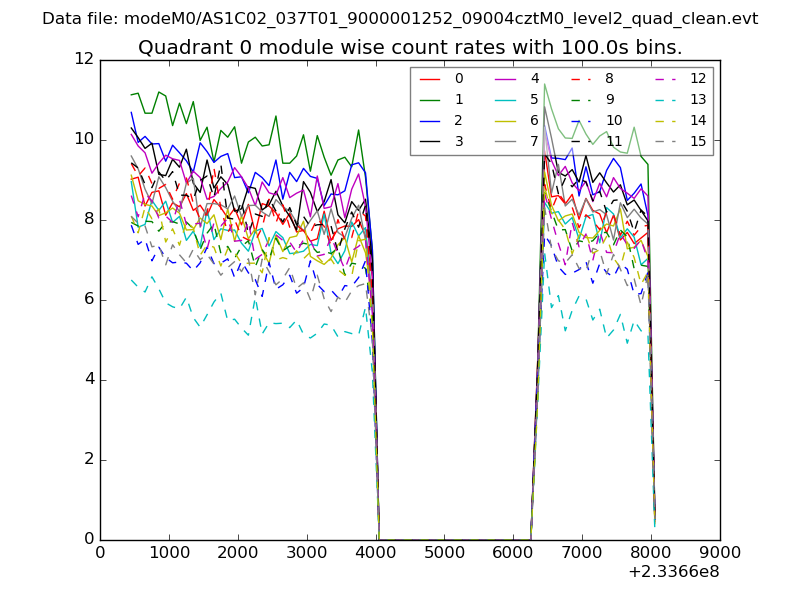 |
 |
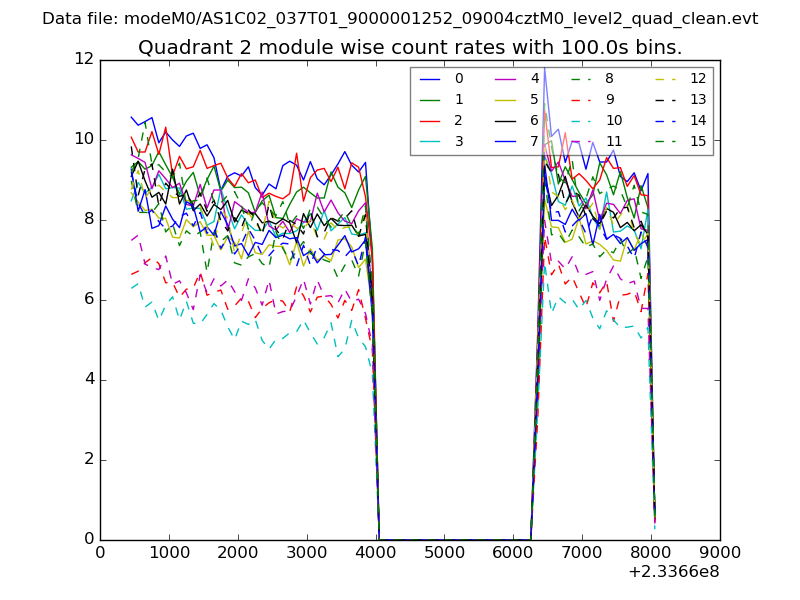
| Module-wise count rates for Quadrant B Data is divided into 100 sec bins |
 |
 |
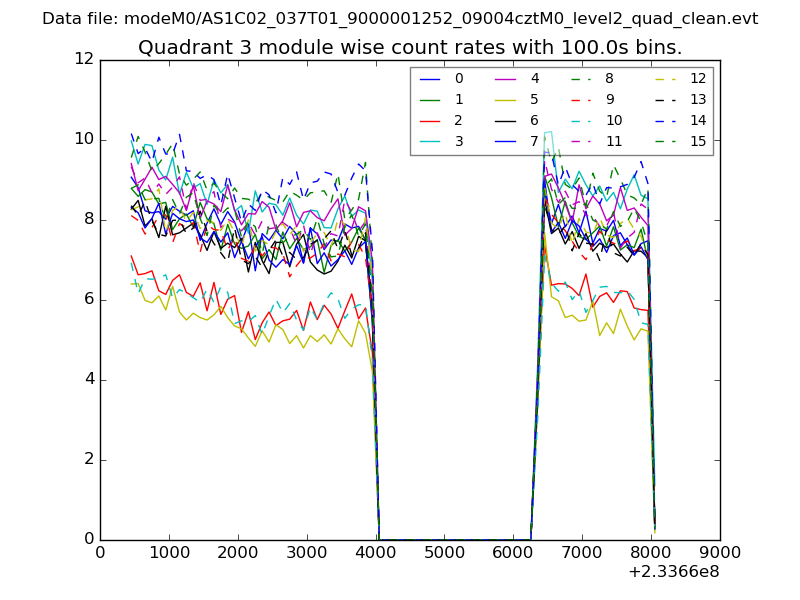
| Module-wise count rates for Quadrant C Data is divided into 100 sec bins |
 |
 |
| Module-wise count rates for Quadrant D Data is divided into 100 sec bins |
 |
 |
| Parameter | Plot |
|---|---|
| CZT HV Monitor | 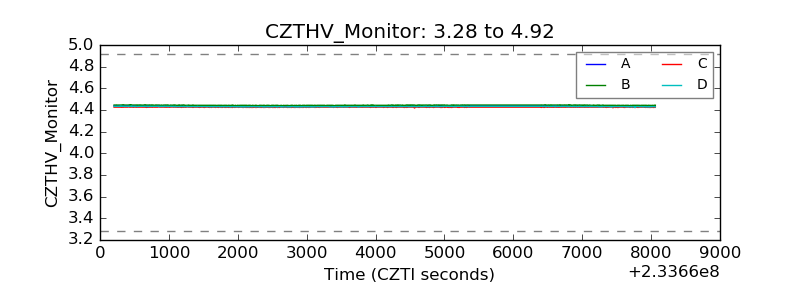 |
| D_VDD | 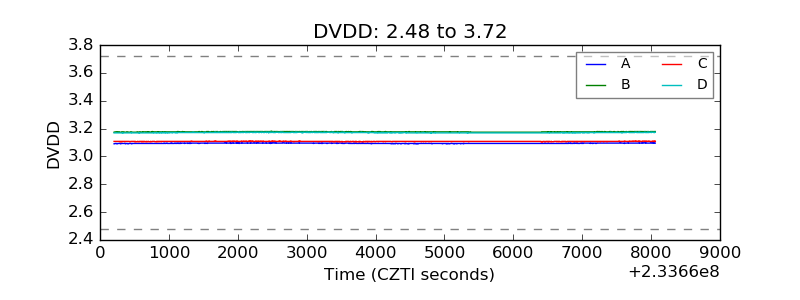 |
| Temperature 1 | 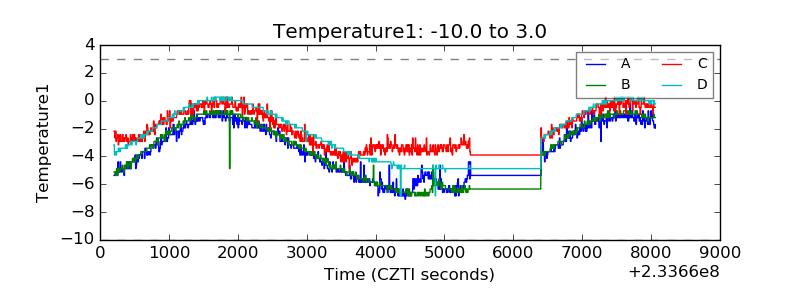 |
| Veto HV Monitor | 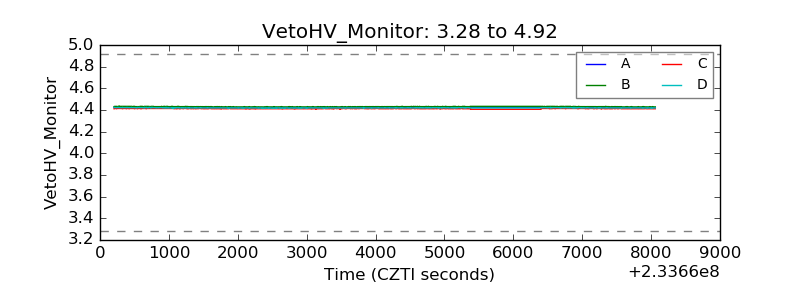 |
| Veto LLD | 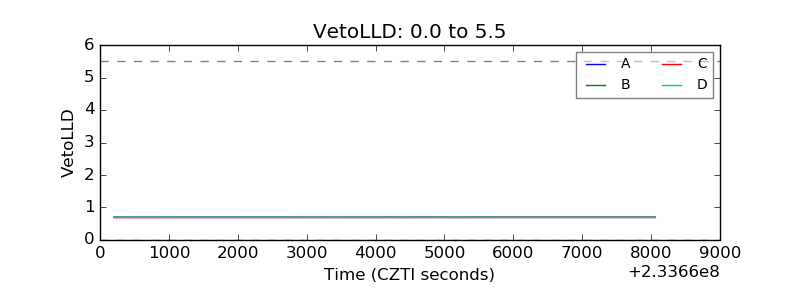 |
| Alpha Counter | 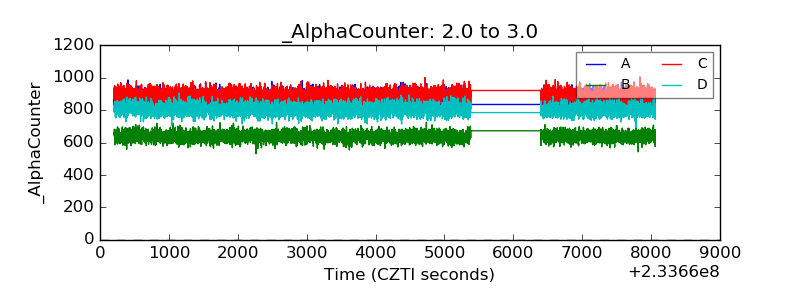 |
| _CPM_Rate | 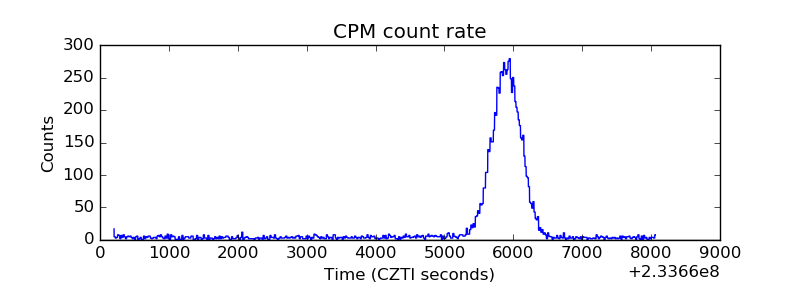 |
| CZT Counter | 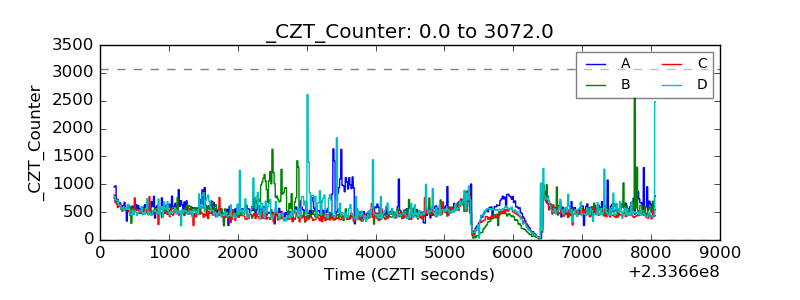 |
| +2.5 Volts monitor |  |
| +5 Volts monitor |  |
| _ROLL_ROT | 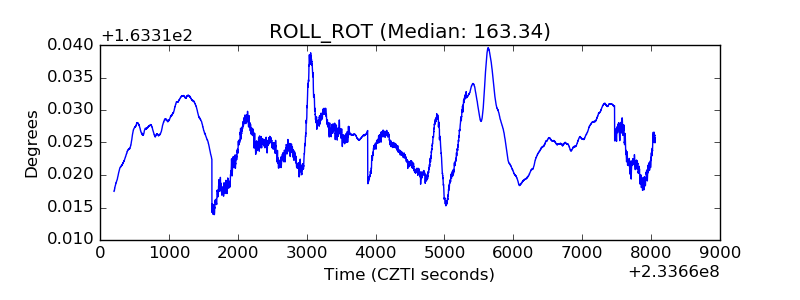 |
| _Roll_DEC | 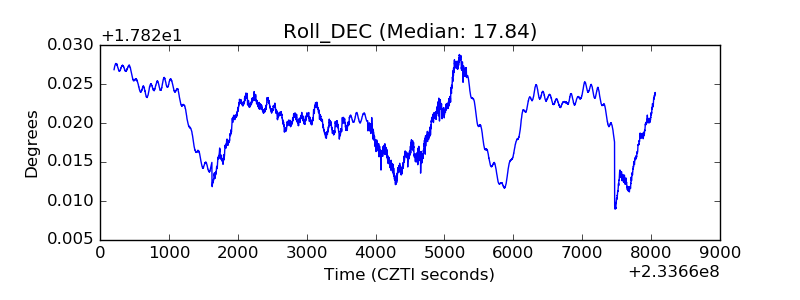 |
| _Roll_RA | 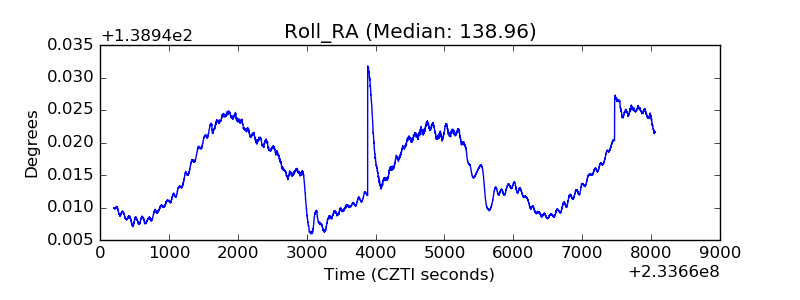 |
| Veto Counter | 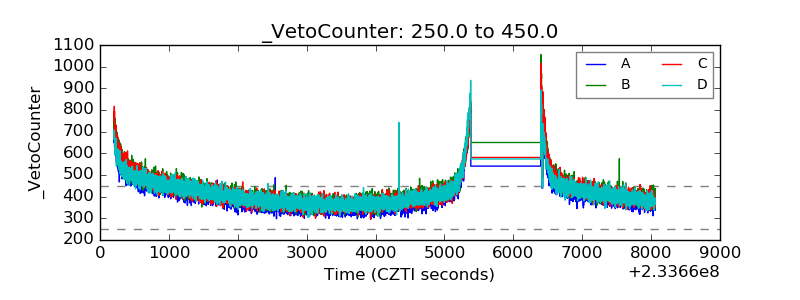 |