| Param | Original file | Final file |
|---|---|---|
| Filename | modeM0/AS1C02_037T01_9000001252_09006cztM0_level2.evt | modeM0/AS1C02_037T01_9000001252_09006cztM0_level2_quad_clean.evt |
| Size (bytes) | 1,005,635,520 | 160,513,920 |
| Size | 959.0 MB | 153.1 MB |
| Events in quadrant A | 7,421,297 | 1,014,164 |
| Events in quadrant B | 6,946,679 | 1,008,871 |
| Events in quadrant C | 5,694,567 | 1,004,000 |
| Events in quadrant D | 9,543,337 | 965,216 |
| Mode SS | |||
|---|---|---|---|
| Quadrant | BADHDUFLAG | Total packets | Discarded packets |
| A | 0 | 256 | 0 |
| B | 0 | 256 | 0 |
| C | 0 | 256 | 0 |
| D | 0 | 256 | 0 |
| Mode M0 | |||
|---|---|---|---|
| Quadrant | BADHDUFLAG | Total packets | Discarded packets |
| A | 0 | 30116 | 3 |
| B | 0 | 28769 | 2 |
| C | 0 | 25897 | 2 |
| D | 0 | 36674 | 4 |
| Mode M9 | |||
|---|---|---|---|
| Quadrant | BADHDUFLAG | Total packets | Discarded packets |
| A | 0 | 11 | 0 |
| B | 0 | 11 | 0 |
| C | 0 | 11 | 0 |
| D | 0 | 11 | 0 |
| Quadrant | Total seconds | Saturated seconds | Saturation percentage |
|---|---|---|---|
| A | 12569 | 241 | 1.917416% |
| B | 12569 | 386 | 3.071048% |
| C | 12569 | 84 | 0.668311% |
| D | 12568 | 1148 | 9.134309% |
Noise dominated data is calculated using 1-second bins in cleaned event files. If a bin has >2000 counts, and if more than 50% of those come from <1% of pixels, then it is considered to be noise-dominated and hence unusable.
| Quadrant | # 1 sec bins | Bins with >0 counts | Bins with >2000 counts | High rate bins dominated by noise | Noise dominated (total time) | Noise dominated (detector-on time) | Marked lightcurve |
|---|---|---|---|---|---|---|---|
| A | 13754 | 12571 | 16 | 16 | 0.12% | 0.13% | 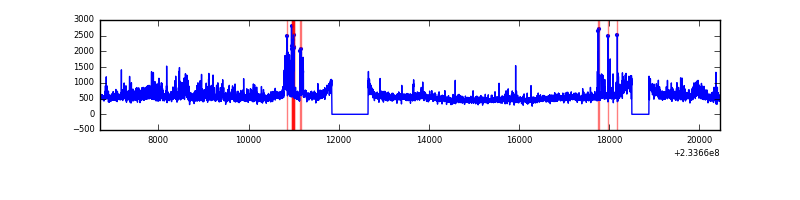 |
| B | 13754 | 12571 | 132 | 132 | 0.96% | 1.05% | 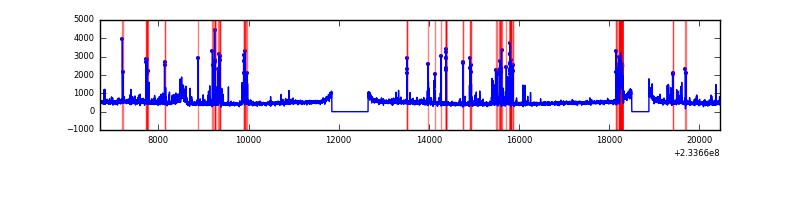 |
| C | 13754 | 12571 | 0 | 0 | 0.00% | 0.00% | 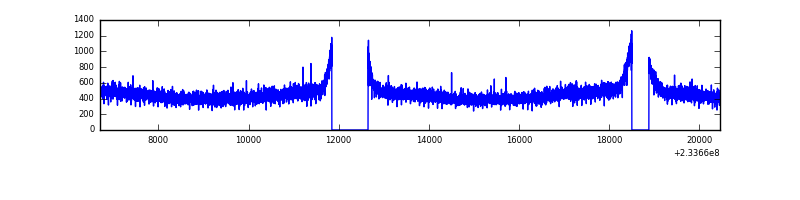 |
| D | 13754 | 12571 | 956 | 956 | 6.95% | 7.60% | 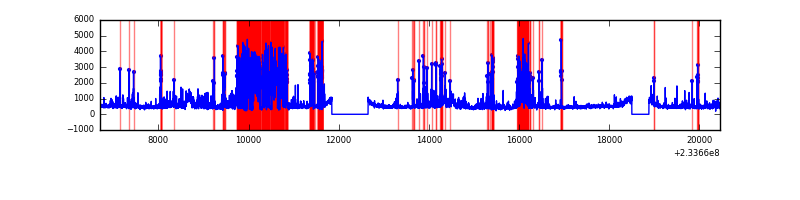 |
Top three noisy pixels from each quadrant. If the there are fewer than three noisy pixels in the level2.evt file, extra rows are filled as -1
| Pixel properties | Quadrant properties | ||||||
|---|---|---|---|---|---|---|---|
| Quadrant | DetID | PixID | Counts | Sigma | Mean | Median | Sigma |
| A | 8 | 5 | 1308751 | 4237.63 | 1506 | 1475 | 308.5 |
| A | 1 | 162 | 141883 | 455.14 | 1506 | 1475 | 308.5 |
| A | 5 | 16 | 62407 | 197.52 | 1506 | 1475 | 308.5 |
| B | 10 | 16 | 660233 | 2278.94 | 1502 | 1467 | 289.1 |
| B | 0 | 230 | 171612 | 588.6 | 1502 | 1467 | 289.1 |
| B | 0 | 214 | 167568 | 574.61 | 1502 | 1467 | 289.1 |
| C | 13 | 61 | 11121 | 28.18 | 1459 | 1465 | 342.6 |
| C | 14 | 238 | 4759 | 9.61 | 1459 | 1465 | 342.6 |
| C | 8 | 128 | 4339 | 8.39 | 1459 | 1465 | 342.6 |
| D | 1 | 52 | 2524285 | 7098.82 | 1418 | 1372 | 355.4 |
| D | 7 | 71 | 492273 | 1381.27 | 1418 | 1372 | 355.4 |
| D | 6 | 225 | 398610 | 1117.72 | 1418 | 1372 | 355.4 |
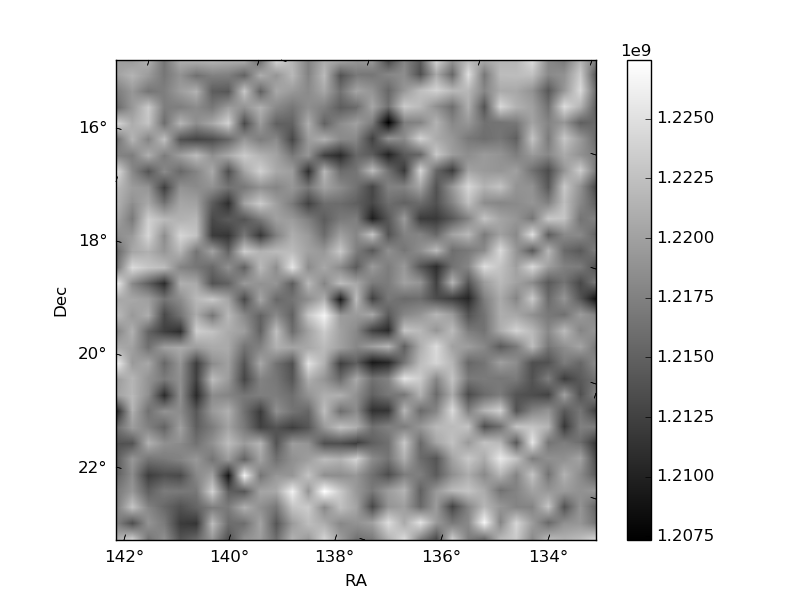
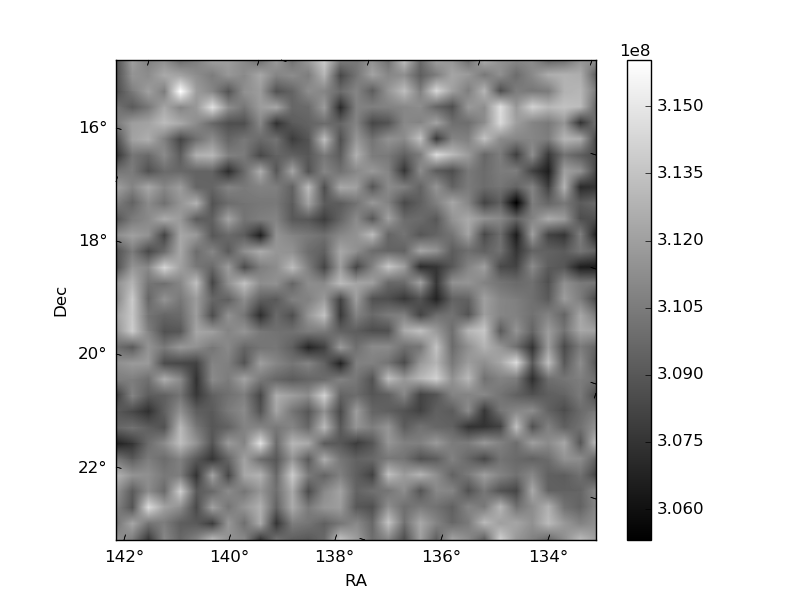
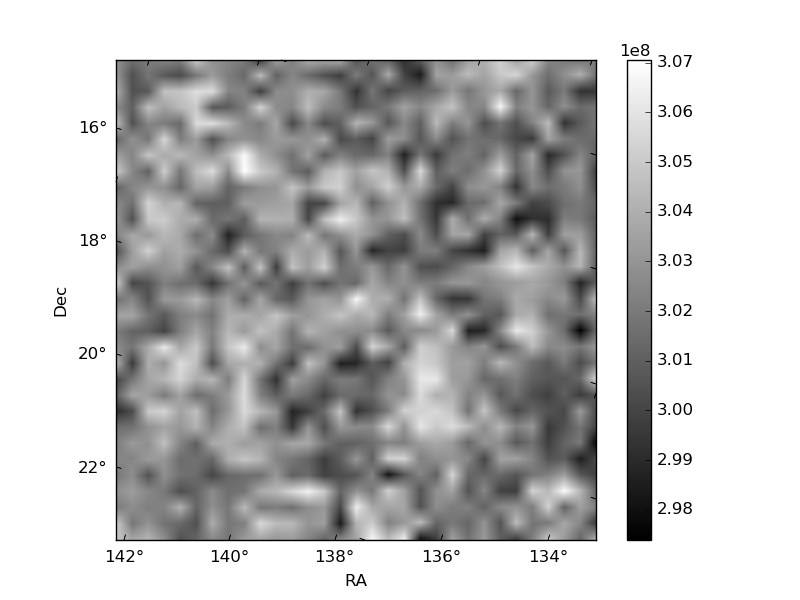
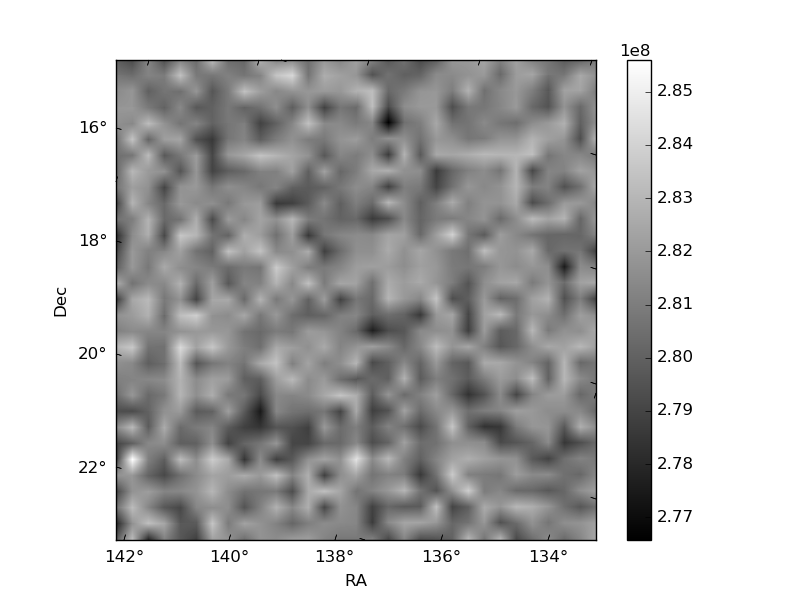
Histogram calculated using DETX and DETY for each event in the final _common_clean file
| Quadrant A | 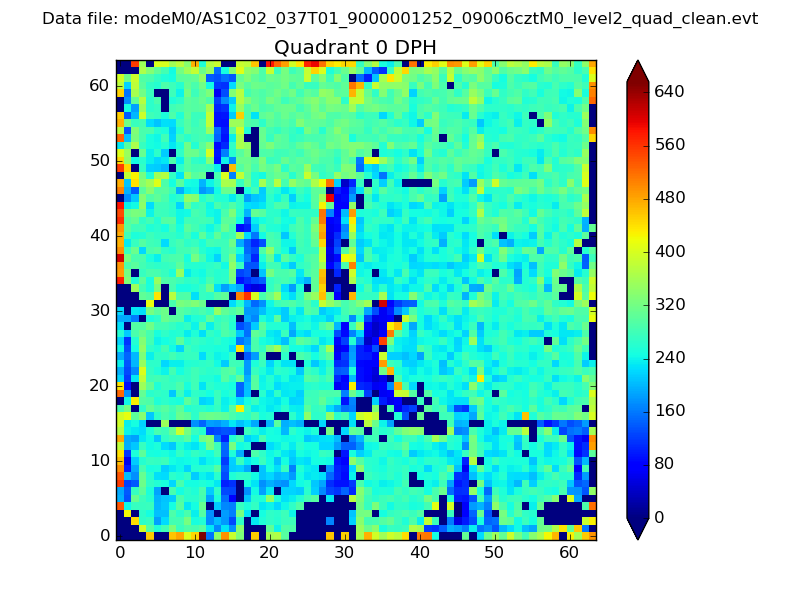 |
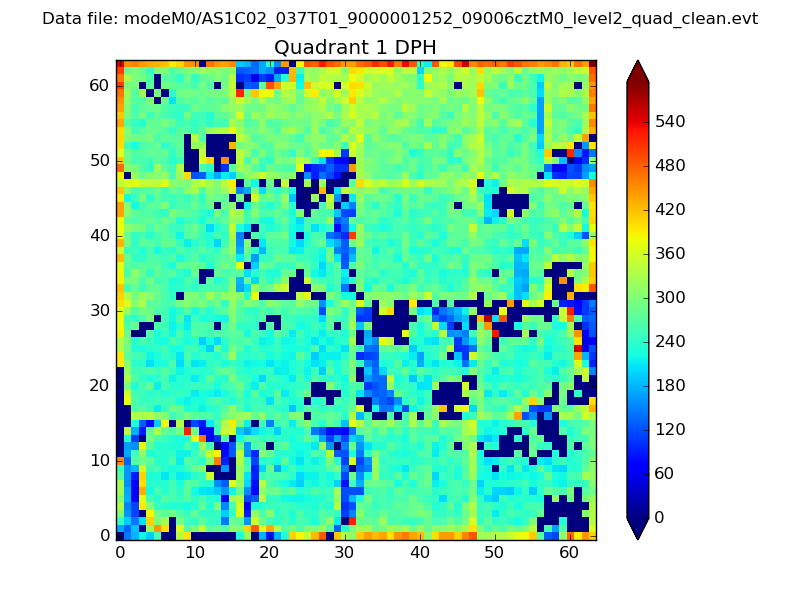 |
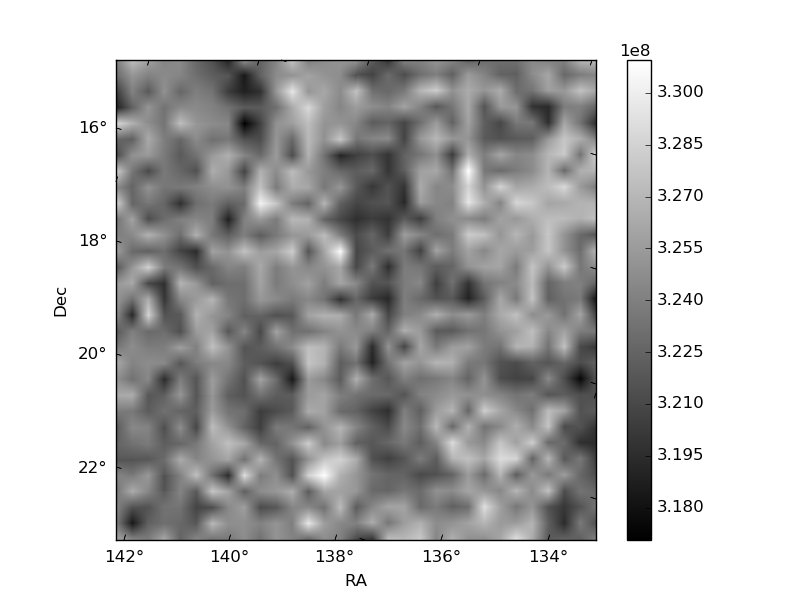
Quadrant B |
|---|---|---|---|
| Quadrant D | 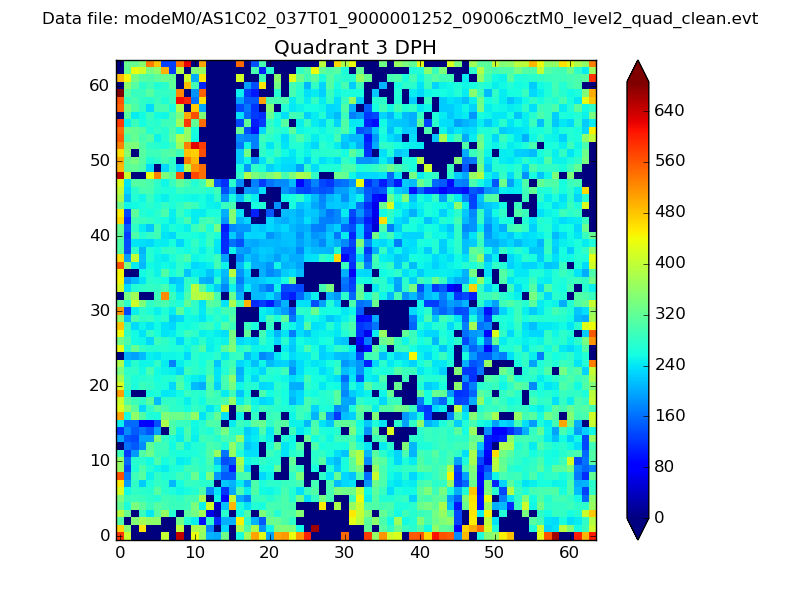 |
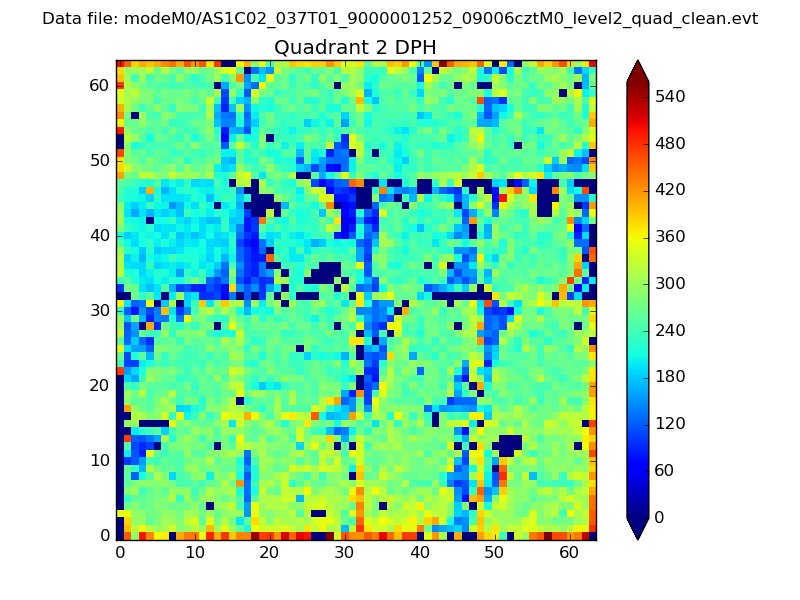 |
Quadrant C |
| Plot type | Count rate plots | Images |
|---|---|---|
| Comparison with Poisson distribution Blue bars denote a histogram of data divided into 1 sec bins. Red curve is a Poisson curve with rate = median count rate of data. |
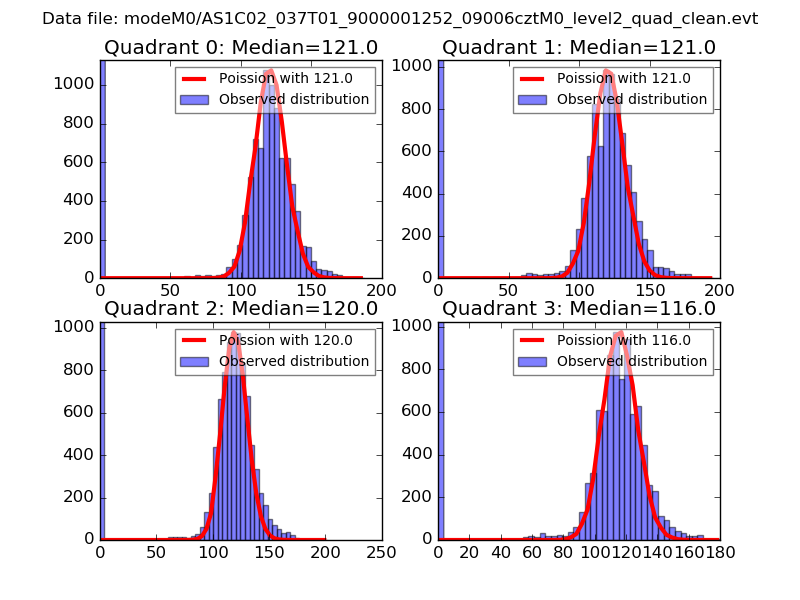 |
 |
| Quadrant-wise count rates Data is divided into 100 sec bins |
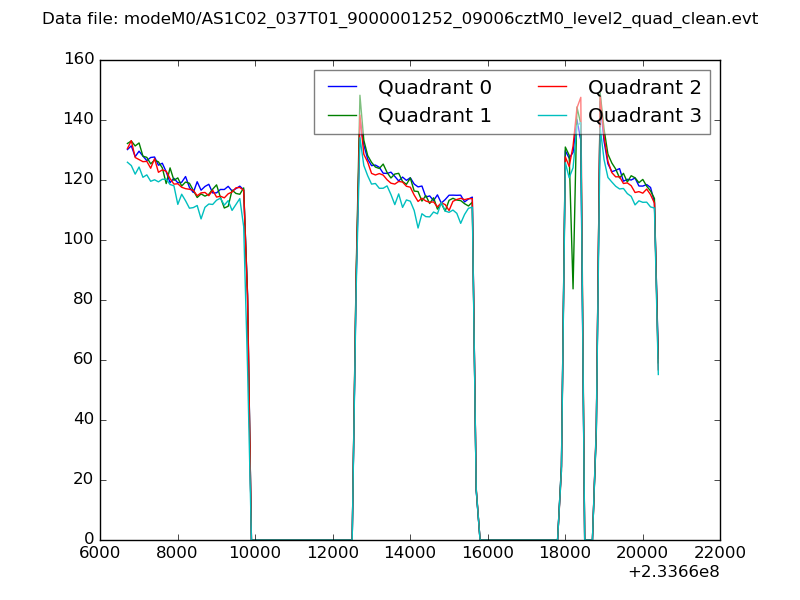 |
|
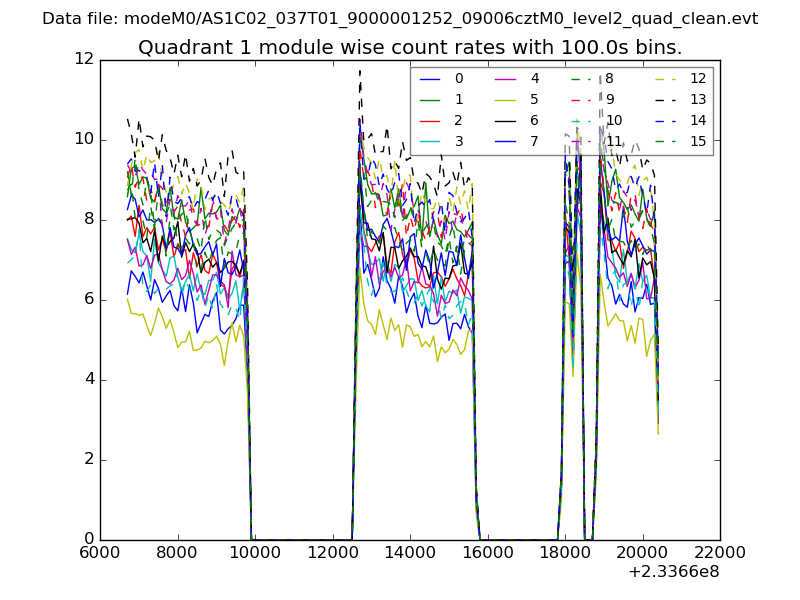
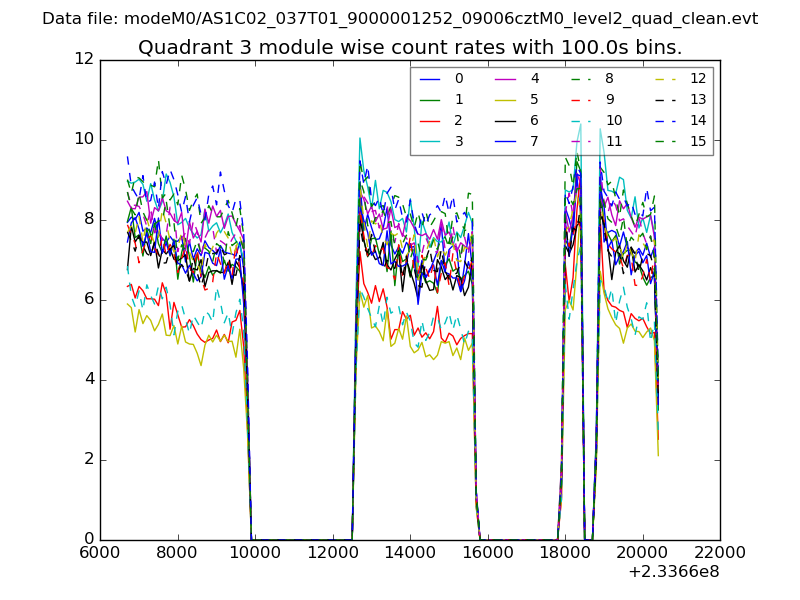
| Module-wise count rates for Quadrant A Data is divided into 100 sec bins |
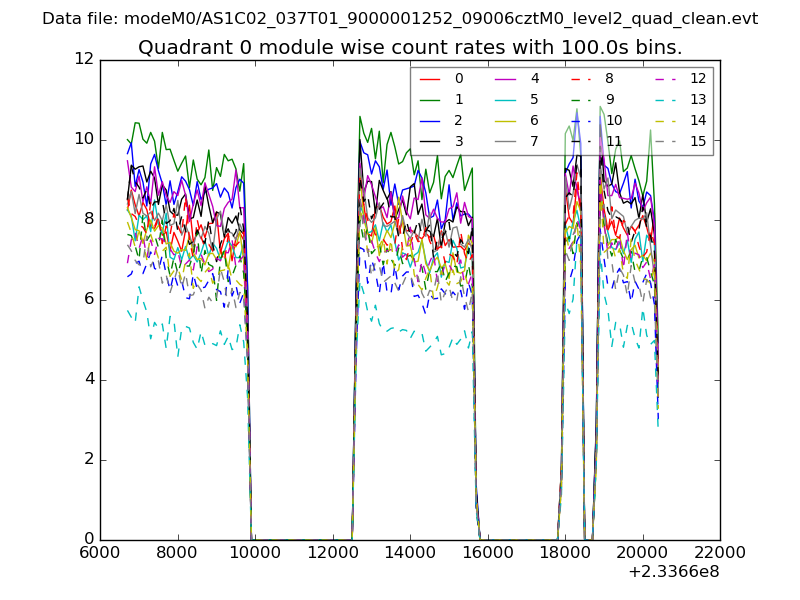 |
 |
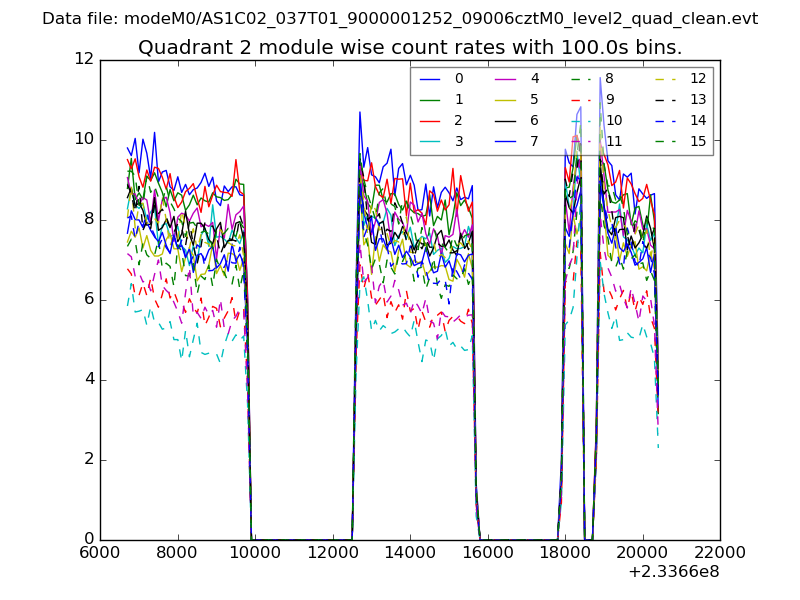
| Module-wise count rates for Quadrant B Data is divided into 100 sec bins |
 |
 |
| Module-wise count rates for Quadrant C Data is divided into 100 sec bins |
 |
 |
| Module-wise count rates for Quadrant D Data is divided into 100 sec bins |
 |
 |
| Parameter | Plot |
|---|---|
| CZT HV Monitor | 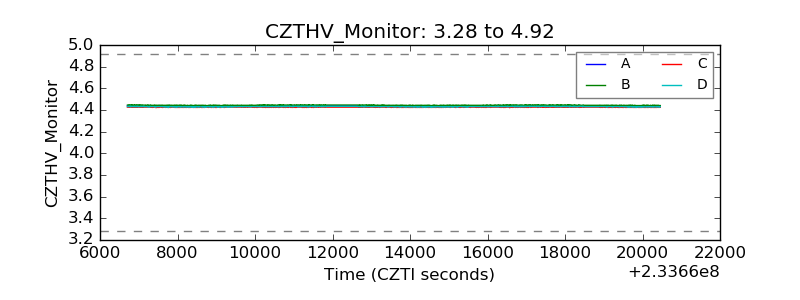 |
| D_VDD | 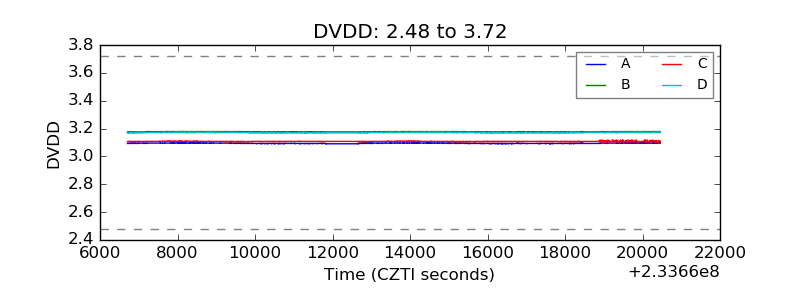 |
| Temperature 1 | 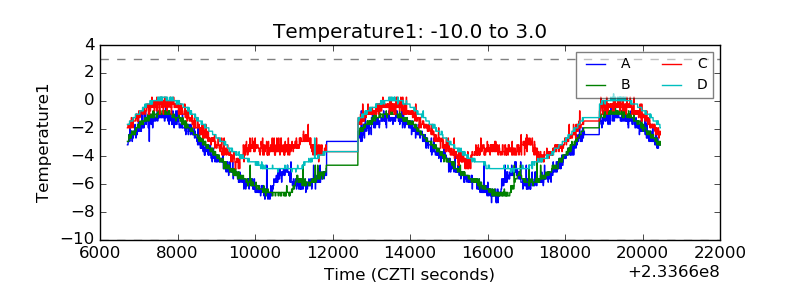 |
| Veto HV Monitor | 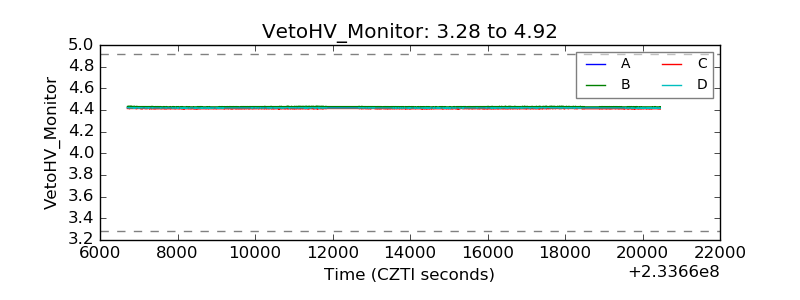 |
| Veto LLD | 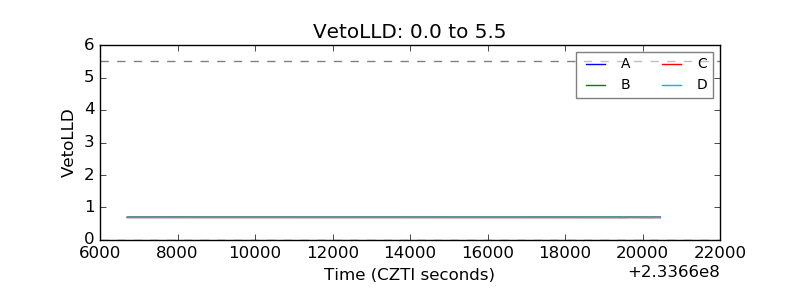 |
| Alpha Counter | 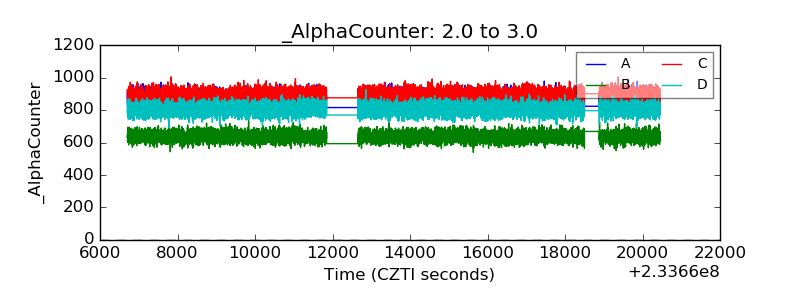 |
| _CPM_Rate | 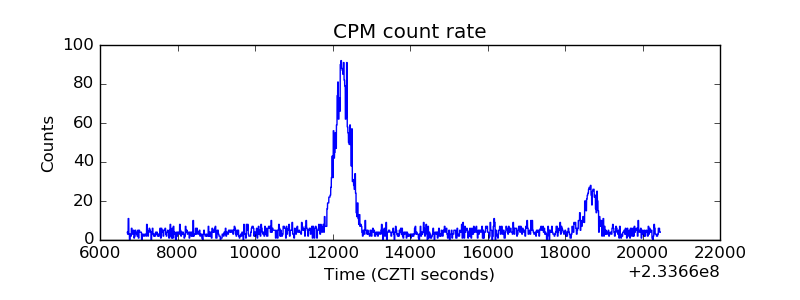 |
| CZT Counter | 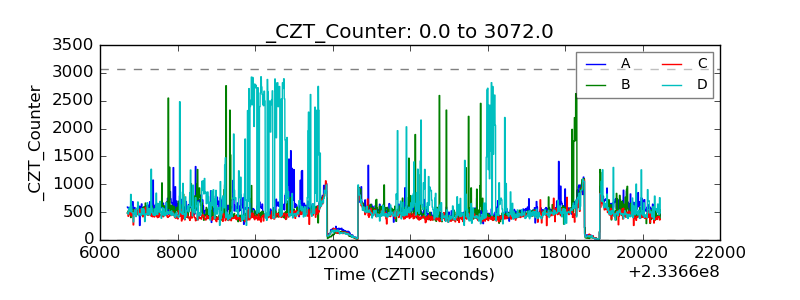 |
| +2.5 Volts monitor |  |
| +5 Volts monitor |  |
| _ROLL_ROT | 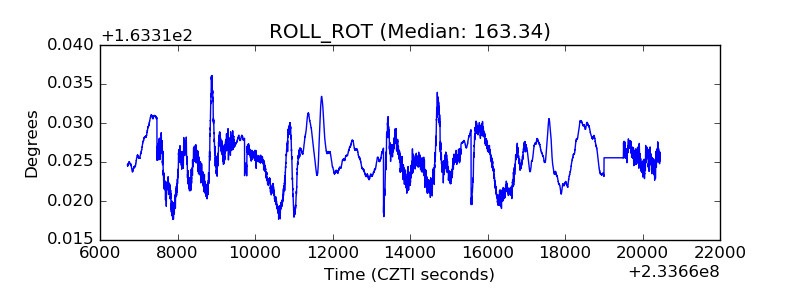 |
| _Roll_DEC | 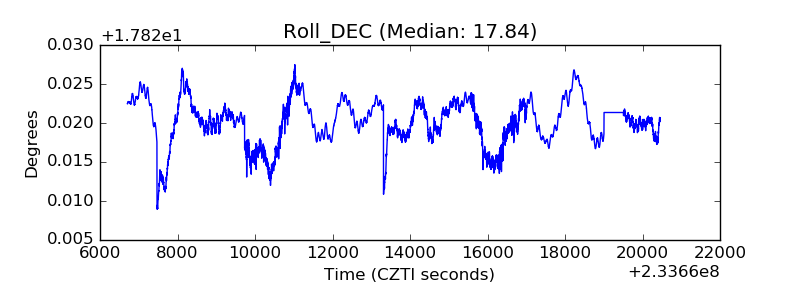 |
| _Roll_RA | 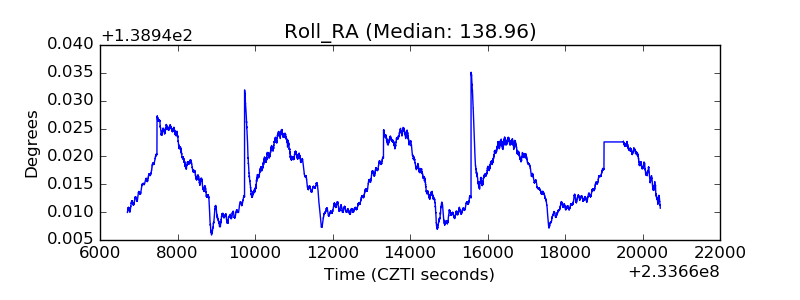 |
| Veto Counter | 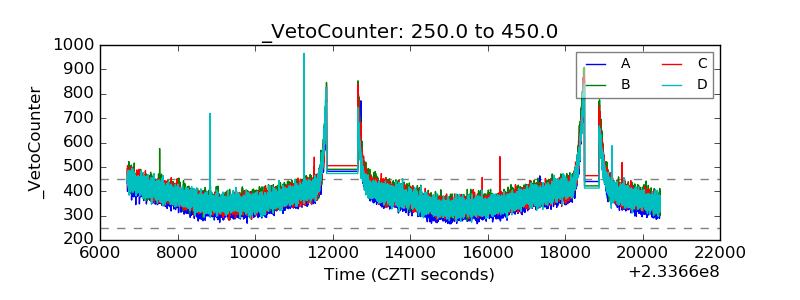 |