| Param | Original file | Final file |
|---|---|---|
| Filename | modeM0/AS1C02_037T01_9000001252_09007cztM0_level2.evt | modeM0/AS1C02_037T01_9000001252_09007cztM0_level2_quad_clean.evt |
| Size (bytes) | 523,535,040 | 99,089,280 |
| Size | 499.3 MB | 94.5 MB |
| Events in quadrant A | 4,063,313 | 626,541 |
| Events in quadrant B | 3,877,451 | 630,203 |
| Events in quadrant C | 3,367,141 | 621,767 |
| Events in quadrant D | 4,042,148 | 604,361 |
| Mode SS | |||
|---|---|---|---|
| Quadrant | BADHDUFLAG | Total packets | Discarded packets |
| A | 0 | 152 | 0 |
| B | 0 | 152 | 0 |
| C | 0 | 152 | 0 |
| D | 0 | 152 | 0 |
| Mode M0 | |||
|---|---|---|---|
| Quadrant | BADHDUFLAG | Total packets | Discarded packets |
| A | 0 | 16795 | 2 |
| B | 0 | 16507 | 1 |
| C | 0 | 15273 | 1 |
| D | 0 | 17052 | 1 |
| Mode M9 | |||
|---|---|---|---|
| Quadrant | BADHDUFLAG | Total packets | Discarded packets |
| A | 0 | 2 | 0 |
| B | 0 | 2 | 0 |
| C | 0 | 2 | 0 |
| D | 0 | 2 | 0 |
| Quadrant | Total seconds | Saturated seconds | Saturation percentage |
|---|---|---|---|
| A | 7445 | 56 | 0.752183% |
| B | 7445 | 118 | 1.584956% |
| C | 7445 | 26 | 0.349228% |
| D | 7445 | 117 | 1.571525% |
Noise dominated data is calculated using 1-second bins in cleaned event files. If a bin has >2000 counts, and if more than 50% of those come from <1% of pixels, then it is considered to be noise-dominated and hence unusable.
| Quadrant | # 1 sec bins | Bins with >0 counts | Bins with >2000 counts | High rate bins dominated by noise | Noise dominated (total time) | Noise dominated (detector-on time) | Marked lightcurve |
|---|---|---|---|---|---|---|---|
| A | 7630 | 7447 | 3 | 3 | 0.04% | 0.04% | 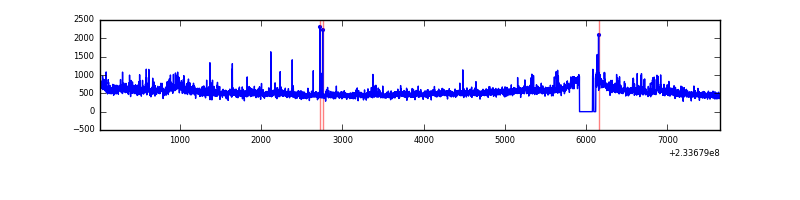 |
| B | 7630 | 7447 | 49 | 49 | 0.64% | 0.66% | 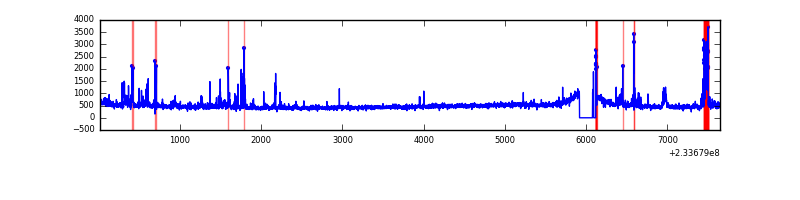 |
| C | 7630 | 7447 | 0 | 0 | 0.00% | 0.00% | 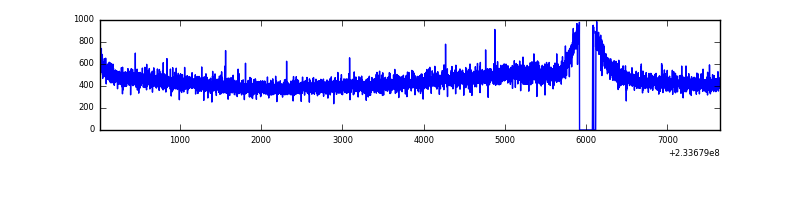 |
| D | 7630 | 7447 | 58 | 58 | 0.76% | 0.78% | 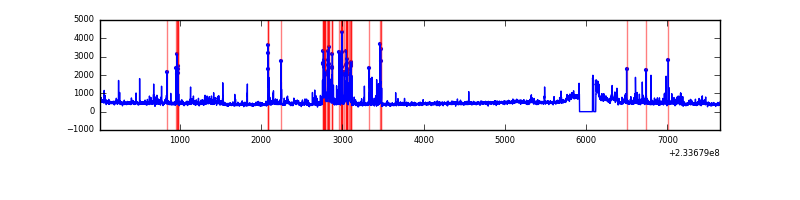 |
Top three noisy pixels from each quadrant. If the there are fewer than three noisy pixels in the level2.evt file, extra rows are filled as -1
| Pixel properties | Quadrant properties | ||||||
|---|---|---|---|---|---|---|---|
| Quadrant | DetID | PixID | Counts | Sigma | Mean | Median | Sigma |
| A | 8 | 5 | 509503 | 2819.69 | 885 | 866 | 180.4 |
| A | 1 | 162 | 67635 | 370.14 | 885 | 866 | 180.4 |
| A | 5 | 16 | 26656 | 142.97 | 885 | 866 | 180.4 |
| B | 10 | 16 | 253275 | 1478.34 | 884 | 863 | 170.7 |
| B | 0 | 230 | 100871 | 585.73 | 884 | 863 | 170.7 |
| B | 0 | 214 | 33456 | 190.89 | 884 | 863 | 170.7 |
| C | 8 | 128 | 10101 | 46.09 | 858 | 862 | 200.5 |
| C | 13 | 61 | 6627 | 28.76 | 858 | 862 | 200.5 |
| C | 8 | 112 | 6210 | 26.68 | 858 | 862 | 200.5 |
| D | 12 | 233 | 330442 | 1429.47 | 851 | 831 | 230.6 |
| D | 6 | 225 | 160889 | 694.15 | 851 | 831 | 230.6 |
| D | 10 | 199 | 113268 | 487.62 | 851 | 831 | 230.6 |
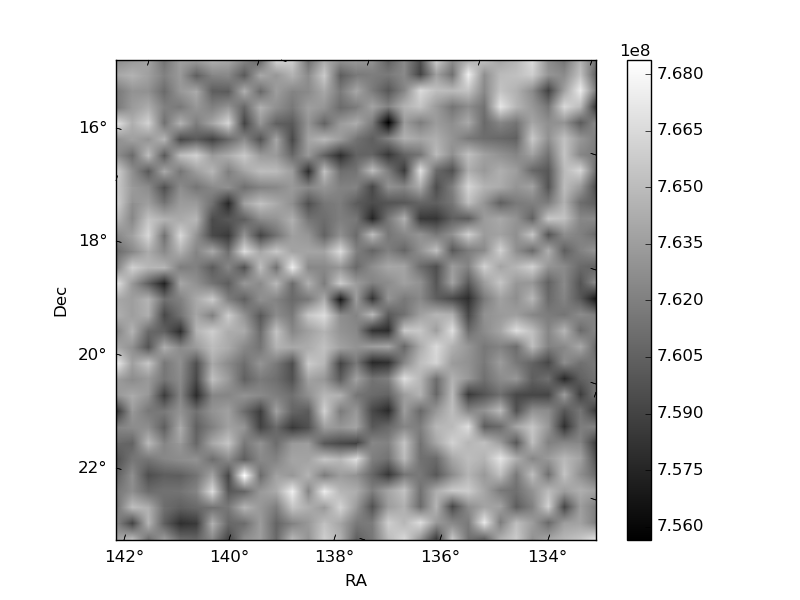
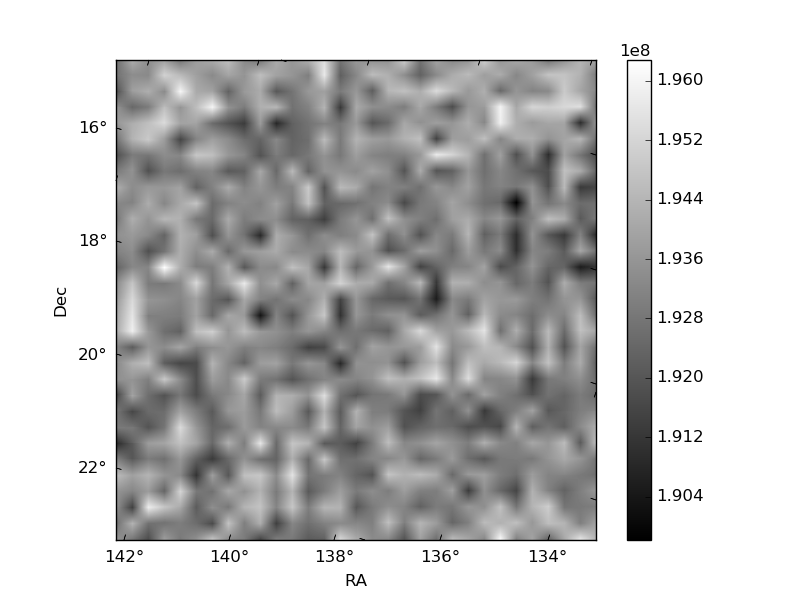
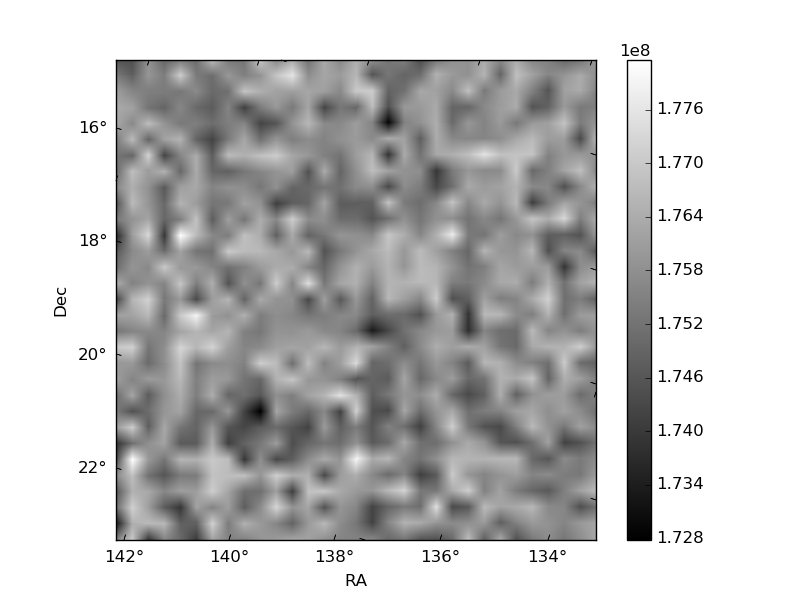
Histogram calculated using DETX and DETY for each event in the final _common_clean file
| Quadrant A | 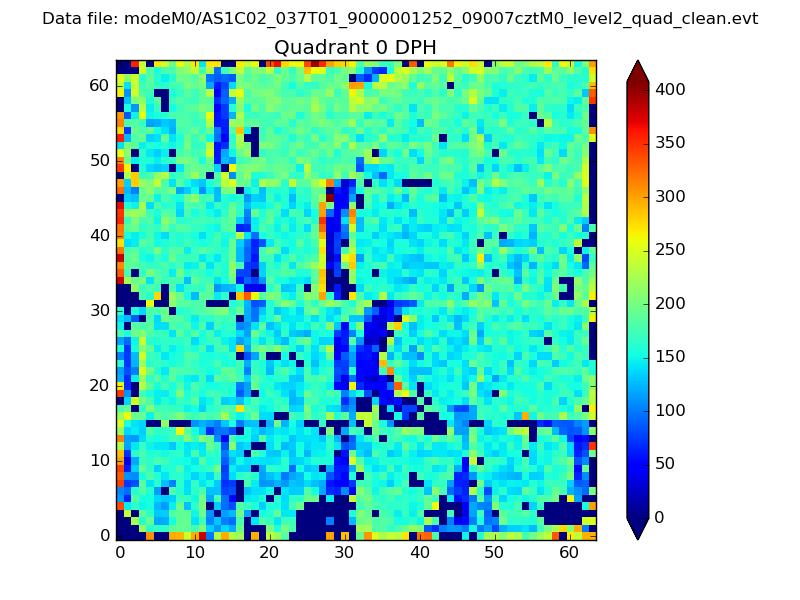 |
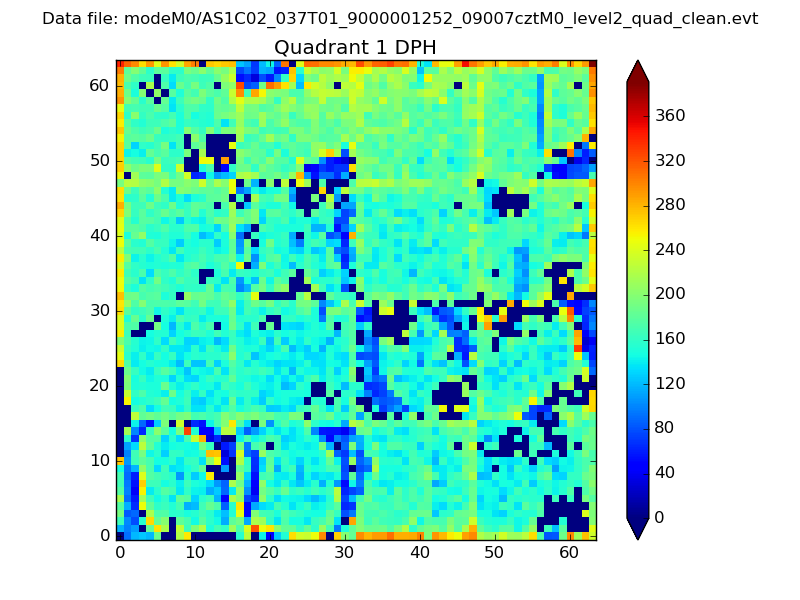 |
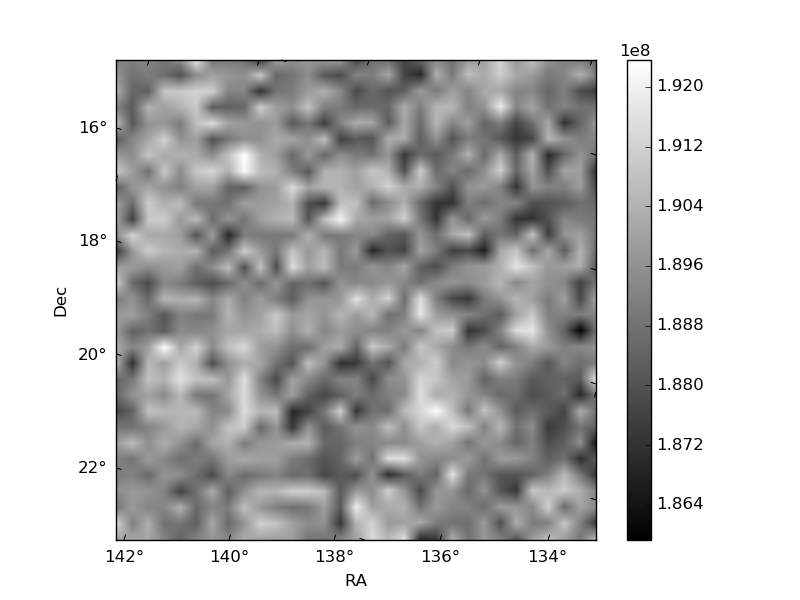
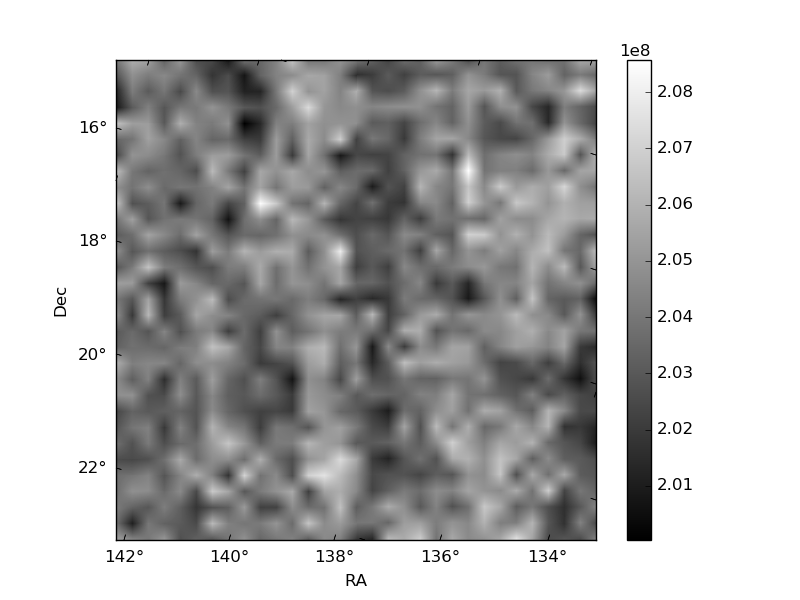
Quadrant B |
|---|---|---|---|
| Quadrant D | 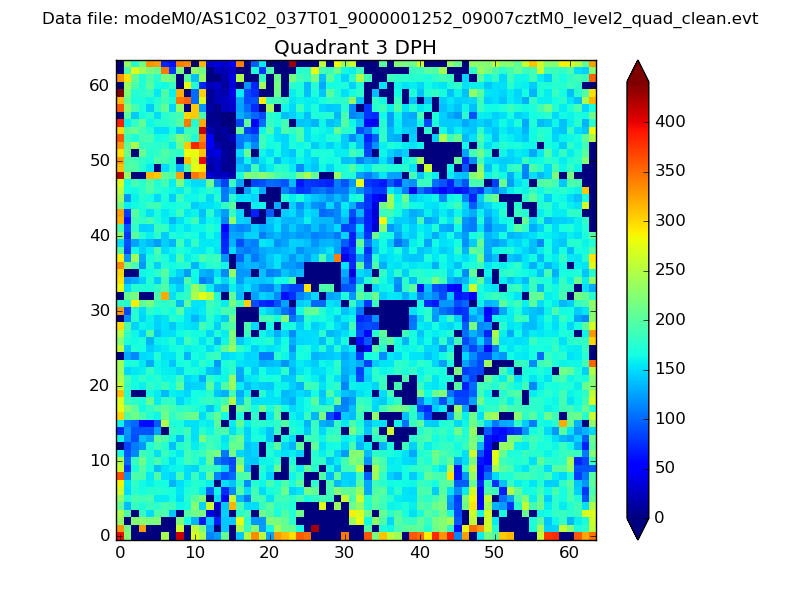 |
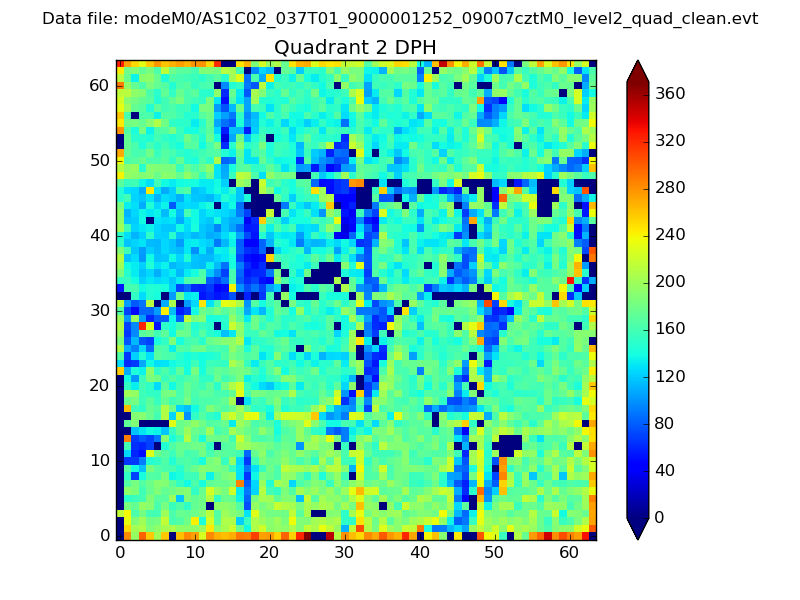 |
Quadrant C |
| Plot type | Count rate plots | Images |
|---|---|---|
| Comparison with Poisson distribution Blue bars denote a histogram of data divided into 1 sec bins. Red curve is a Poisson curve with rate = median count rate of data. |
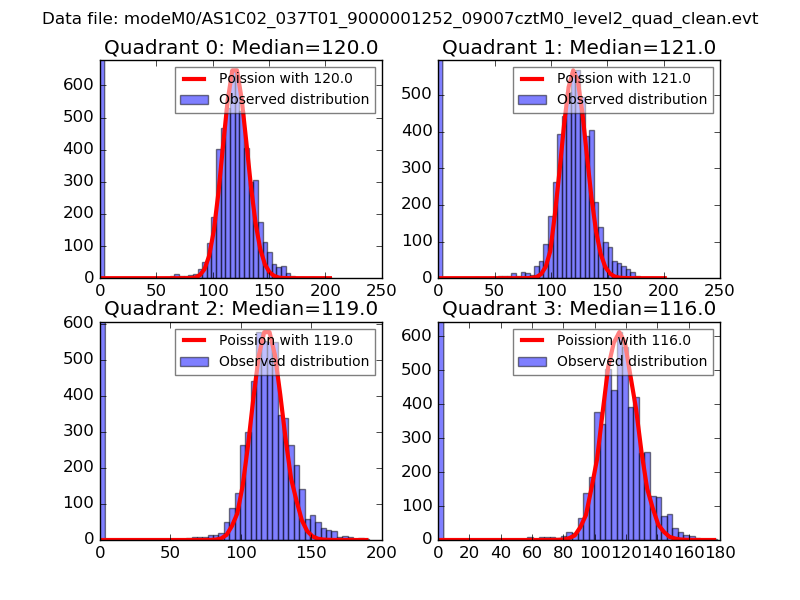 |
 |
| Quadrant-wise count rates Data is divided into 100 sec bins |
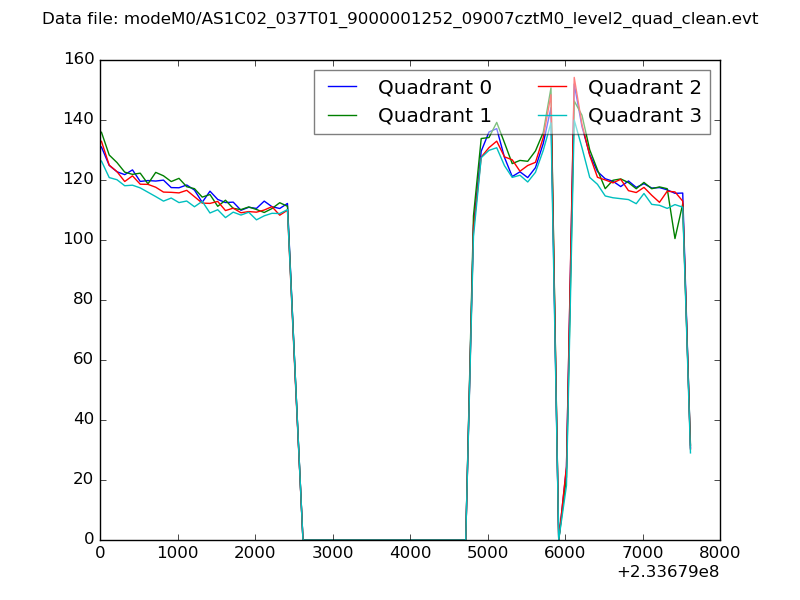 |
|
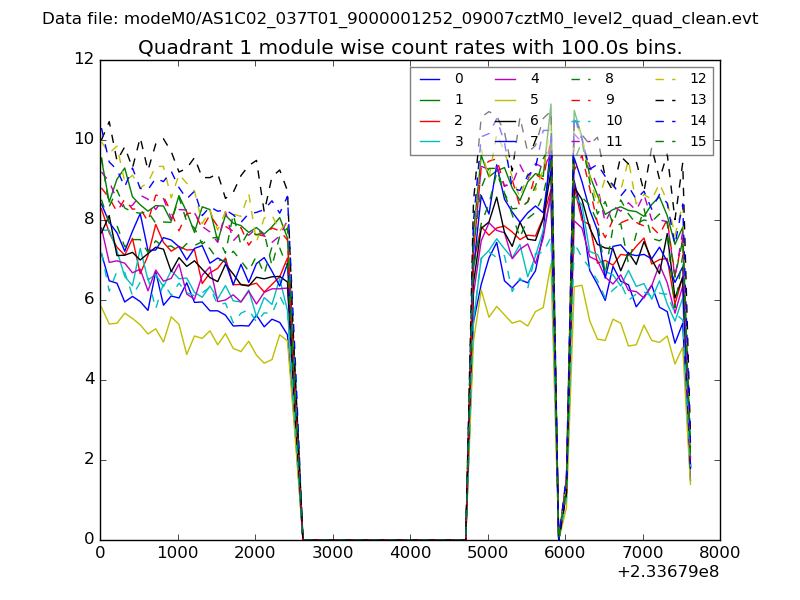
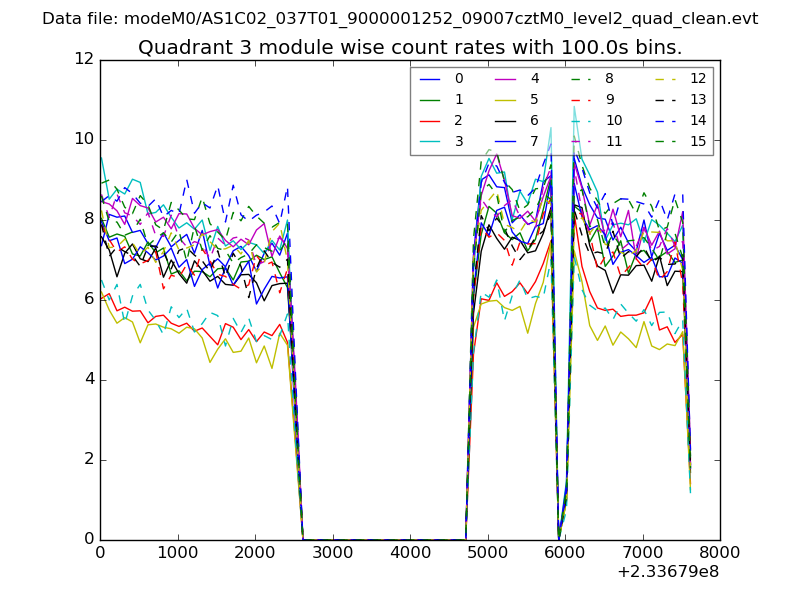
| Module-wise count rates for Quadrant A Data is divided into 100 sec bins |
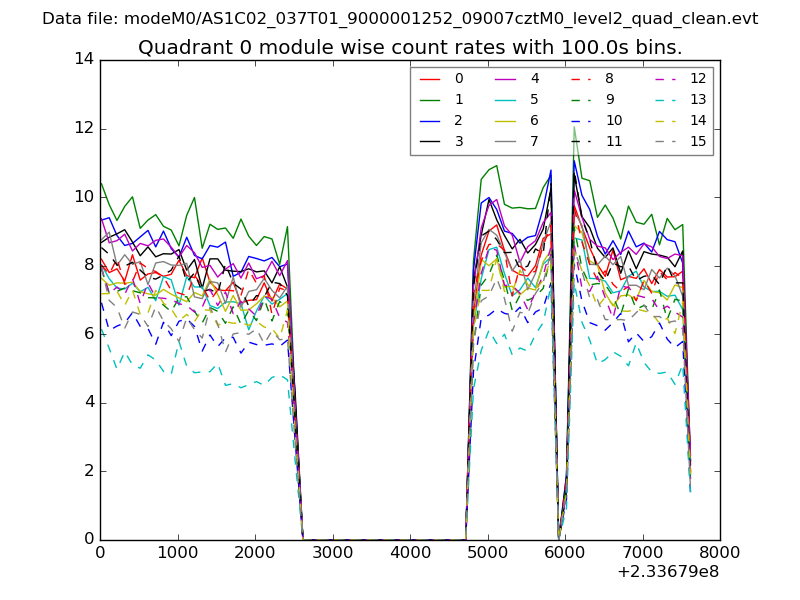 |
 |
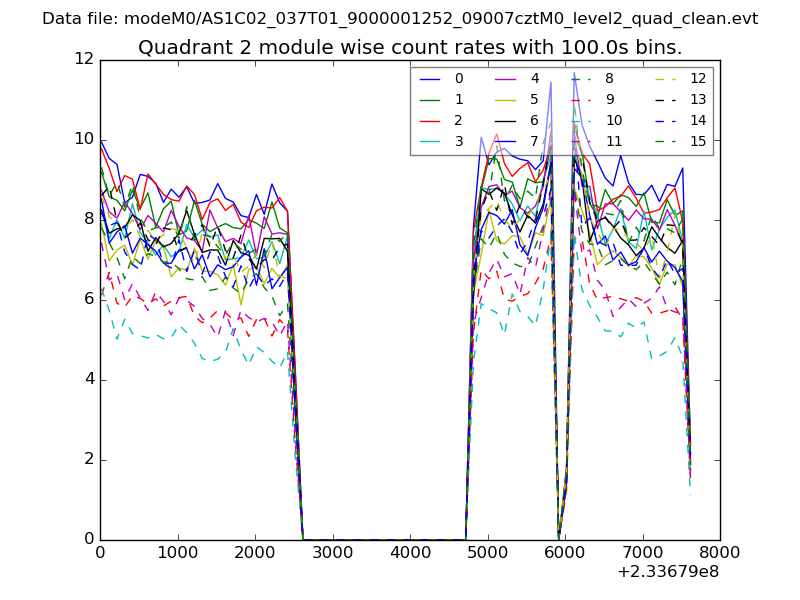
| Module-wise count rates for Quadrant B Data is divided into 100 sec bins |
 |
 |
| Module-wise count rates for Quadrant C Data is divided into 100 sec bins |
 |
 |
| Module-wise count rates for Quadrant D Data is divided into 100 sec bins |
 |
 |
| Parameter | Plot |
|---|---|
| CZT HV Monitor | 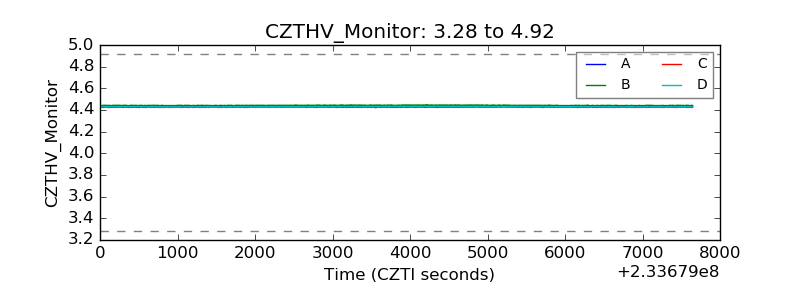 |
| D_VDD | 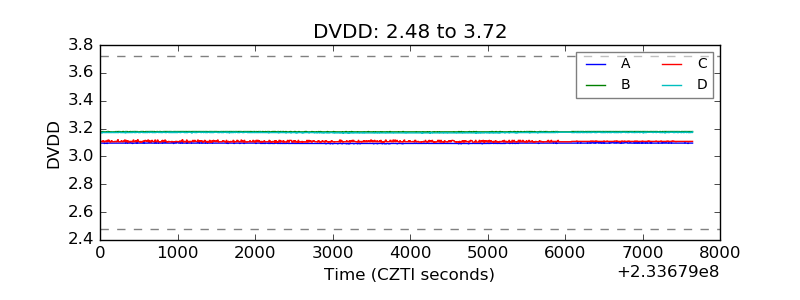 |
| Temperature 1 | 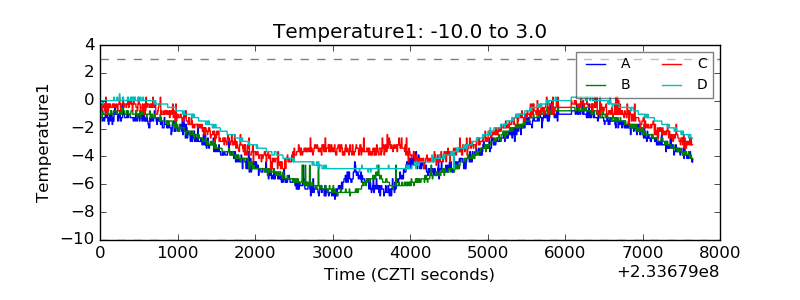 |
| Veto HV Monitor |  |
| Veto LLD | 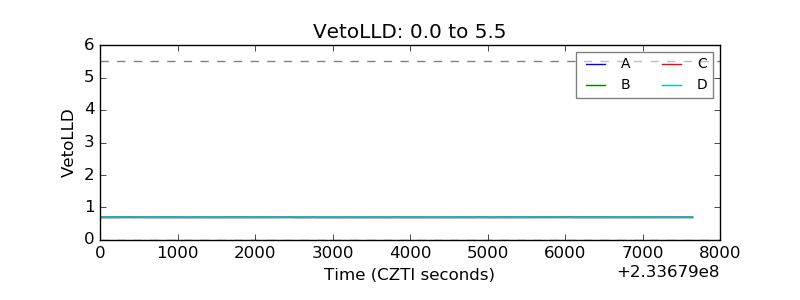 |
| Alpha Counter | 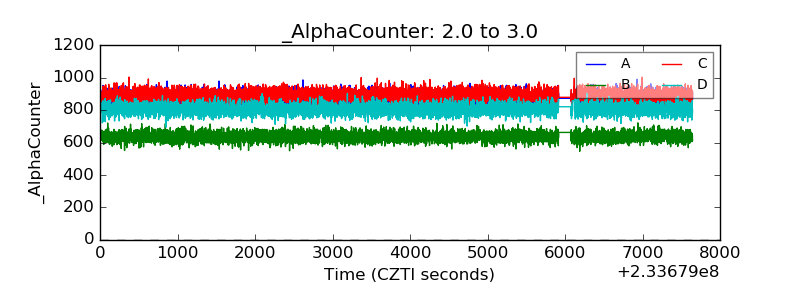 |
| _CPM_Rate | 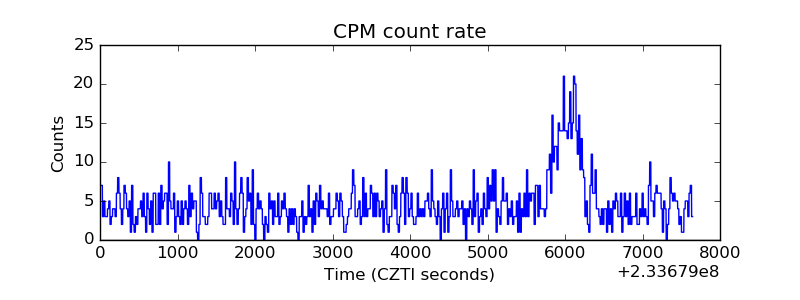 |
| CZT Counter | 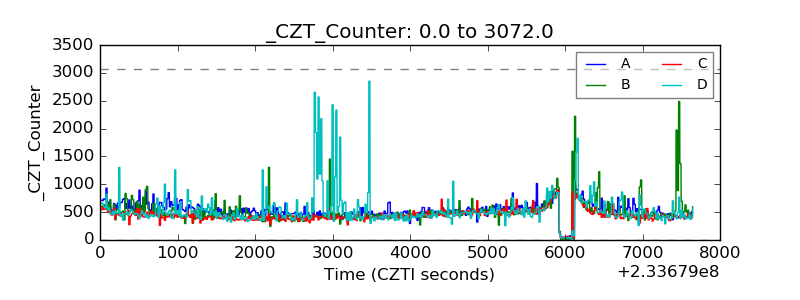 |
| +2.5 Volts monitor | 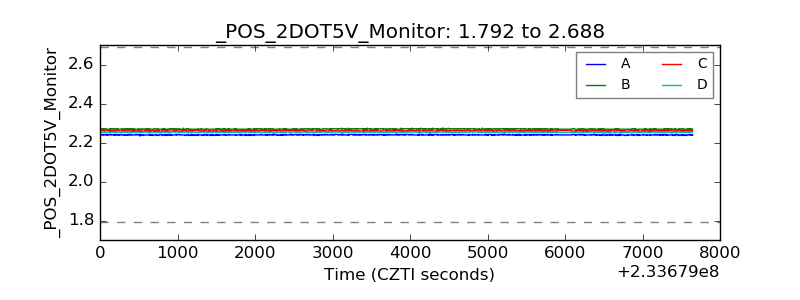 |
| +5 Volts monitor | 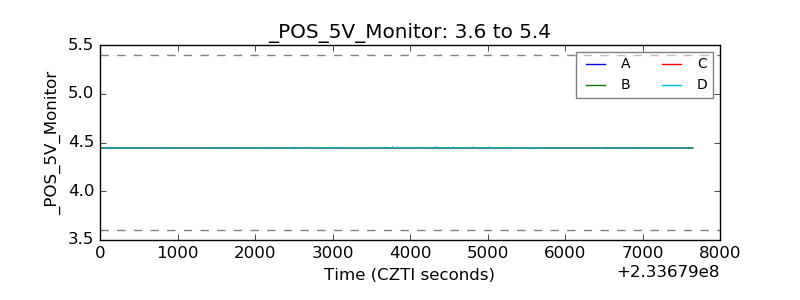 |
| _ROLL_ROT | 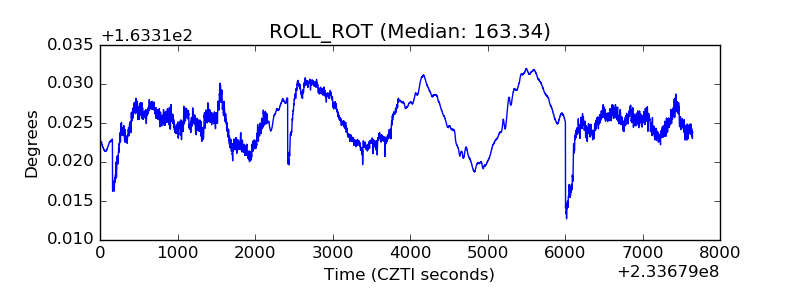 |
| _Roll_DEC | 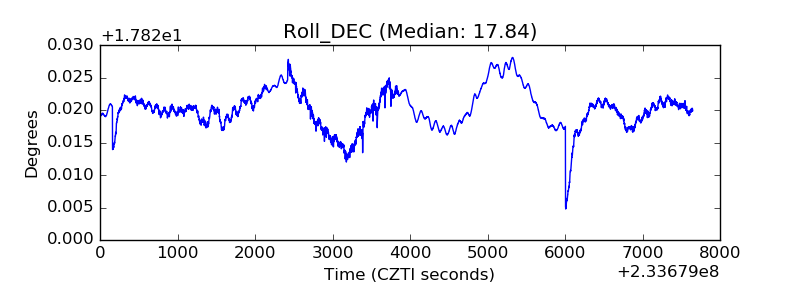 |
| _Roll_RA | 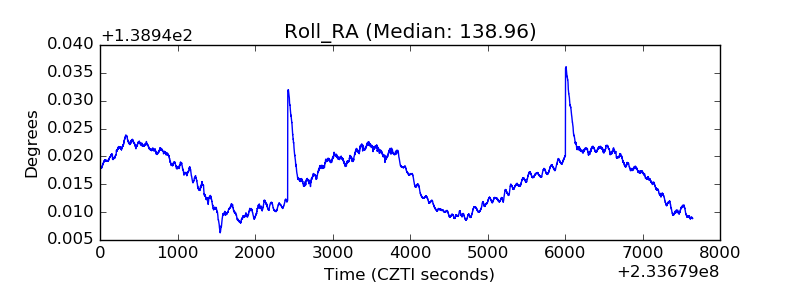 |
| Veto Counter | 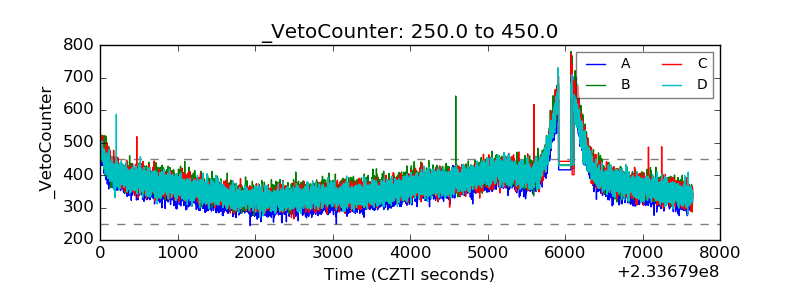 |