| Param | Original file | Final file |
|---|---|---|
| Filename | modeM0/AS1C02_037T01_9000001252_09011cztM0_level2.evt | modeM0/AS1C02_037T01_9000001252_09011cztM0_level2_quad_clean.evt |
| Size (bytes) | 1,701,979,200 | 203,886,720 |
| Size | 1.6 GB | 194.4 MB |
| Events in quadrant A | 14,338,757 | 1,247,811 |
| Events in quadrant B | 10,631,732 | 1,267,934 |
| Events in quadrant C | 8,122,297 | 1,276,603 |
| Events in quadrant D | 17,209,665 | 1,110,857 |
| Mode SS | |||
|---|---|---|---|
| Quadrant | BADHDUFLAG | Total packets | Discarded packets |
| A | 0 | 374 | 0 |
| B | 0 | 374 | 0 |
| C | 0 | 374 | 0 |
| D | 0 | 374 | 0 |
| Mode M0 | |||
|---|---|---|---|
| Quadrant | BADHDUFLAG | Total packets | Discarded packets |
| A | 0 | 54785 | 30 |
| B | 0 | 43880 | 25 |
| C | 0 | 37376 | 17 |
| D | 0 | 63843 | 49 |
| Mode M9 | |||
|---|---|---|---|
| Quadrant | BADHDUFLAG | Total packets | Discarded packets |
| A | 0 | 22 | 0 |
| B | 0 | 22 | 0 |
| C | 0 | 22 | 0 |
| D | 0 | 23 | 0 |
| Quadrant | Total seconds | Saturated seconds | Saturation percentage |
|---|---|---|---|
| A | 18441 | 922 | 4.999729% |
| B | 18441 | 664 | 3.600672% |
| C | 18445 | 54 | 0.292762% |
| D | 18439 | 2552 | 13.840230% |
Noise dominated data is calculated using 1-second bins in cleaned event files. If a bin has >2000 counts, and if more than 50% of those come from <1% of pixels, then it is considered to be noise-dominated and hence unusable.
| Quadrant | # 1 sec bins | Bins with >0 counts | Bins with >2000 counts | High rate bins dominated by noise | Noise dominated (total time) | Noise dominated (detector-on time) | Marked lightcurve |
|---|---|---|---|---|---|---|---|
| A | 20447 | 18456 | 550 | 550 | 2.69% | 2.98% | 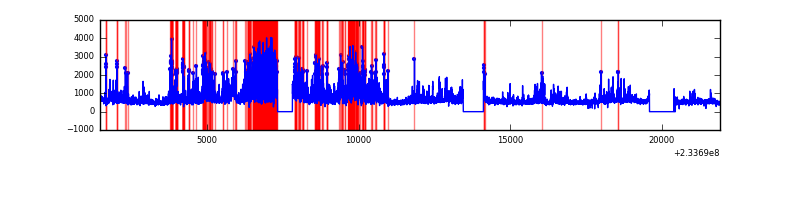 |
| B | 20447 | 18455 | 410 | 410 | 2.01% | 2.22% | 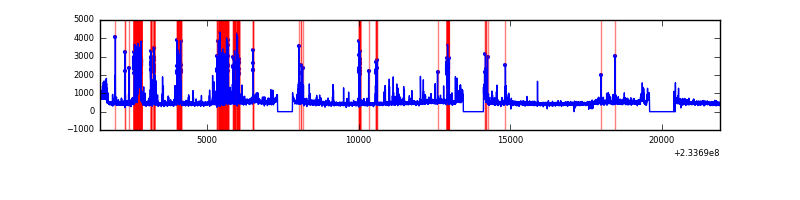 |
| C | 20447 | 18456 | 0 | 0 | 0.00% | 0.00% | 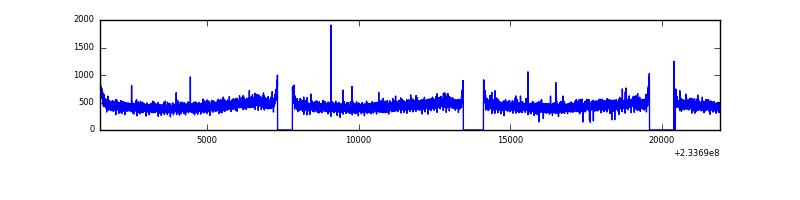 |
| D | 20447 | 18456 | 2318 | 2318 | 11.34% | 12.56% | 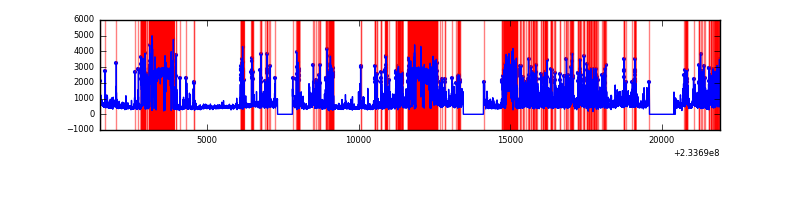 |
Top three noisy pixels from each quadrant. If the there are fewer than three noisy pixels in the level2.evt file, extra rows are filled as -1
| Pixel properties | Quadrant properties | ||||||
|---|---|---|---|---|---|---|---|
| Quadrant | DetID | PixID | Counts | Sigma | Mean | Median | Sigma |
| A | 8 | 5 | 5844418 | 13542.21 | 2114 | 2064 | 431.4 |
| A | 15 | 174 | 173507 | 397.39 | 2114 | 2064 | 431.4 |
| A | 13 | 251 | 73767 | 166.2 | 2114 | 2064 | 431.4 |
| B | 10 | 16 | 1211722 | 2955.93 | 2135 | 2086 | 409.2 |
| B | 4 | 48 | 585050 | 1424.56 | 2135 | 2086 | 409.2 |
| B | 0 | 230 | 269722 | 654.01 | 2135 | 2086 | 409.2 |
| C | 13 | 61 | 16131 | 28.99 | 2080 | 2091 | 484.3 |
| C | 8 | 128 | 7151 | 10.45 | 2080 | 2091 | 484.3 |
| C | 3 | 202 | 5249 | 6.52 | 2080 | 2091 | 484.3 |
| D | 1 | 52 | 8016691 | 17198.38 | 1901 | 1840 | 466.0 |
| D | 6 | 225 | 1206630 | 2585.26 | 1901 | 1840 | 466.0 |
| D | 7 | 71 | 305123 | 650.79 | 1901 | 1840 | 466.0 |
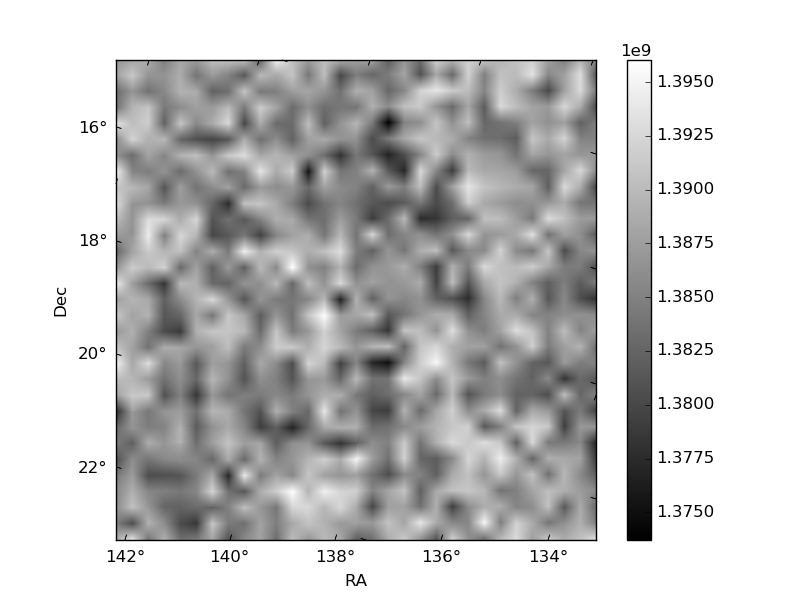
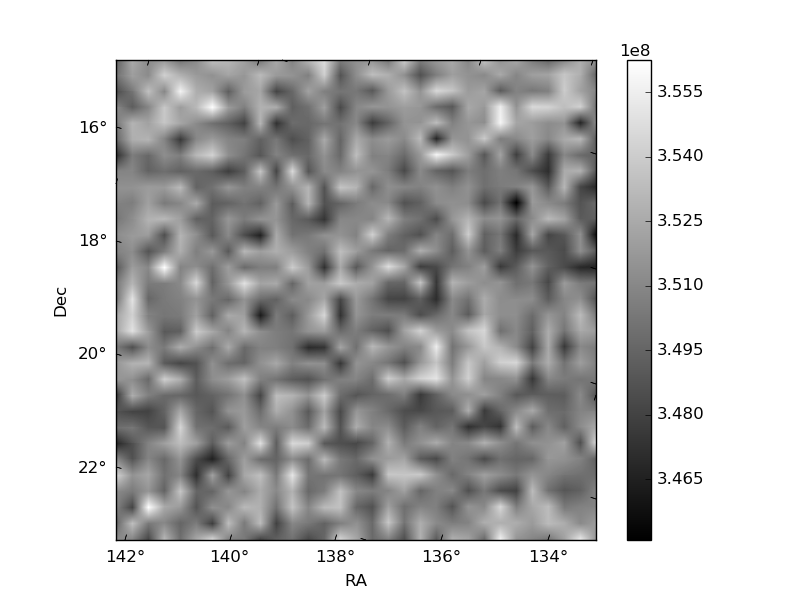
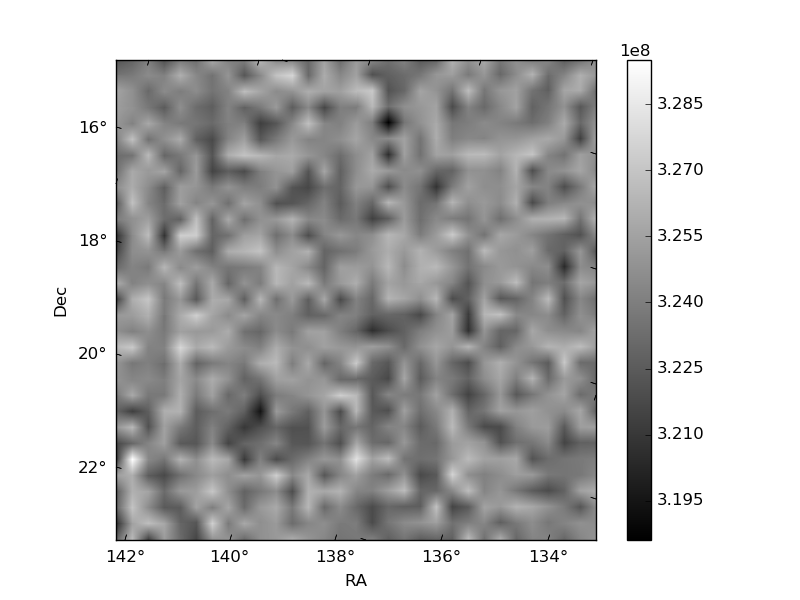
Histogram calculated using DETX and DETY for each event in the final _common_clean file
| Quadrant A | 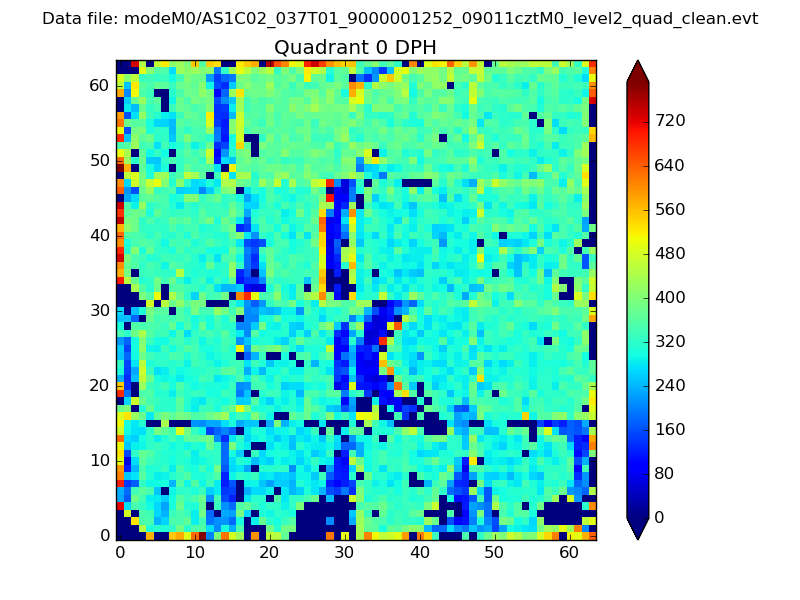 |
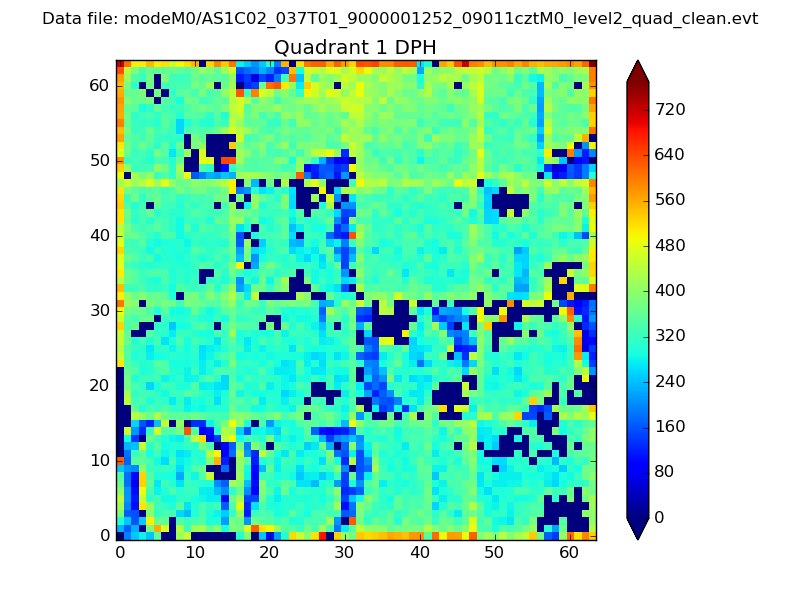 |
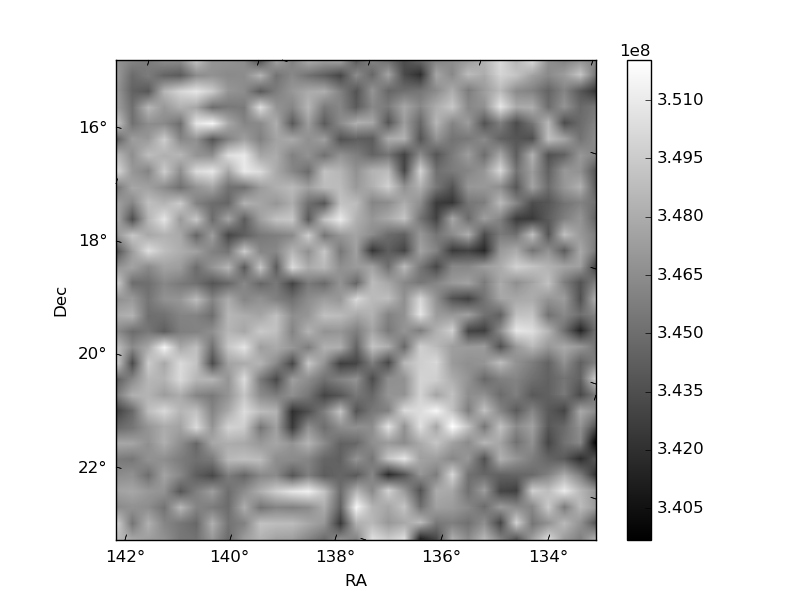
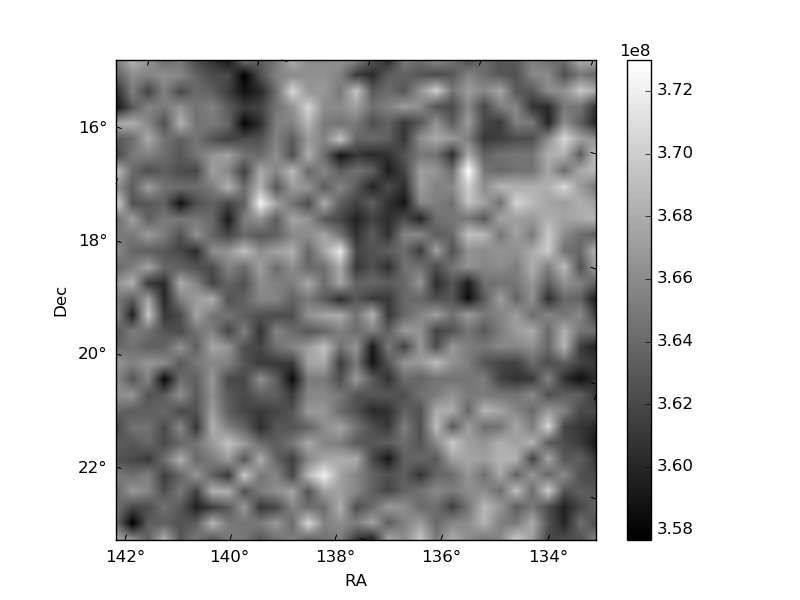
Quadrant B |
|---|---|---|---|
| Quadrant D | 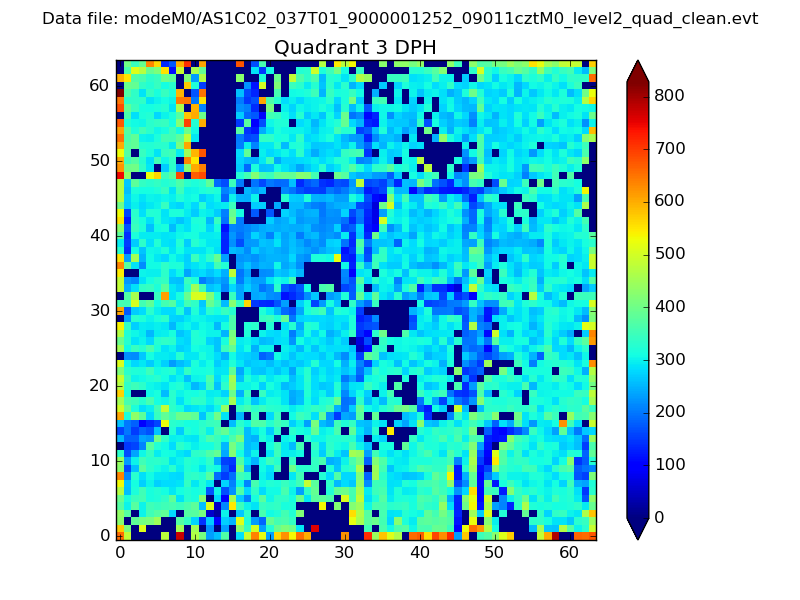 |
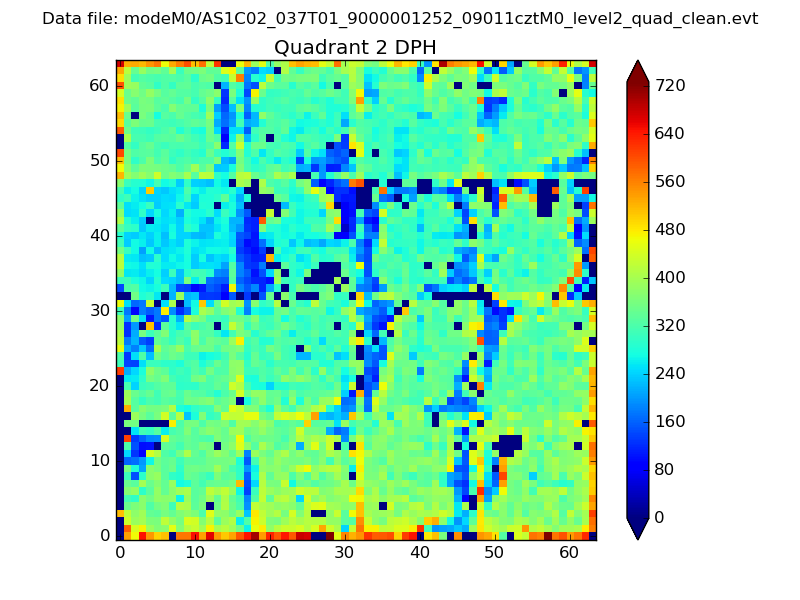 |
Quadrant C |
| Plot type | Count rate plots | Images |
|---|---|---|
| Comparison with Poisson distribution Blue bars denote a histogram of data divided into 1 sec bins. Red curve is a Poisson curve with rate = median count rate of data. |
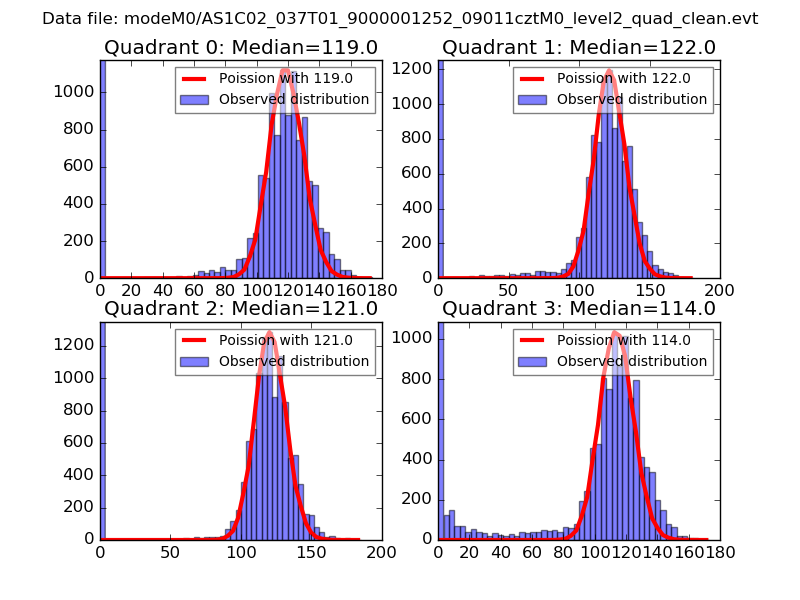 |
 |
| Quadrant-wise count rates Data is divided into 100 sec bins |
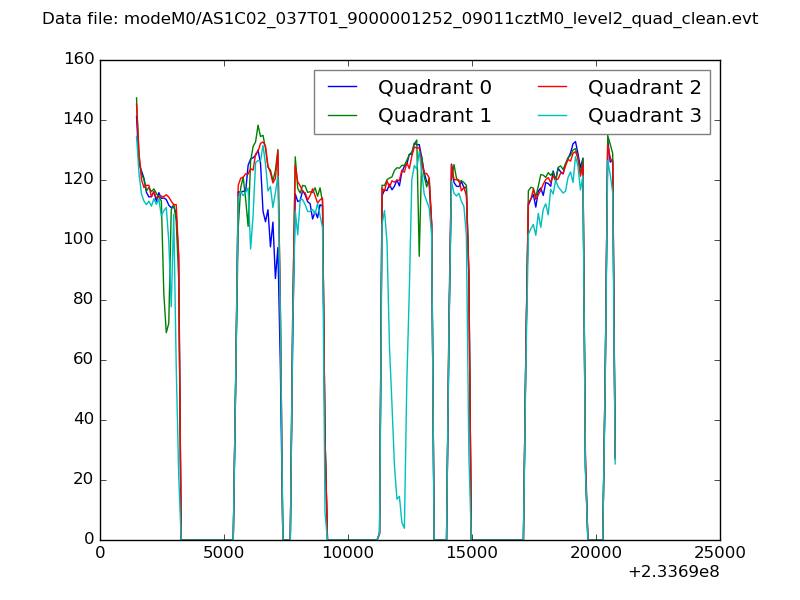 |
|
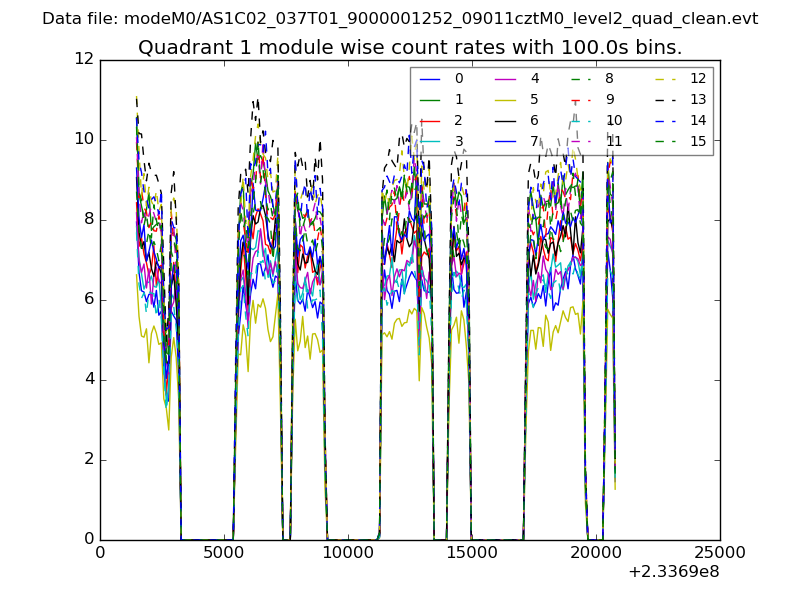
| Module-wise count rates for Quadrant A Data is divided into 100 sec bins |
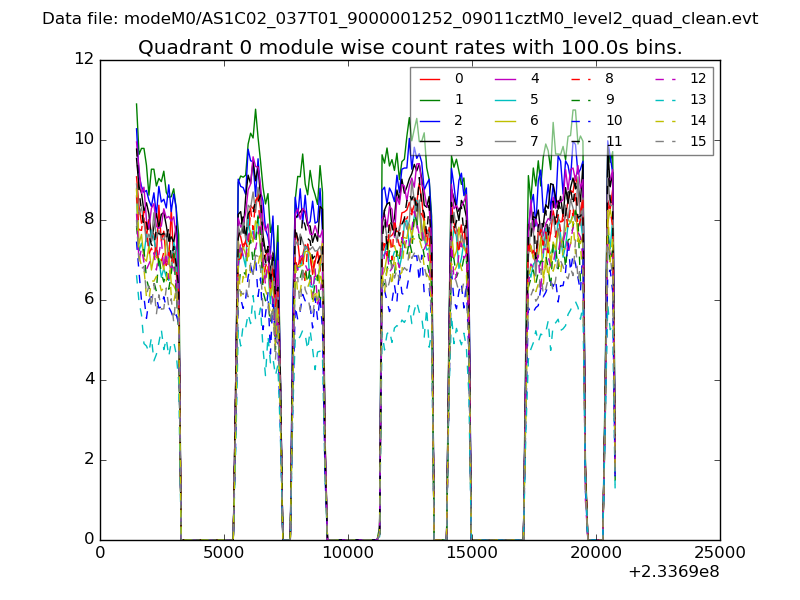 |
 |
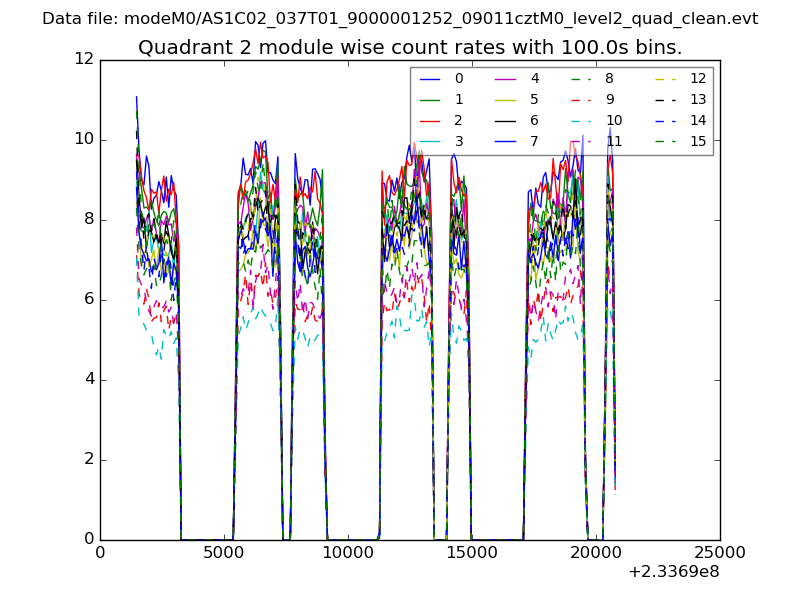
| Module-wise count rates for Quadrant B Data is divided into 100 sec bins |
 |
 |
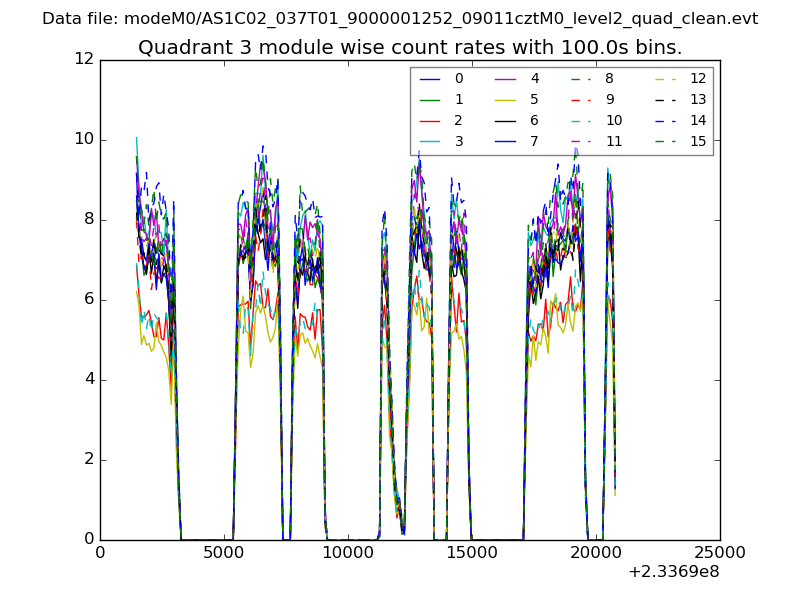
| Module-wise count rates for Quadrant C Data is divided into 100 sec bins |
 |
 |
| Module-wise count rates for Quadrant D Data is divided into 100 sec bins |
 |
 |
| Parameter | Plot |
|---|---|
| CZT HV Monitor | 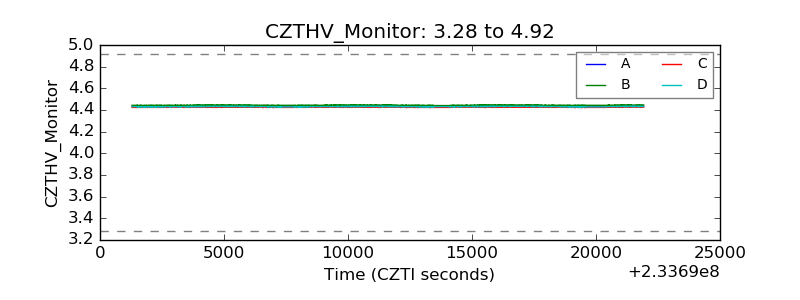 |
| D_VDD | 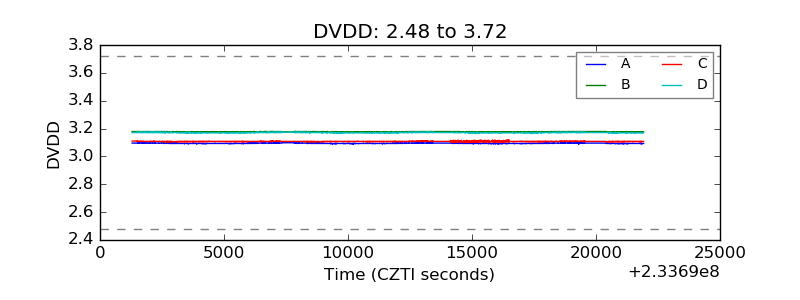 |
| Temperature 1 |  |
| Veto HV Monitor | 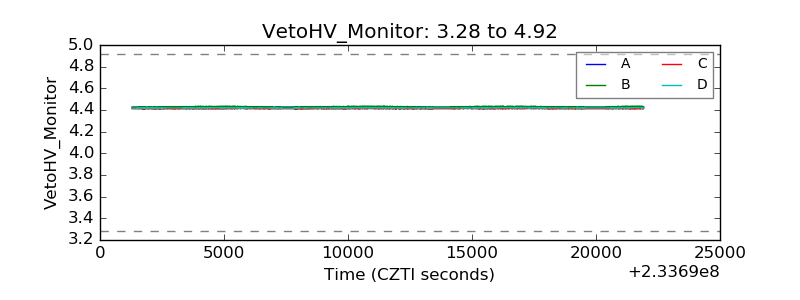 |
| Veto LLD | 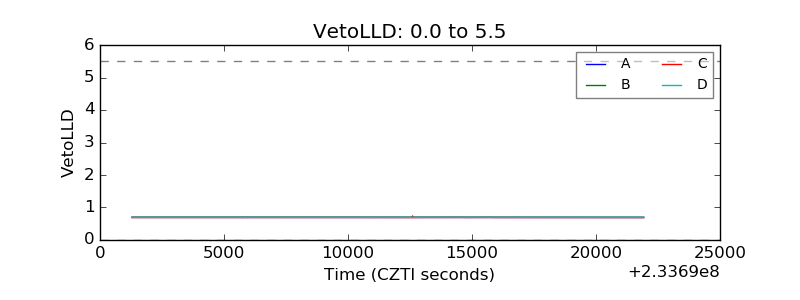 |
| Alpha Counter | 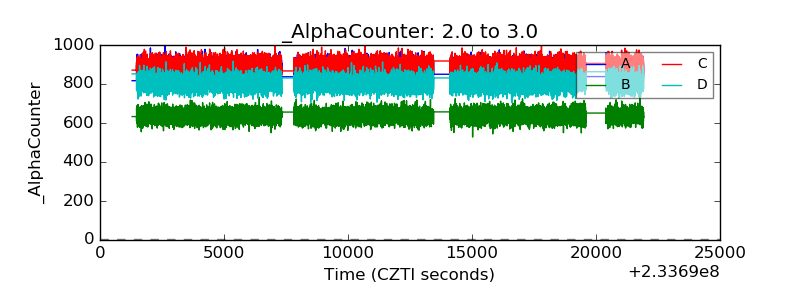 |
| _CPM_Rate | 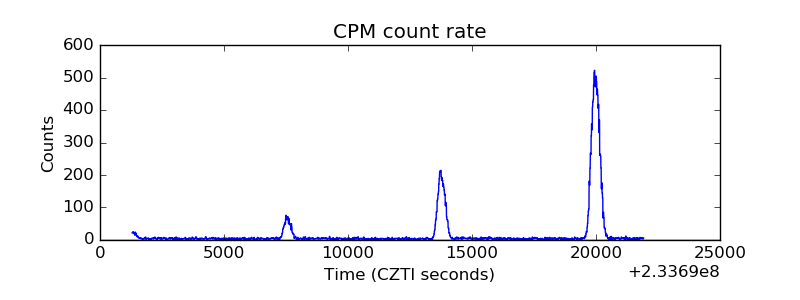 |
| CZT Counter | 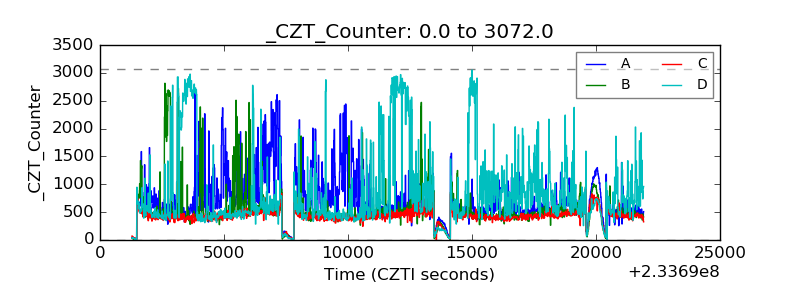 |
| +2.5 Volts monitor |  |
| +5 Volts monitor |  |
| _ROLL_ROT | 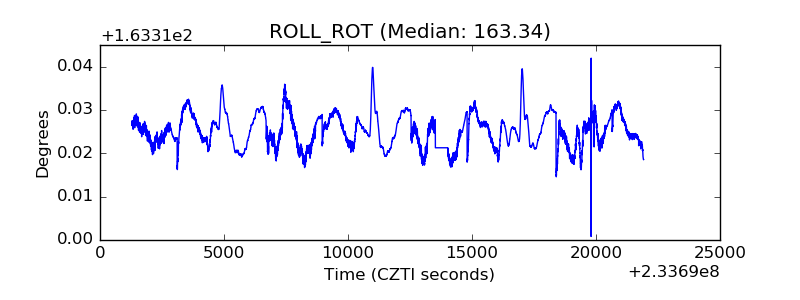 |
| _Roll_DEC | 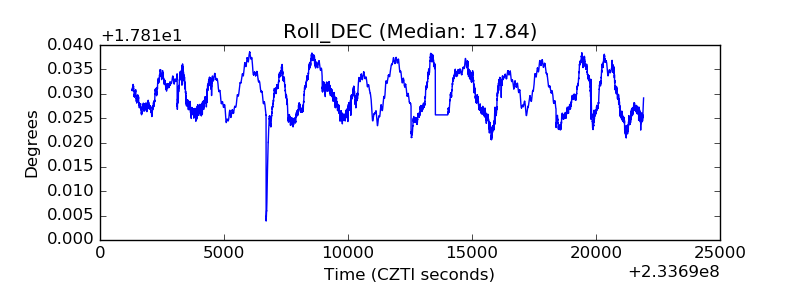 |
| _Roll_RA | 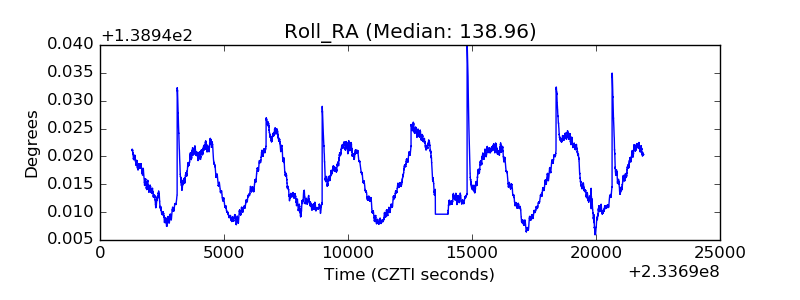 |
| Veto Counter | 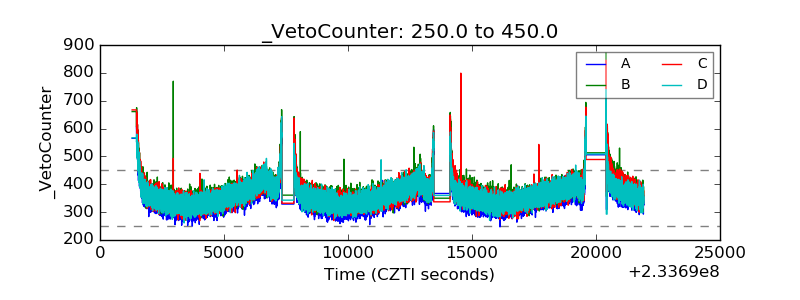 |