| Param | Original file | Final file |
|---|---|---|
| Filename | modeM0/AS1C02_037T01_9000001252_09018cztM0_level2.evt | modeM0/AS1C02_037T01_9000001252_09018cztM0_level2_quad_clean.evt |
| Size (bytes) | 279,011,520 | 49,224,960 |
| Size | 266.1 MB | 46.9 MB |
| Events in quadrant A | 2,235,609 | 305,781 |
| Events in quadrant B | 1,805,895 | 311,170 |
| Events in quadrant C | 1,692,913 | 303,695 |
| Events in quadrant D | 2,446,041 | 291,227 |
| Mode SS | |||
|---|---|---|---|
| Quadrant | BADHDUFLAG | Total packets | Discarded packets |
| A | 0 | 80 | 0 |
| B | 0 | 80 | 0 |
| C | 0 | 80 | 0 |
| D | 0 | 80 | 0 |
| Mode M0 | |||
|---|---|---|---|
| Quadrant | BADHDUFLAG | Total packets | Discarded packets |
| A | 0 | 9297 | 0 |
| B | 0 | 8016 | 2 |
| C | 0 | 7891 | 4 |
| D | 0 | 9918 | 0 |
| Quadrant | Total seconds | Saturated seconds | Saturation percentage |
|---|---|---|---|
| A | 3942 | 4 | 0.101471% |
| B | 3941 | 2 | 0.050749% |
| C | 3940 | 2 | 0.050761% |
| D | 3942 | 106 | 2.688990% |
Noise dominated data is calculated using 1-second bins in cleaned event files. If a bin has >2000 counts, and if more than 50% of those come from <1% of pixels, then it is considered to be noise-dominated and hence unusable.
| Quadrant | # 1 sec bins | Bins with >0 counts | Bins with >2000 counts | High rate bins dominated by noise | Noise dominated (total time) | Noise dominated (detector-on time) | Marked lightcurve |
|---|---|---|---|---|---|---|---|
| A | 3942 | 3942 | 0 | 0 | 0.00% | 0.00% | 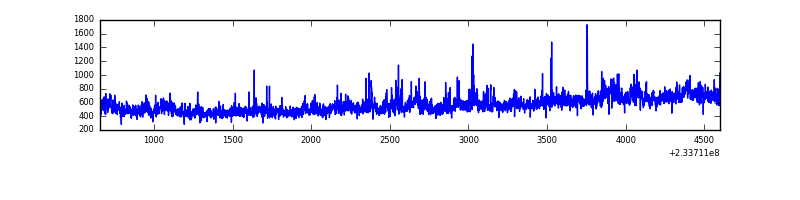 |
| B | 3942 | 3942 | 1 | 1 | 0.03% | 0.03% |  |
| C | 3942 | 3942 | 0 | 0 | 0.00% | 0.00% | 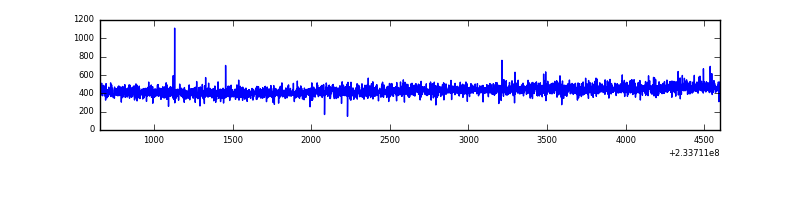 |
| D | 3942 | 3942 | 108 | 108 | 2.74% | 2.74% |  |
Top three noisy pixels from each quadrant. If the there are fewer than three noisy pixels in the level2.evt file, extra rows are filled as -1
| Pixel properties | Quadrant properties | ||||||
|---|---|---|---|---|---|---|---|
| Quadrant | DetID | PixID | Counts | Sigma | Mean | Median | Sigma |
| A | 8 | 5 | 431543 | 4607.46 | 451 | 441 | 93.6 |
| A | 1 | 162 | 40811 | 431.46 | 451 | 441 | 93.6 |
| A | 1 | 178 | 7822 | 78.89 | 451 | 441 | 93.6 |
| B | 0 | 214 | 26361 | 293.34 | 451 | 441 | 88.4 |
| B | 4 | 48 | 12586 | 137.45 | 451 | 441 | 88.4 |
| B | 12 | 111 | 8782 | 94.4 | 451 | 441 | 88.4 |
| C | 13 | 61 | 3370 | 28.92 | 433 | 434 | 101.5 |
| C | 5 | 128 | 1210 | 7.64 | 433 | 434 | 101.5 |
| C | 3 | 202 | 1107 | 6.62 | 433 | 434 | 101.5 |
| D | 1 | 52 | 493415 | 4590.19 | 432 | 418 | 107.4 |
| D | 7 | 71 | 226245 | 2102.63 | 432 | 418 | 107.4 |
| D | 6 | 225 | 54466 | 503.23 | 432 | 418 | 107.4 |
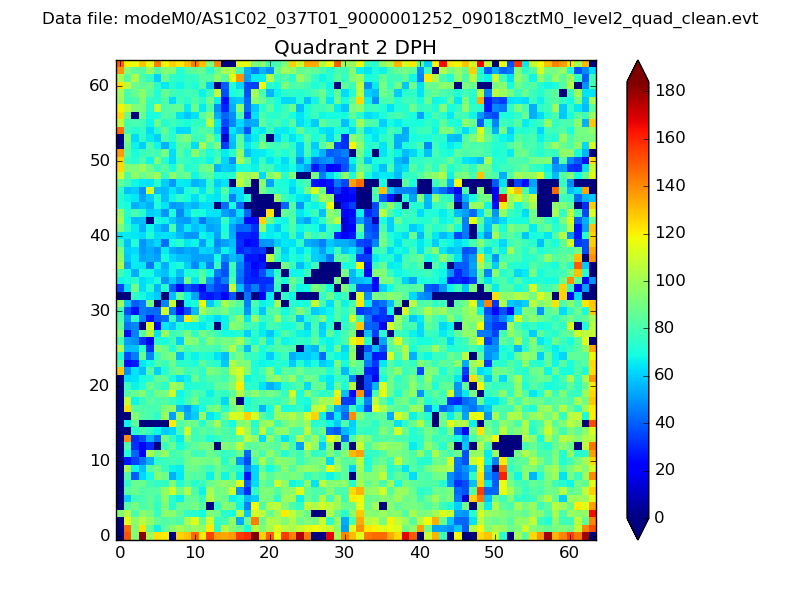
Histogram calculated using DETX and DETY for each event in the final _common_clean file
| Quadrant A | 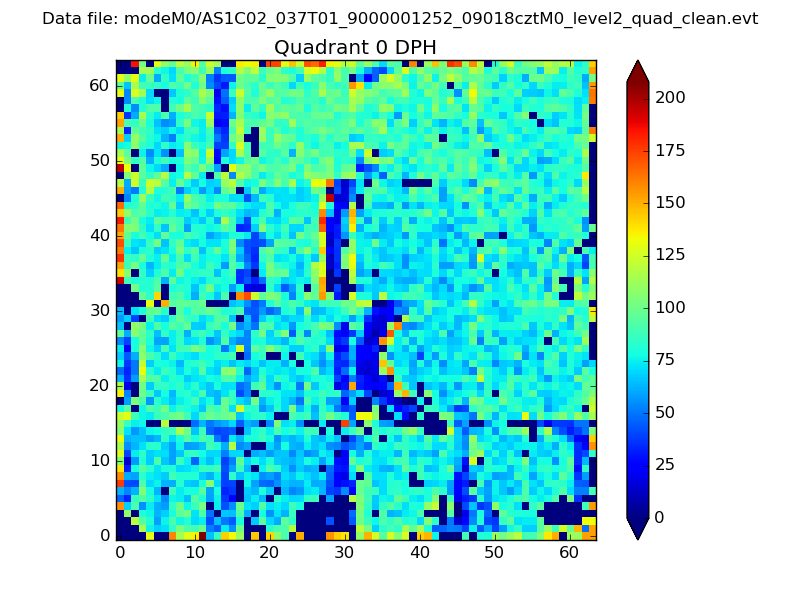 |
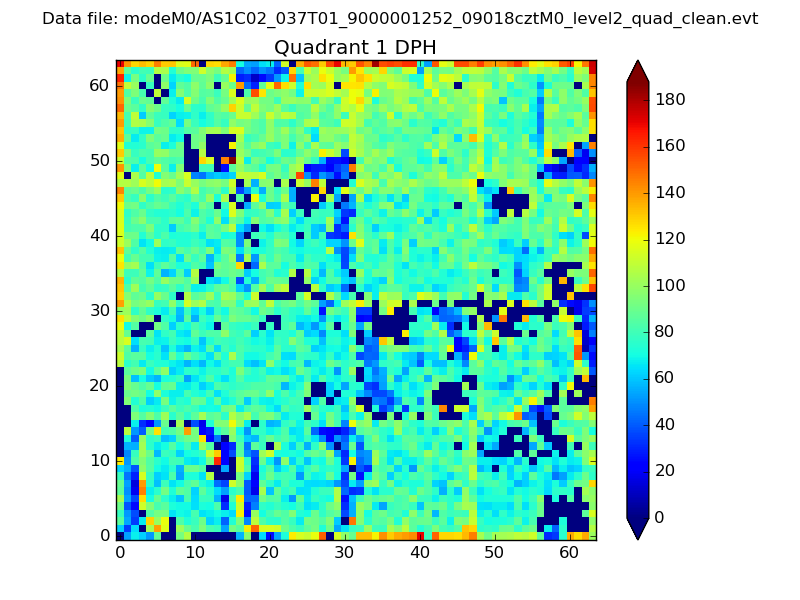 |
Quadrant B |
|---|---|---|---|
| Quadrant D | 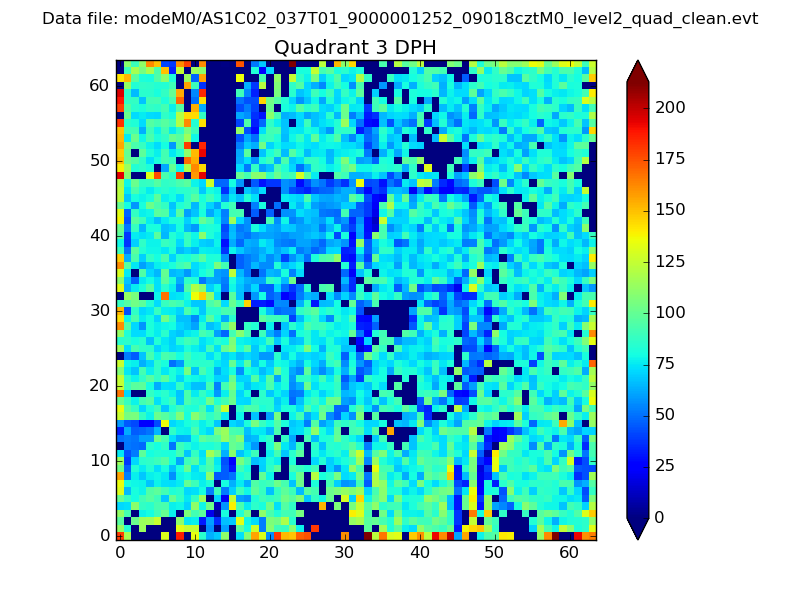 |
 |
Quadrant C |
| Plot type | Count rate plots | Images |
|---|---|---|
| Comparison with Poisson distribution Blue bars denote a histogram of data divided into 1 sec bins. Red curve is a Poisson curve with rate = median count rate of data. |
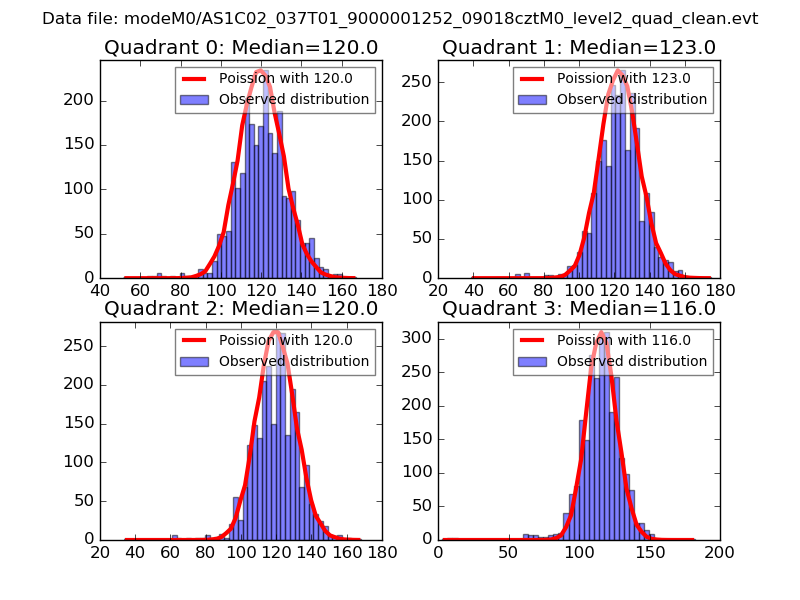 |
 |
| Quadrant-wise count rates Data is divided into 100 sec bins |
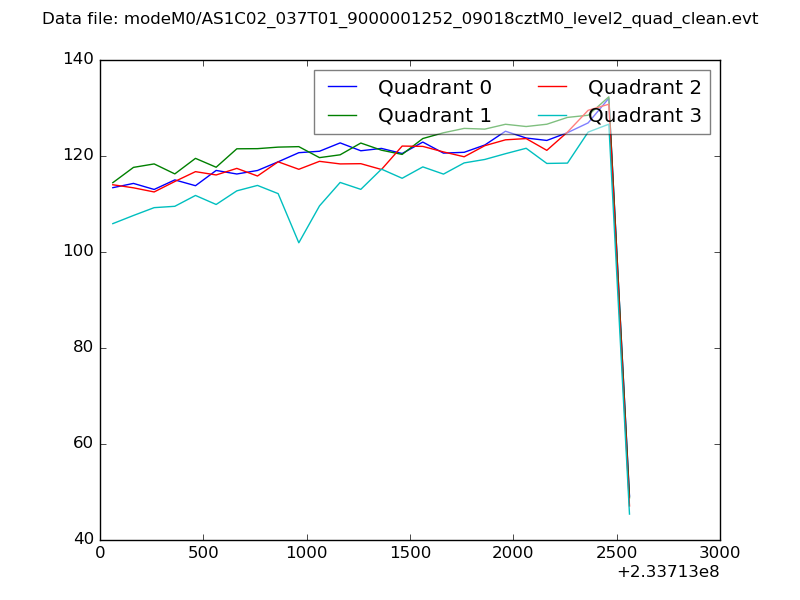 |
|
| Module-wise count rates for Quadrant A Data is divided into 100 sec bins |
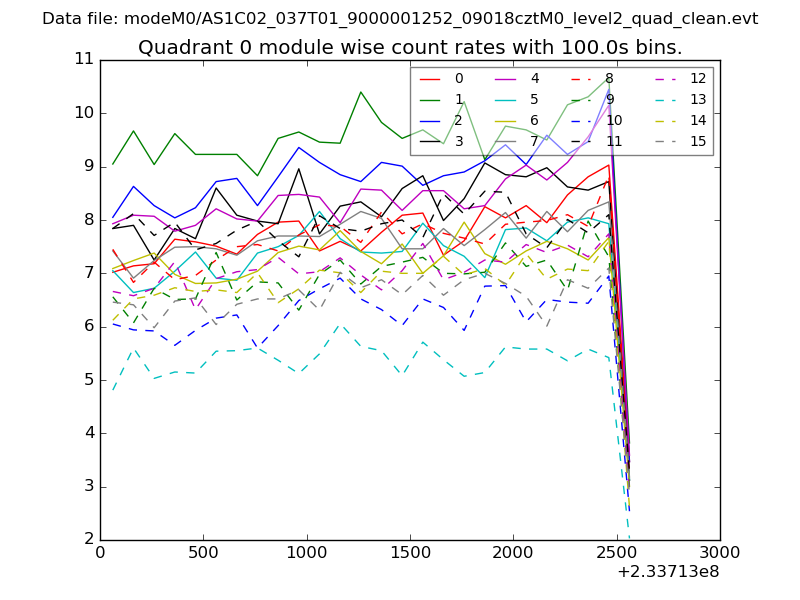 |
 |
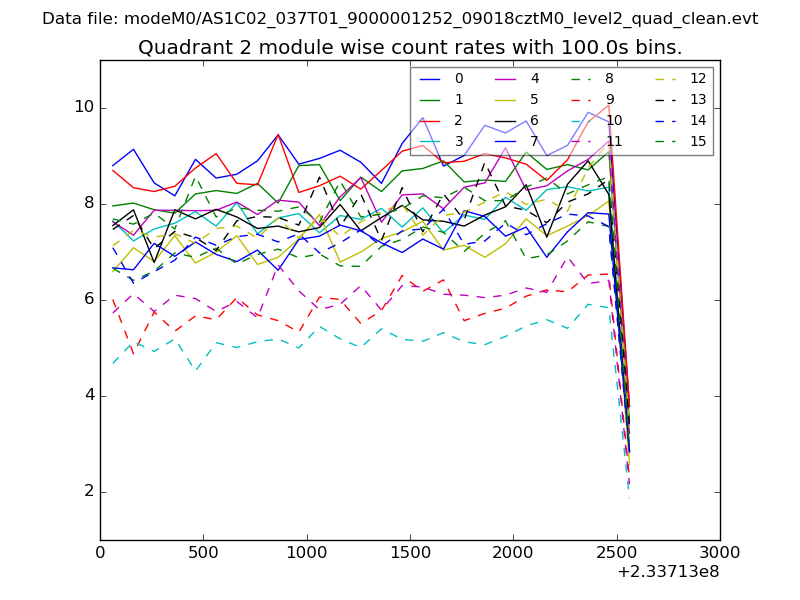
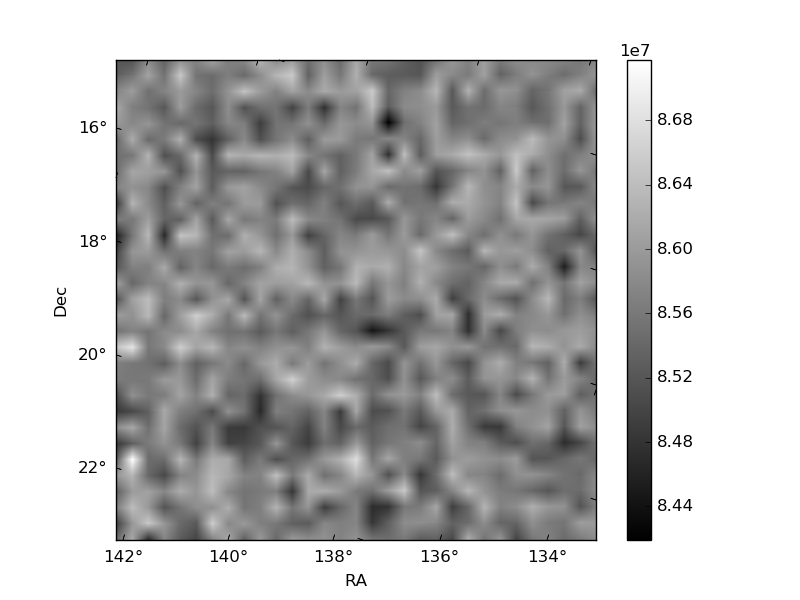
| Module-wise count rates for Quadrant B Data is divided into 100 sec bins |
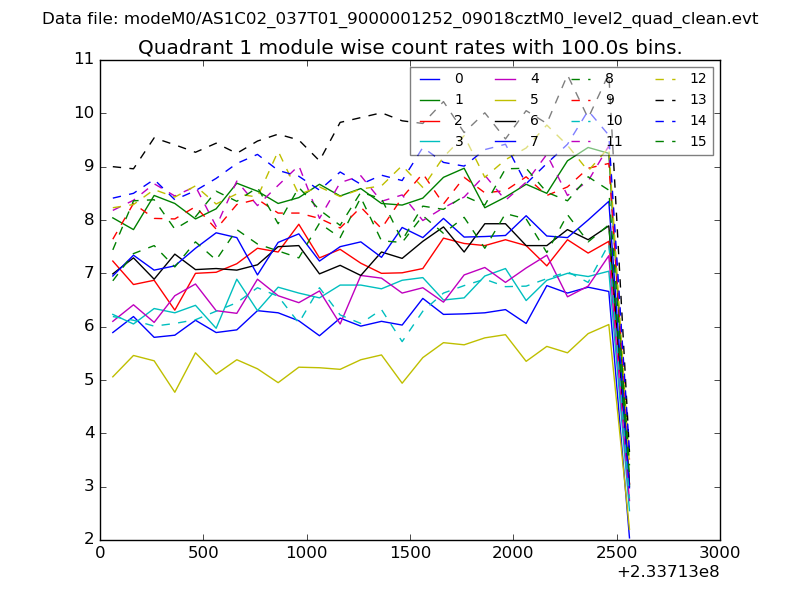 |
 |
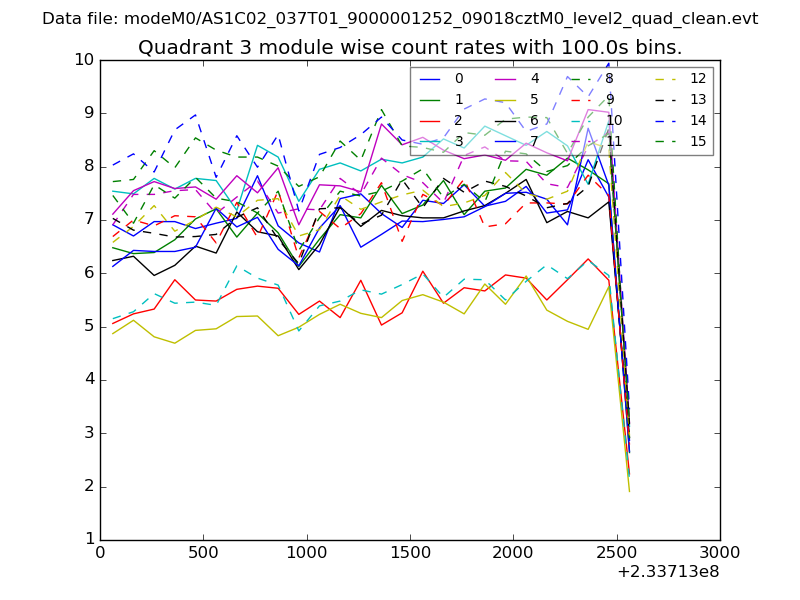
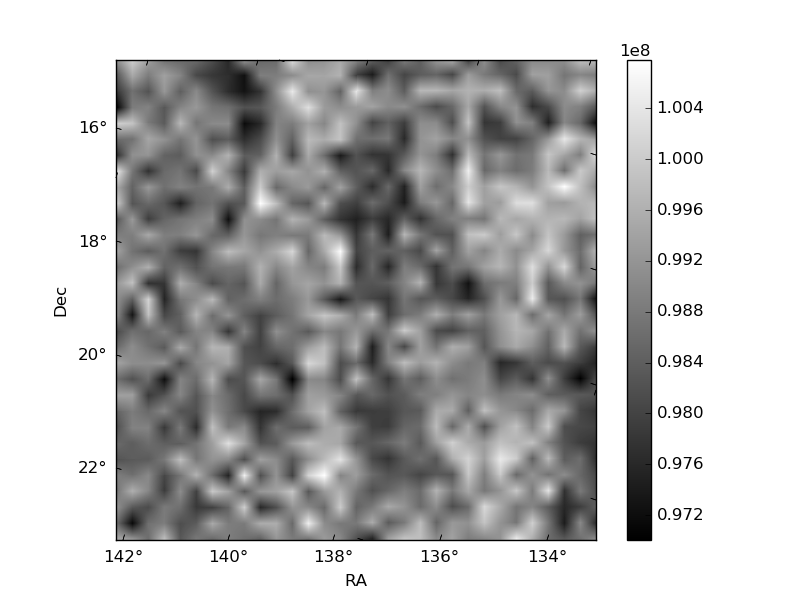
| Module-wise count rates for Quadrant C Data is divided into 100 sec bins |
 |
 |
| Module-wise count rates for Quadrant D Data is divided into 100 sec bins |
 |
 |
| Parameter | Plot |
|---|---|
| CZT HV Monitor | 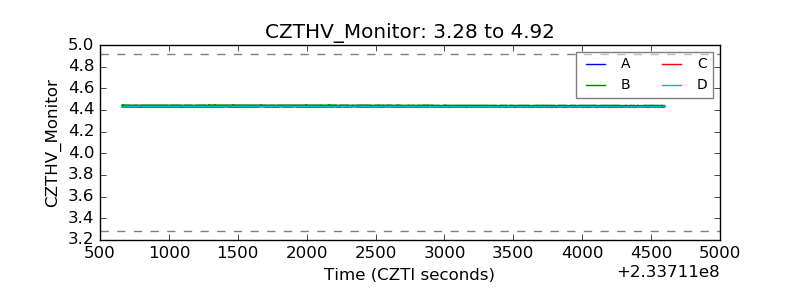 |
| D_VDD | 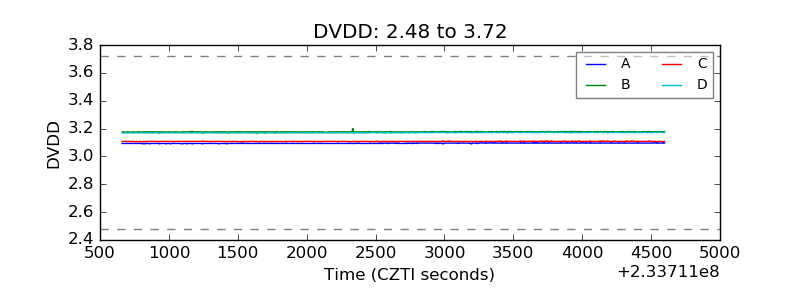 |
| Temperature 1 | 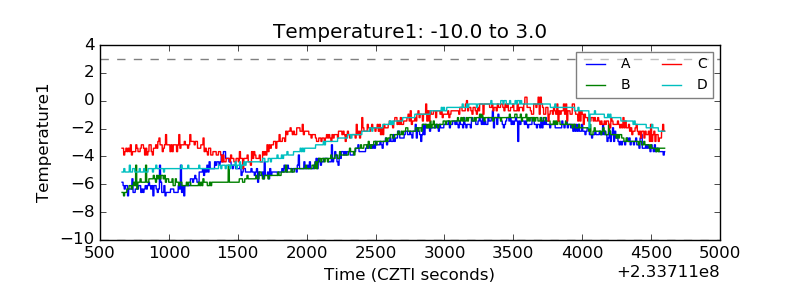 |
| Veto HV Monitor | 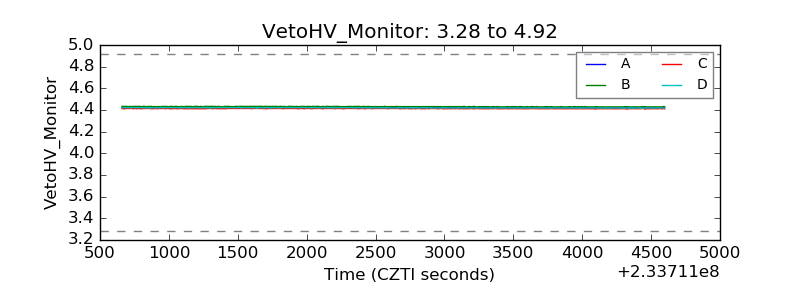 |
| Veto LLD | 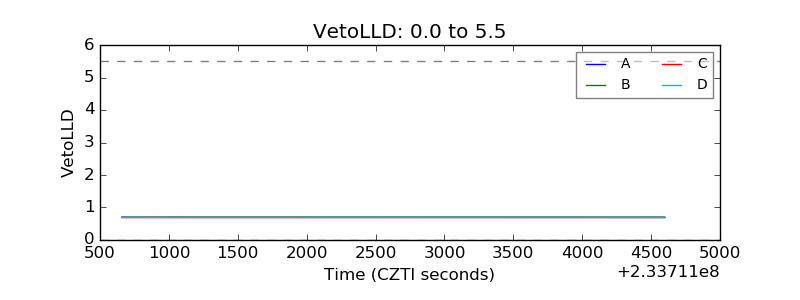 |
| Alpha Counter | 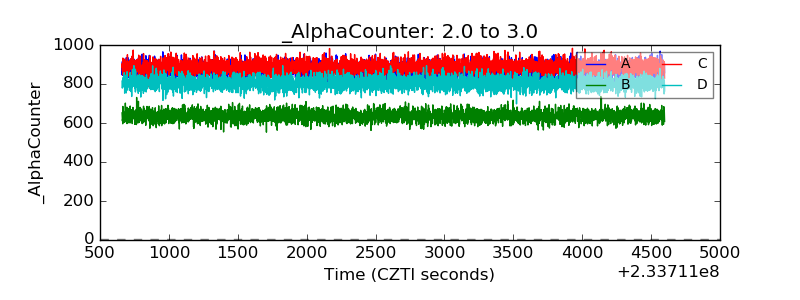 |
| _CPM_Rate | 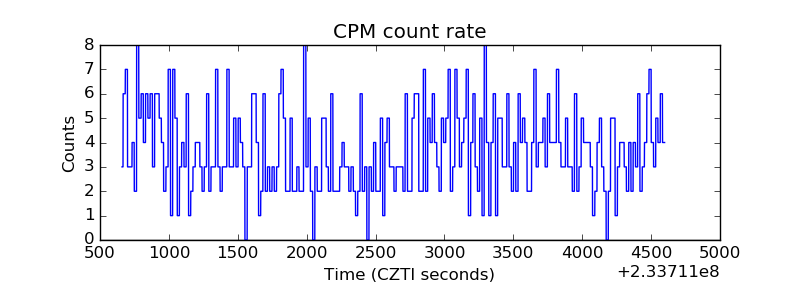 |
| CZT Counter | 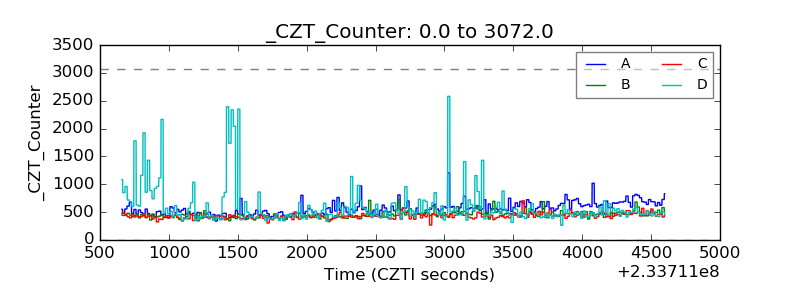 |
| +2.5 Volts monitor |  |
| +5 Volts monitor |  |
| _ROLL_ROT | 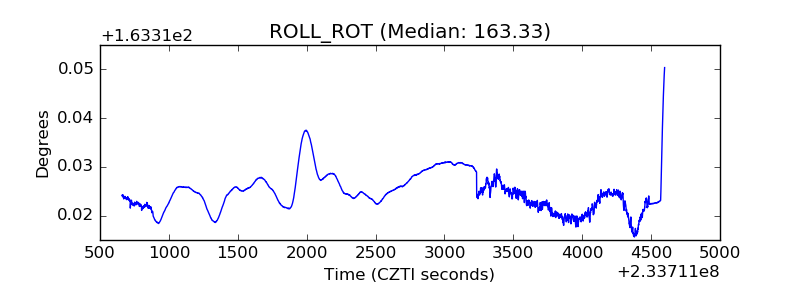 |
| _Roll_DEC | 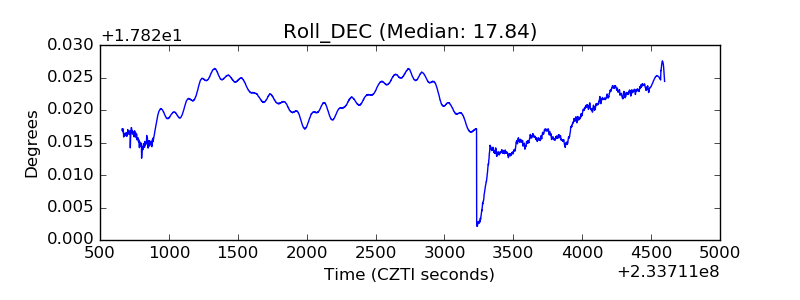 |
| _Roll_RA | 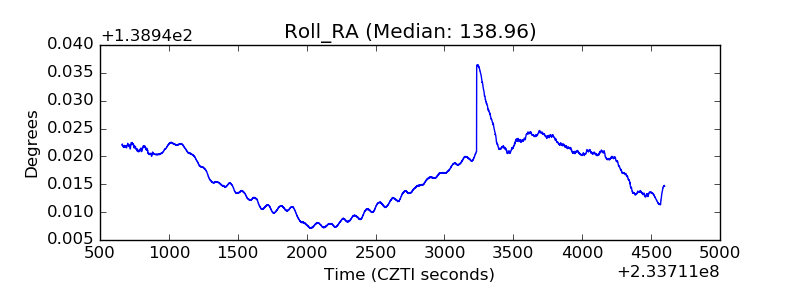 |
| Veto Counter | 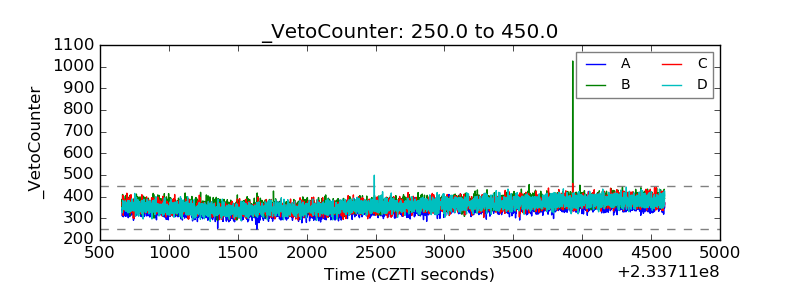 |