| Param | Original file | Final file |
|---|---|---|
| Filename | modeM0/AS1T01_172T01_9000001250cztM0_level2.fits | modeM0/AS1T01_172T01_9000001250cztM0_level2_quad_clean.evt |
| Size (bytes) | 76,348,800 | 73,189,440 |
| Size | 72.8 MB | 69.8 MB |
| Events in quadrant A | 445,452 | 417,676 |
| Events in quadrant B | 437,618 | 417,970 |
| Events in quadrant C | 447,194 | 408,635 |
| Events in quadrant D | 388,932 | 378,170 |
| Mode SS | |||
|---|---|---|---|
| Quadrant | BADHDUFLAG | Total packets | Discarded packets |
| A | 0 | 174 | 0 |
| B | 0 | 174 | 0 |
| C | 0 | 174 | 0 |
| D | 0 | 174 | 0 |
| Mode M9 | |||
|---|---|---|---|
| Quadrant | BADHDUFLAG | Total packets | Discarded packets |
| A | 0 | 5 | 0 |
| B | 0 | 5 | 0 |
| C | 0 | 5 | 0 |
| D | 0 | 5 | 0 |
| Mode M0 | |||
|---|---|---|---|
| Quadrant | BADHDUFLAG | Total packets | Discarded packets |
| A | 0 | 23990 | 0 |
| B | 0 | 17917 | 0 |
| C | 0 | 17288 | 0 |
| D | 0 | 18352 | 0 |
| Quadrant | Total seconds | Saturated seconds | Saturation percentage |
|---|---|---|---|
| A | 8545 | 192 | 2.246928% |
| B | 8545 | 59 | 0.690462% |
| C | 8545 | 31 | 0.362785% |
| D | 8544 | 65 | 0.760768% |
Noise dominated data is calculated using 1-second bins in cleaned event files. If a bin has >2000 counts, and if more than 50% of those come from <1% of pixels, then it is considered to be noise-dominated and hence unusable.
| Quadrant | # 1 sec bins | Bins with >0 counts | Bins with >2000 counts | High rate bins dominated by noise | Noise dominated (total time) | Noise dominated (detector-on time) | Marked lightcurve |
|---|---|---|---|---|---|---|---|
| A | 8876 | 8546 | 0 | 0 | 0.00% | 0.00% | 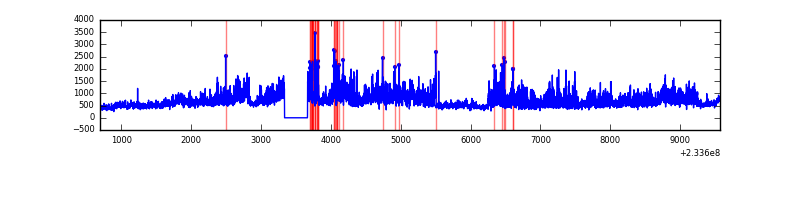 |
| B | 8876 | 8546 | 0 | 0 | 0.00% | 0.00% |  |
| C | 8876 | 8546 | 0 | 0 | 0.00% | 0.00% |  |
| D | 8876 | 8546 | 0 | 0 | 0.00% | 0.00% |  |
Top three noisy pixels from each quadrant. If the there are fewer than three noisy pixels in the level2.evt file, extra rows are filled as -1
| Pixel properties | Quadrant properties | ||||||
|---|---|---|---|---|---|---|---|
| Quadrant | DetID | PixID | Counts | Sigma | Mean | Median | Sigma |
| A | 0 | 29 | 430 | 10.16 | 115 | 108 | 31.7 |
| A | 7 | 110 | 379 | 8.55 | 115 | 108 | 31.7 |
| A | 9 | 19 | 347 | 7.54 | 115 | 108 | 31.7 |
| B | 2 | 9 | 369 | 10.04 | 115 | 110 | 25.8 |
| B | 14 | 254 | 318 | 8.06 | 115 | 110 | 25.8 |
| B | 4 | 227 | 301 | 7.4 | 115 | 110 | 25.8 |
| C | 2 | 191 | 340 | 7.13 | 117 | 109 | 32.4 |
| C | 12 | 241 | 332 | 6.88 | 117 | 109 | 32.4 |
| C | 7 | 203 | 302 | 5.96 | 117 | 109 | 32.4 |
| D | 3 | 14 | 299 | 6.4 | 110 | 100 | 31.1 |
| D | 1 | 3 | 294 | 6.24 | 110 | 100 | 31.1 |
| D | 6 | 231 | 289 | 6.08 | 110 | 100 | 31.1 |
Histogram calculated using DETX and DETY for each event in the final _common_clean file
| Quadrant A |  |
 |
Quadrant B |
|---|---|---|---|
| Quadrant D | 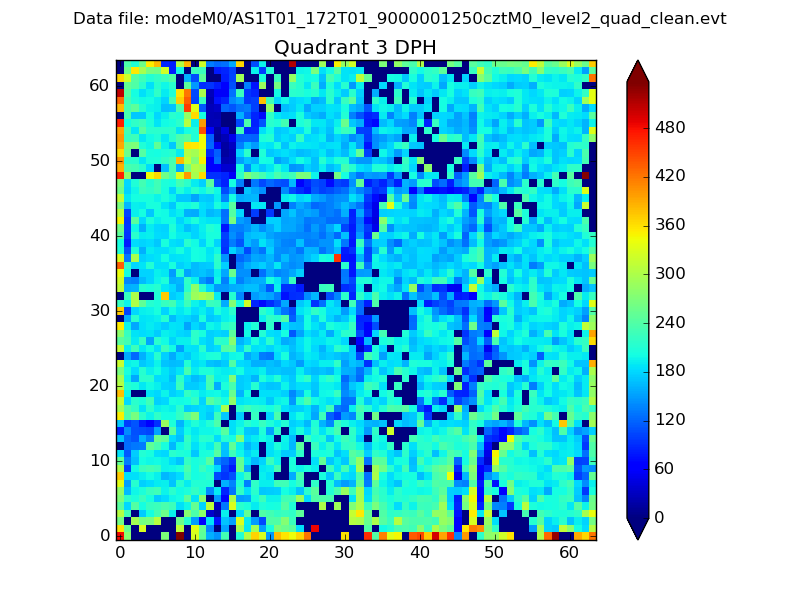 |
 |
Quadrant C |
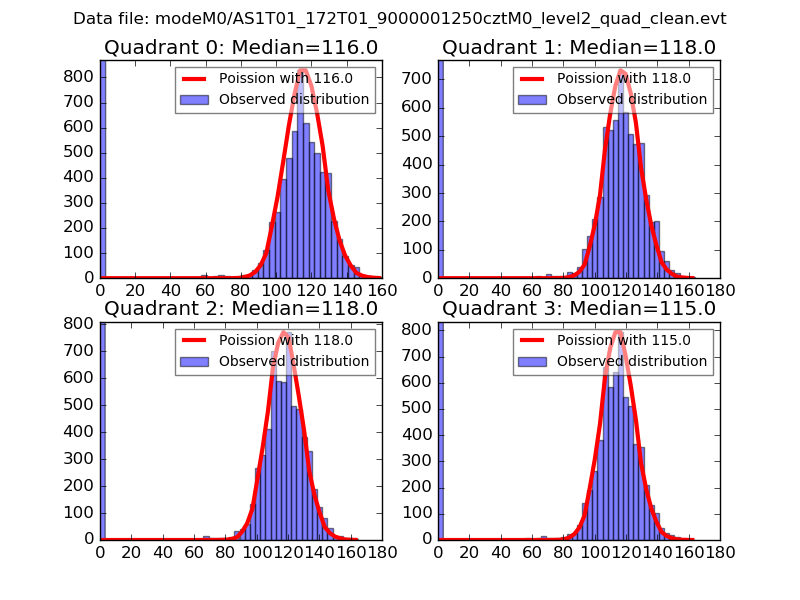
| Plot type | Count rate plots | Images |
|---|---|---|
| Comparison with Poisson distribution Blue bars denote a histogram of data divided into 1 sec bins. Red curve is a Poisson curve with rate = median count rate of data. |
 |
 |
| Quadrant-wise count rates Data is divided into 100 sec bins |
 |
|
| Module-wise count rates for Quadrant A Data is divided into 100 sec bins |
 |
 |
| Module-wise count rates for Quadrant B Data is divided into 100 sec bins |
 |
 |
| Module-wise count rates for Quadrant C Data is divided into 100 sec bins |
 |
 |
| Module-wise count rates for Quadrant D Data is divided into 100 sec bins |
 |
 |
| Parameter | Plot |
|---|---|
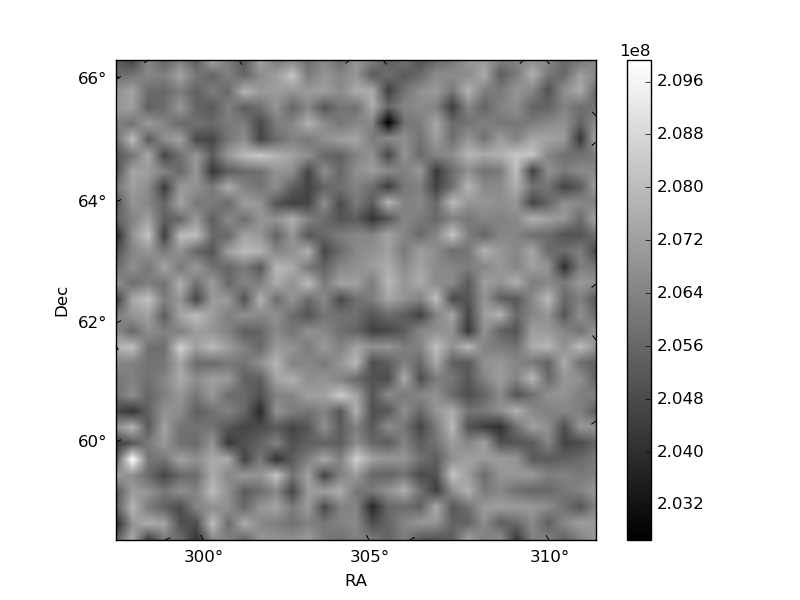
| CZT HV Monitor |  |
| D_VDD | 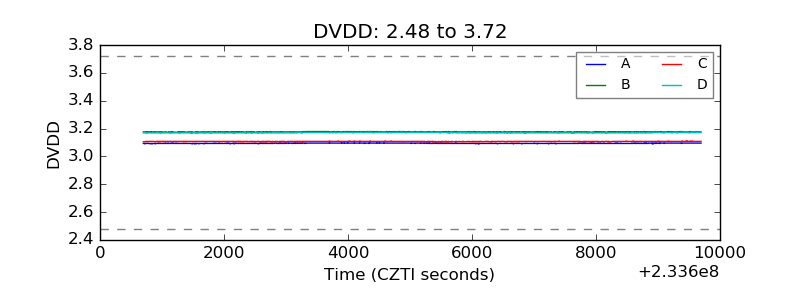 |
| Temperature 1 |  |
| Veto HV Monitor | 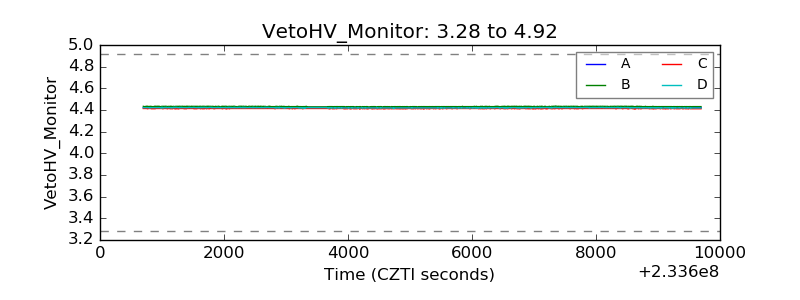 |
| Veto LLD | 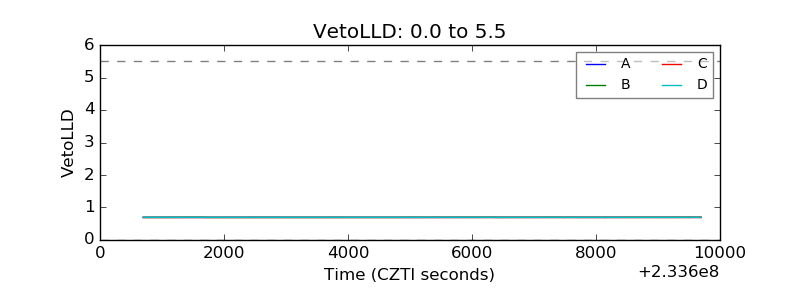 |
| Alpha Counter |  |
| _CPM_Rate |  |
| CZT Counter |  |
| +2.5 Volts monitor |  |
| +5 Volts monitor |  |
| _ROLL_ROT |  |
| _Roll_DEC |  |
| _Roll_RA | 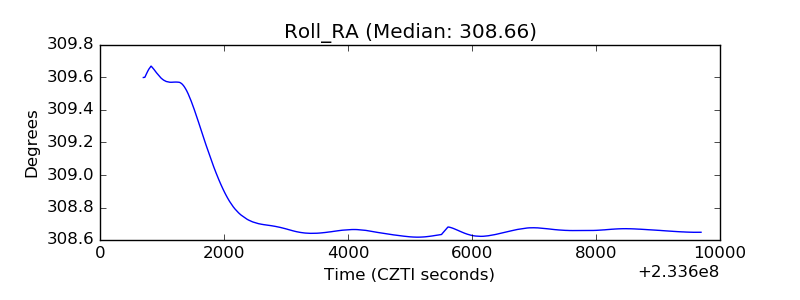 |
| Veto Counter |  |