| Param | Original file | Final file |
|---|---|---|
| Filename | modeM0/AS1G07_029T02_9000001256cztM0_level2.fits | modeM0/AS1G07_029T02_9000001256cztM0_level2_quad_clean.evt |
| Size (bytes) | 145,843,200 | 155,848,320 |
| Size | 139.1 MB | 148.6 MB |
| Events in quadrant A | 855,092 | 927,942 |
| Events in quadrant B | 833,338 | 934,236 |
| Events in quadrant C | 858,864 | 898,405 |
| Events in quadrant D | 735,372 | 824,557 |
| Mode SS | |||
|---|---|---|---|
| Quadrant | BADHDUFLAG | Total packets | Discarded packets |
| A | 0 | 330 | 0 |
| B | 0 | 332 | 0 |
| C | 0 | 332 | 0 |
| D | 0 | 330 | 0 |
| Mode M9 | |||
|---|---|---|---|
| Quadrant | BADHDUFLAG | Total packets | Discarded packets |
| A | 0 | 12 | 0 |
| B | 0 | 12 | 0 |
| C | 0 | 12 | 0 |
| D | 0 | 12 | 0 |
| Mode M0 | |||
|---|---|---|---|
| Quadrant | BADHDUFLAG | Total packets | Discarded packets |
| A | 0 | 44870 | 0 |
| B | 0 | 36723 | 0 |
| C | 0 | 33331 | 0 |
| D | 0 | 37623 | 0 |
| Quadrant | Total seconds | Saturated seconds | Saturation percentage |
|---|---|---|---|
| A | 16440 | 394 | 2.396594% |
| B | 16453 | 239 | 1.452623% |
| C | 16453 | 46 | 0.279584% |
| D | 16456 | 220 | 1.336898% |
Noise dominated data is calculated using 1-second bins in cleaned event files. If a bin has >2000 counts, and if more than 50% of those come from <1% of pixels, then it is considered to be noise-dominated and hence unusable.
| Quadrant | # 1 sec bins | Bins with >0 counts | Bins with >2000 counts | High rate bins dominated by noise | Noise dominated (total time) | Noise dominated (detector-on time) | Marked lightcurve |
|---|---|---|---|---|---|---|---|
| A | 17677 | 16524 | 0 | 0 | 0.00% | 0.00% |  |
| B | 17677 | 16525 | 0 | 0 | 0.00% | 0.00% |  |
| C | 17677 | 16531 | 0 | 0 | 0.00% | 0.00% |  |
| D | 17677 | 16527 | 0 | 0 | 0.00% | 0.00% |  |
Top three noisy pixels from each quadrant. If the there are fewer than three noisy pixels in the level2.evt file, extra rows are filled as -1
| Pixel properties | Quadrant properties | ||||||
|---|---|---|---|---|---|---|---|
| Quadrant | DetID | PixID | Counts | Sigma | Mean | Median | Sigma |
| A | 0 | 29 | 850 | 10.81 | 222 | 208 | 59.4 |
| A | 7 | 110 | 728 | 8.75 | 222 | 208 | 59.4 |
| A | 0 | 30 | 643 | 7.32 | 222 | 208 | 59.4 |
| B | 2 | 9 | 733 | 11.28 | 220 | 209 | 46.4 |
| B | 3 | 17 | 576 | 7.9 | 220 | 209 | 46.4 |
| B | 5 | 232 | 569 | 7.75 | 220 | 209 | 46.4 |
| C | 1 | 81 | 666 | 7.39 | 226 | 210 | 61.7 |
| C | 12 | 241 | 640 | 6.97 | 226 | 210 | 61.7 |
| C | 1 | 80 | 632 | 6.84 | 226 | 210 | 61.7 |
| D | 7 | 5 | 551 | 6.14 | 210 | 190 | 58.8 |
| D | 1 | 19 | 529 | 5.77 | 210 | 190 | 58.8 |
| D | 11 | 82 | 524 | 5.68 | 210 | 190 | 58.8 |
Histogram calculated using DETX and DETY for each event in the final _common_clean file
| Quadrant A | 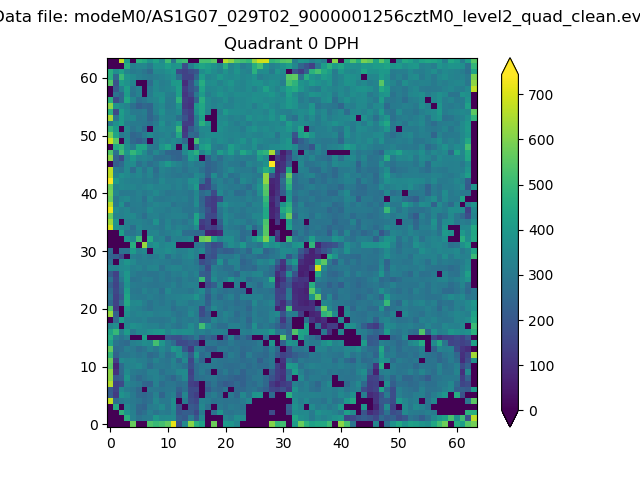 |
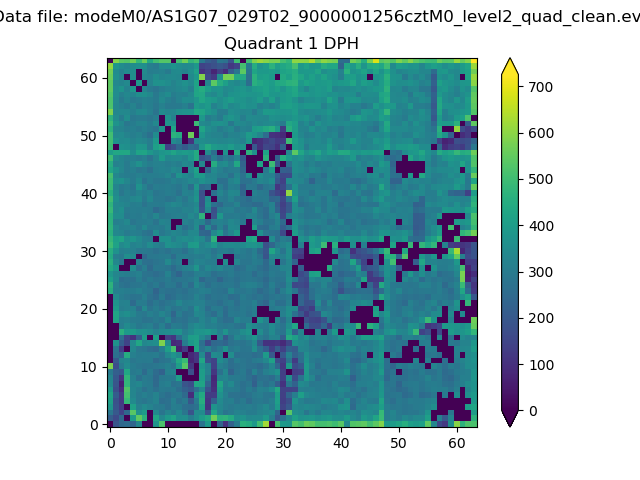 |
Quadrant B |
|---|---|---|---|
| Quadrant D | 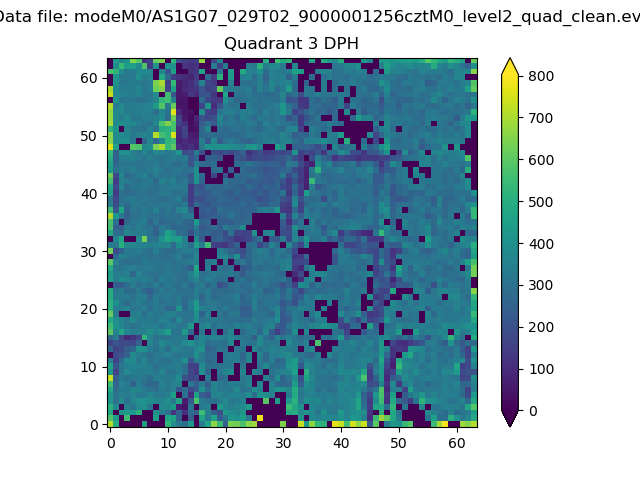 |
 |
Quadrant C |
| Plot type | Count rate plots | Images |
|---|---|---|
| Comparison with Poisson distribution Blue bars denote a histogram of data divided into 1 sec bins. Red curve is a Poisson curve with rate = median count rate of data. |
 |
 |
| Quadrant-wise count rates Data is divided into 100 sec bins |
 |
|
| Module-wise count rates for Quadrant A Data is divided into 100 sec bins |
 |
 |
| Module-wise count rates for Quadrant B Data is divided into 100 sec bins |
 |
 |
| Module-wise count rates for Quadrant C Data is divided into 100 sec bins |
 |
 |
| Module-wise count rates for Quadrant D Data is divided into 100 sec bins |
 |
 |
| Parameter | Plot |
|---|---|
| CZT HV Monitor |  |
| D_VDD |  |
| Temperature 1 |  |
| Veto HV Monitor |  |
| Veto LLD |  |
| Alpha Counter |  |
| _CPM_Rate |  |
| CZT Counter |  |
| +2.5 Volts monitor |  |
| +5 Volts monitor |  |
| _ROLL_ROT |  |
| _Roll_DEC |  |
| _Roll_RA |  |
| Veto Counter |  |