| Param | Original file | Final file |
|---|---|---|
| Filename | modeM0/AS1G07_029T02_9000001256_09020cztM0_level2.evt | modeM0/AS1G07_029T02_9000001256_09020cztM0_level2_quad_clean.evt |
| Size (bytes) | 546,007,680 | 99,570,240 |
| Size | 520.7 MB | 95.0 MB |
| Events in quadrant A | 5,442,115 | 629,300 |
| Events in quadrant B | 3,556,345 | 647,445 |
| Events in quadrant C | 3,192,153 | 634,056 |
| Events in quadrant D | 3,867,847 | 614,360 |
| Mode SS | |||
|---|---|---|---|
| Quadrant | BADHDUFLAG | Total packets | Discarded packets |
| A | 0 | 142 | 0 |
| B | 0 | 142 | 0 |
| C | 0 | 142 | 0 |
| D | 0 | 142 | 0 |
| Mode M9 | |||
|---|---|---|---|
| Quadrant | BADHDUFLAG | Total packets | Discarded packets |
| A | 0 | 6 | 0 |
| B | 0 | 6 | 0 |
| C | 0 | 6 | 0 |
| D | 0 | 6 | 0 |
| Mode M0 | |||
|---|---|---|---|
| Quadrant | BADHDUFLAG | Total packets | Discarded packets |
| A | 0 | 20967 | 2 |
| B | 0 | 15041 | 1 |
| C | 0 | 14454 | 1 |
| D | 0 | 16175 | 1 |
| Quadrant | Total seconds | Saturated seconds | Saturation percentage |
|---|---|---|---|
| A | 7041 | 398 | 5.652606% |
| B | 7041 | 147 | 2.087772% |
| C | 7041 | 96 | 1.363443% |
| D | 7041 | 164 | 2.329215% |
Noise dominated data is calculated using 1-second bins in cleaned event files. If a bin has >2000 counts, and if more than 50% of those come from <1% of pixels, then it is considered to be noise-dominated and hence unusable.
| Quadrant | # 1 sec bins | Bins with >0 counts | Bins with >2000 counts | High rate bins dominated by noise | Noise dominated (total time) | Noise dominated (detector-on time) | Marked lightcurve |
|---|---|---|---|---|---|---|---|
| A | 7601 | 7041 | 111 | 111 | 1.46% | 1.58% | 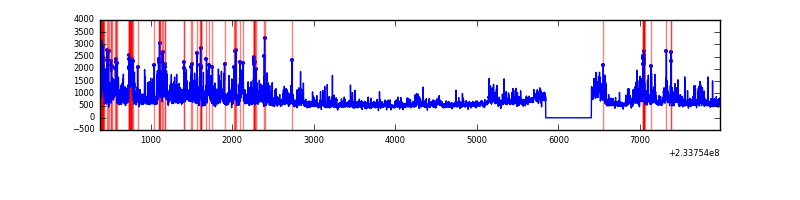 |
| B | 7601 | 7042 | 9 | 9 | 0.12% | 0.13% | 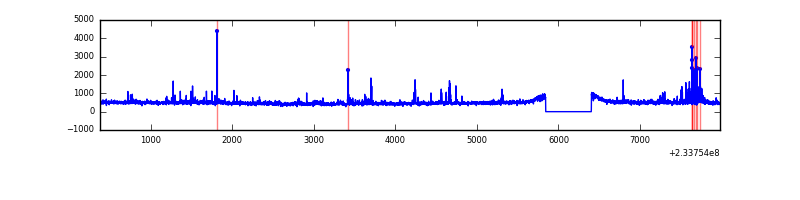 |
| C | 7601 | 7041 | 0 | 0 | 0.00% | 0.00% | 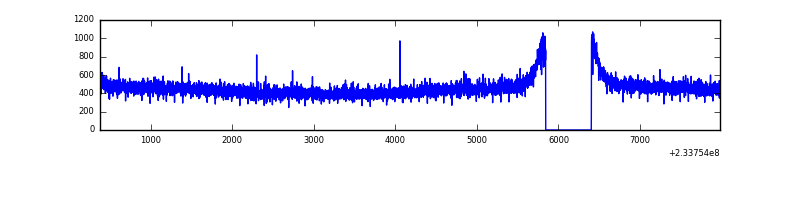 |
| D | 7601 | 7041 | 36 | 36 | 0.47% | 0.51% | 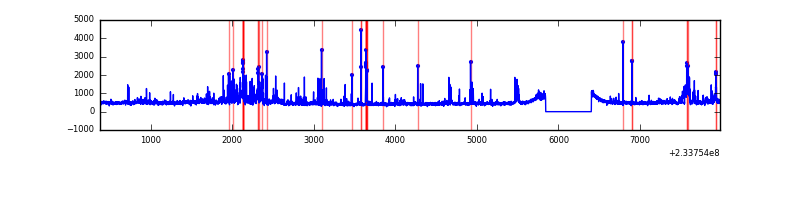 |
Top three noisy pixels from each quadrant. If the there are fewer than three noisy pixels in the level2.evt file, extra rows are filled as -1
| Pixel properties | Quadrant properties | ||||||
|---|---|---|---|---|---|---|---|
| Quadrant | DetID | PixID | Counts | Sigma | Mean | Median | Sigma |
| A | 8 | 5 | 1979132 | 11602.18 | 835 | 817 | 170.5 |
| A | 15 | 239 | 81743 | 474.6 | 835 | 817 | 170.5 |
| A | 1 | 162 | 74955 | 434.8 | 835 | 817 | 170.5 |
| B | 4 | 80 | 75128 | 459.03 | 840 | 821 | 161.9 |
| B | 6 | 51 | 49279 | 299.35 | 840 | 821 | 161.9 |
| B | 0 | 214 | 47898 | 290.82 | 840 | 821 | 161.9 |
| C | 13 | 61 | 6211 | 28.21 | 816 | 822 | 191.1 |
| C | 8 | 128 | 4878 | 21.23 | 816 | 822 | 191.1 |
| C | 8 | 112 | 2769 | 10.19 | 816 | 822 | 191.1 |
| D | 6 | 225 | 347927 | 1632.66 | 818 | 796 | 212.6 |
| D | 7 | 71 | 108173 | 505.03 | 818 | 796 | 212.6 |
| D | 12 | 233 | 98565 | 459.84 | 818 | 796 | 212.6 |
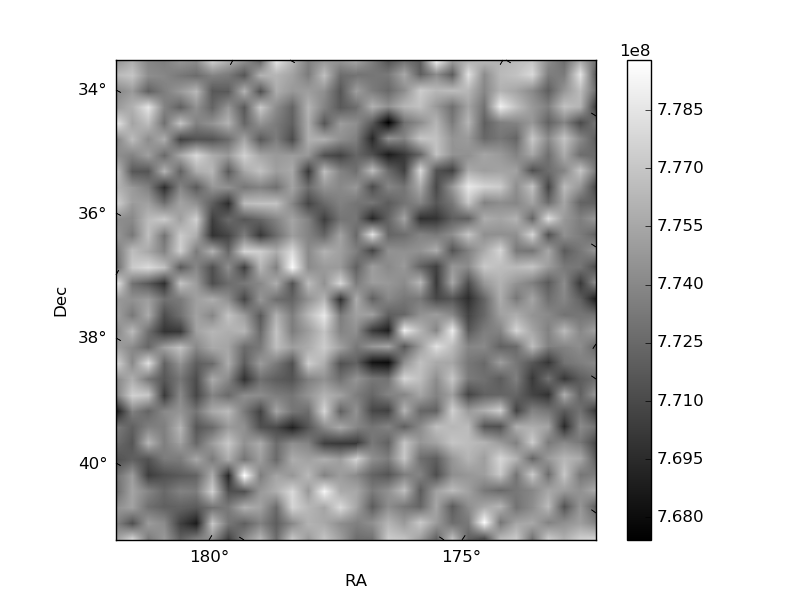
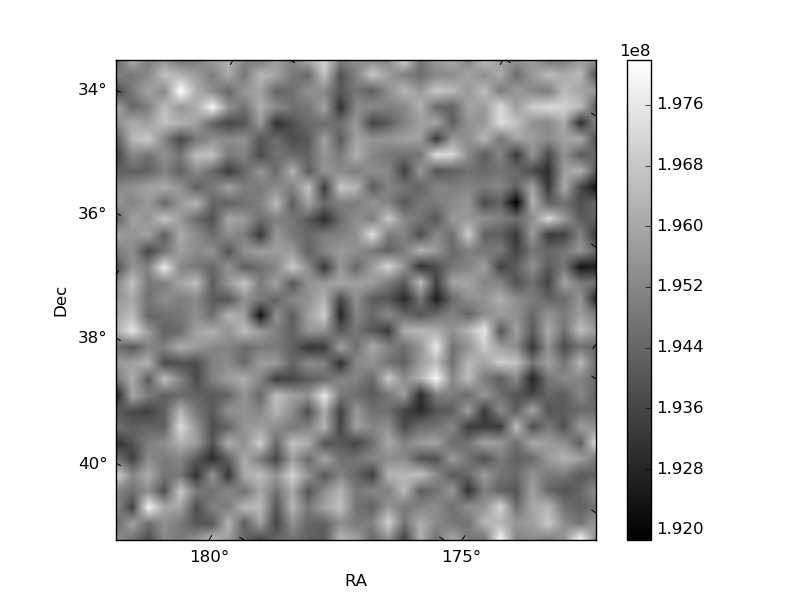
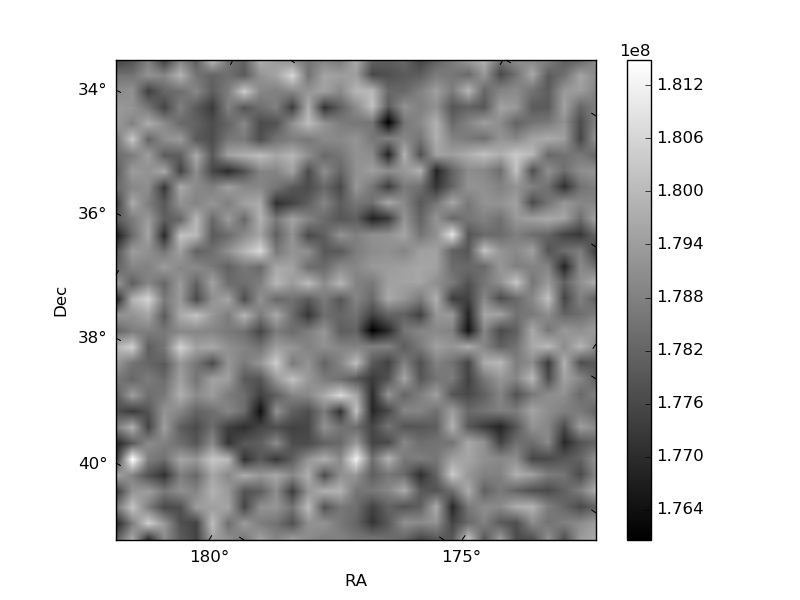
Histogram calculated using DETX and DETY for each event in the final _common_clean file
| Quadrant A | 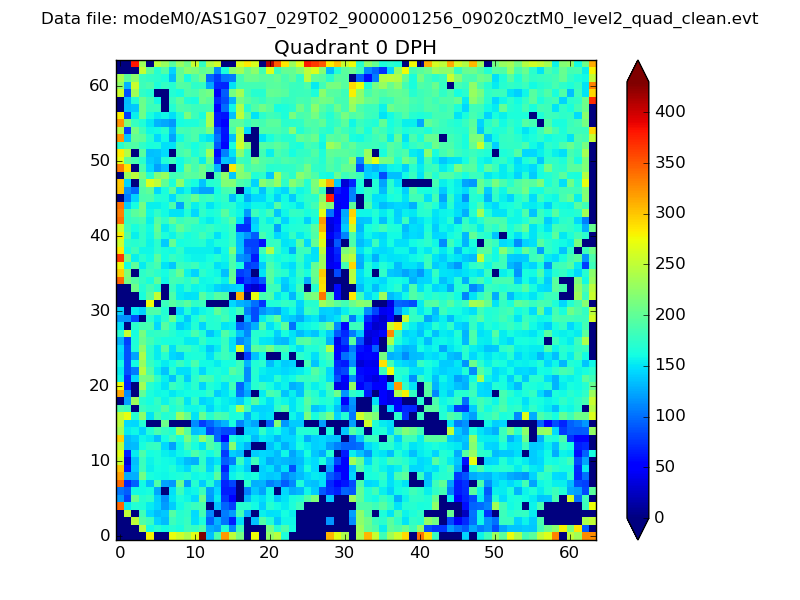 |
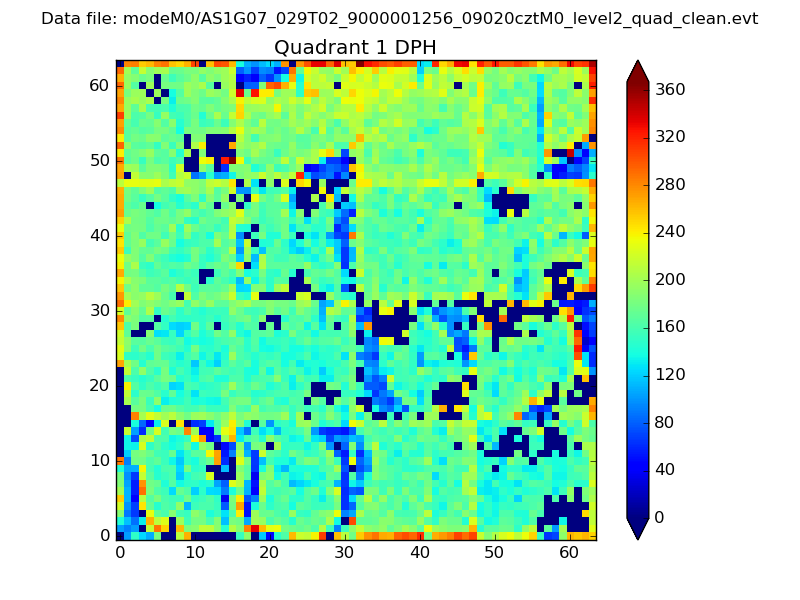 |
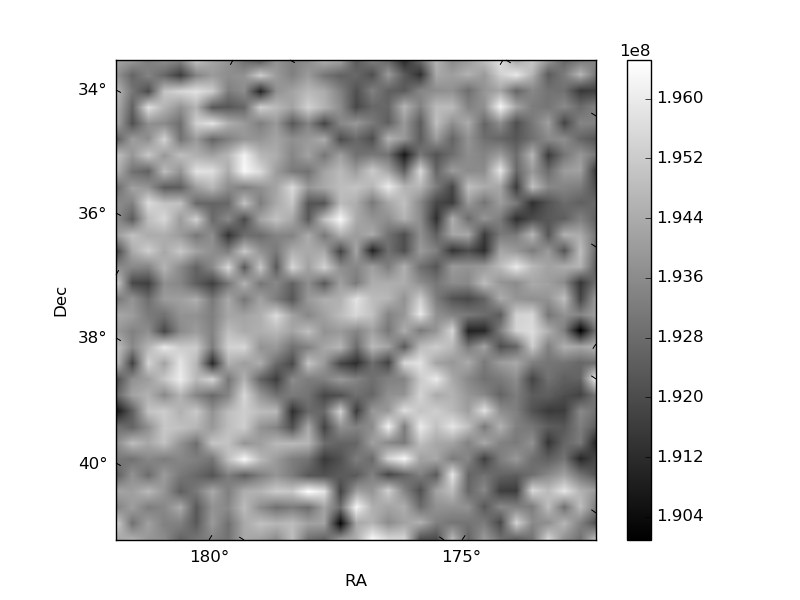
Quadrant B |
|---|---|---|---|
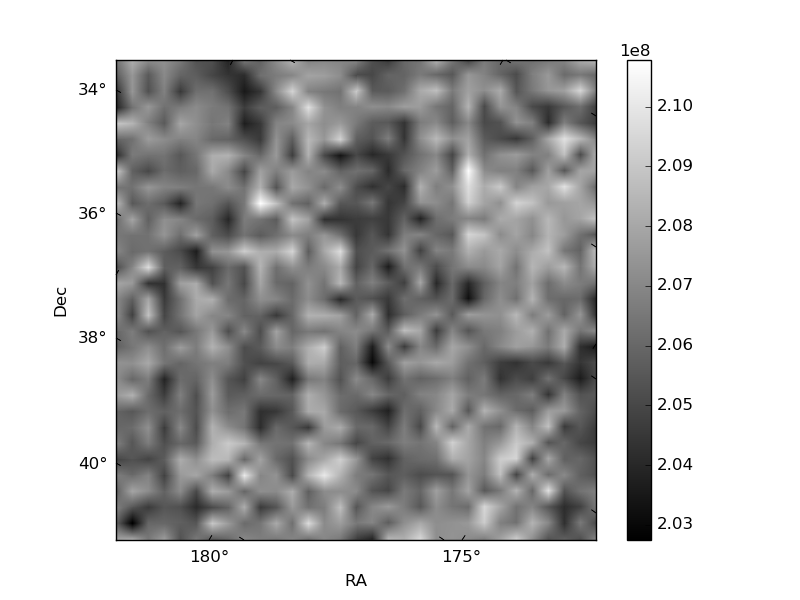
| Quadrant D | 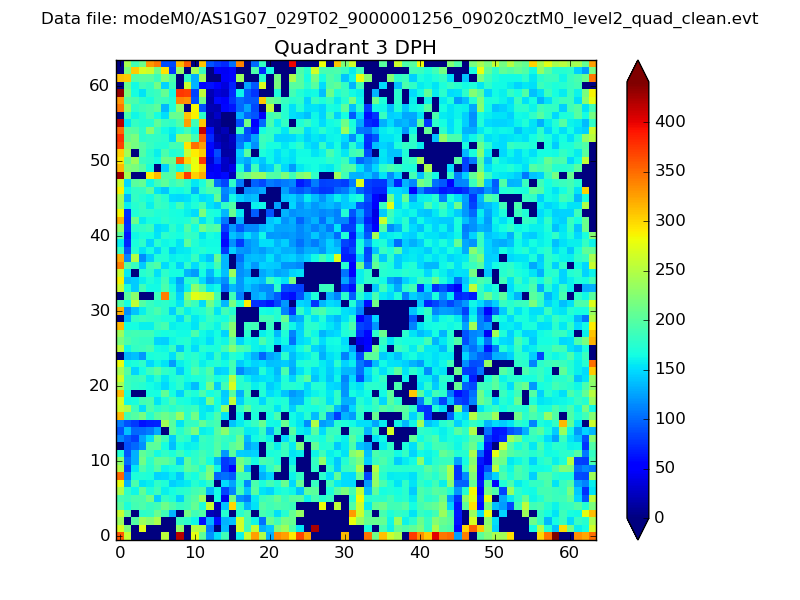 |
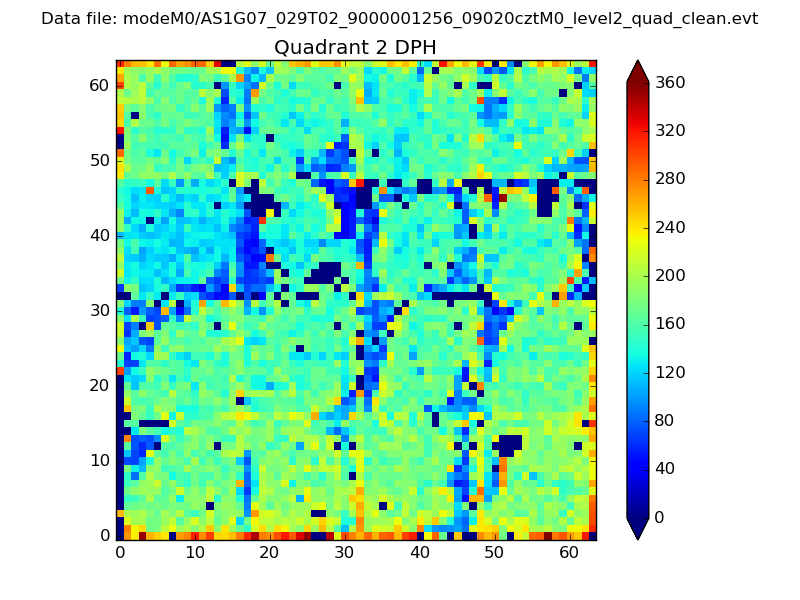 |
Quadrant C |
| Plot type | Count rate plots | Images |
|---|---|---|
| Comparison with Poisson distribution Blue bars denote a histogram of data divided into 1 sec bins. Red curve is a Poisson curve with rate = median count rate of data. |
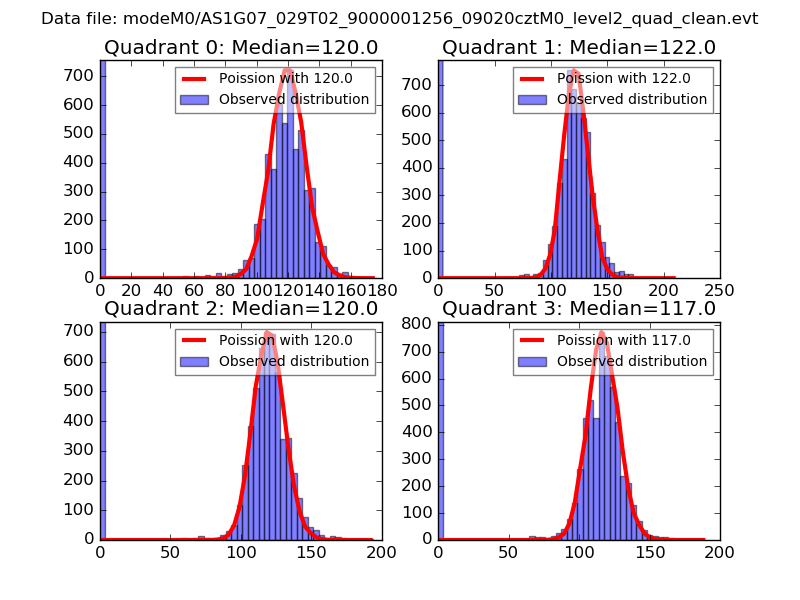 |
 |
| Quadrant-wise count rates Data is divided into 100 sec bins |
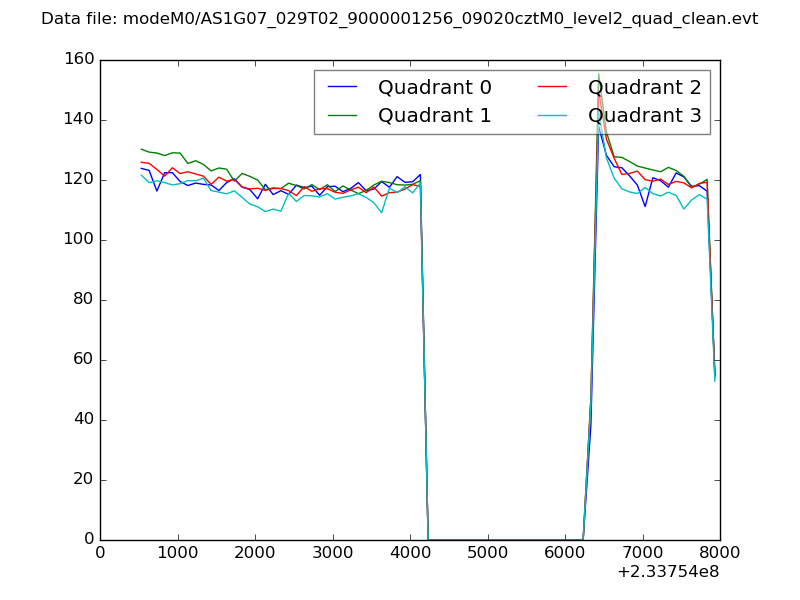 |
|
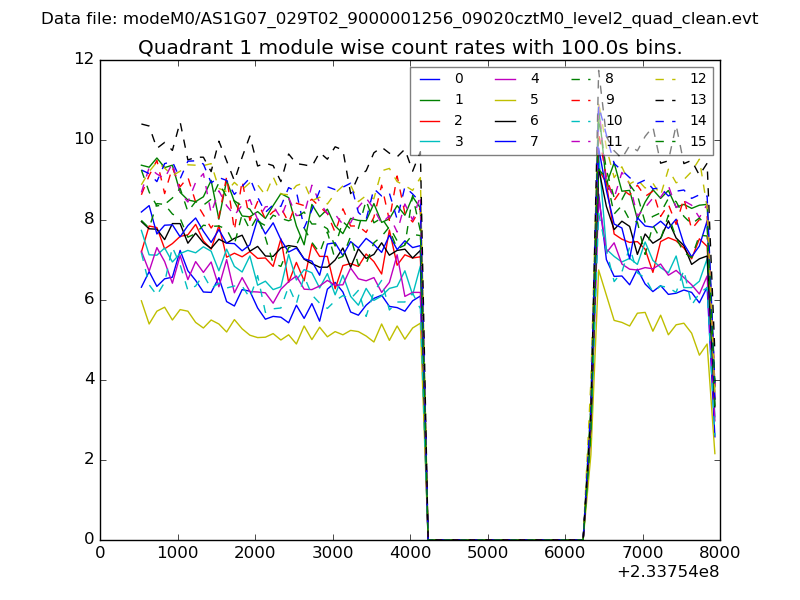
| Module-wise count rates for Quadrant A Data is divided into 100 sec bins |
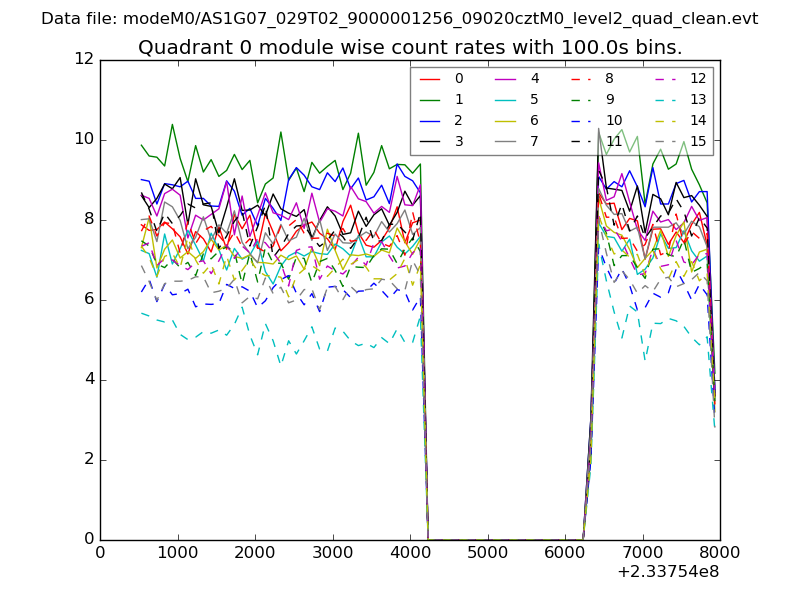 |
 |
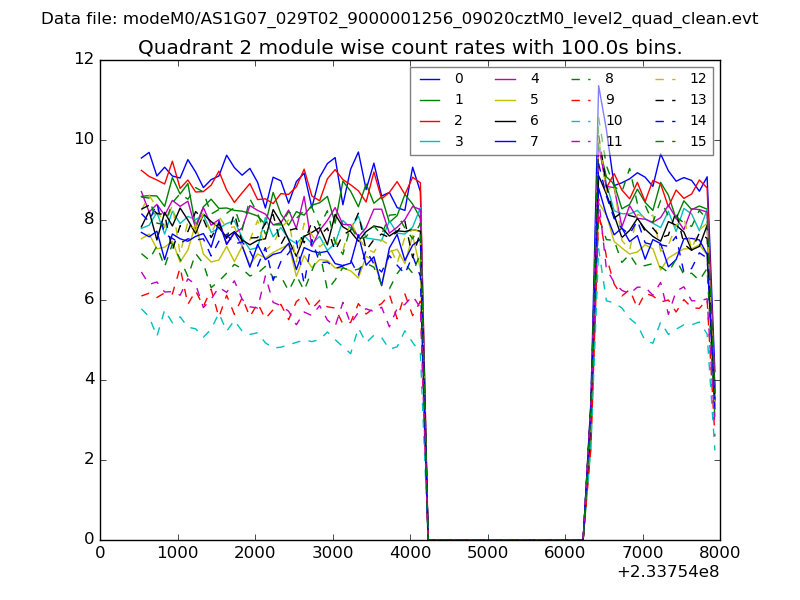
| Module-wise count rates for Quadrant B Data is divided into 100 sec bins |
 |
 |
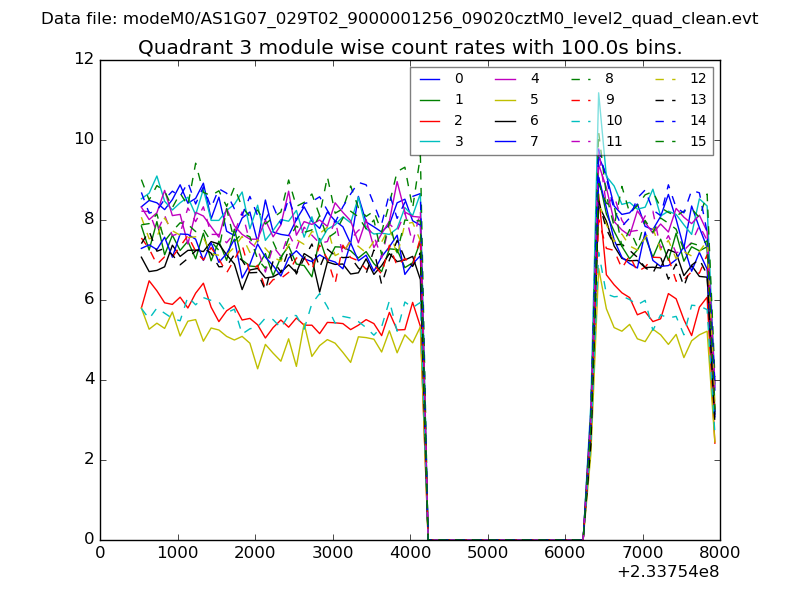
| Module-wise count rates for Quadrant C Data is divided into 100 sec bins |
 |
 |
| Module-wise count rates for Quadrant D Data is divided into 100 sec bins |
 |
 |
| Parameter | Plot |
|---|---|
| CZT HV Monitor | 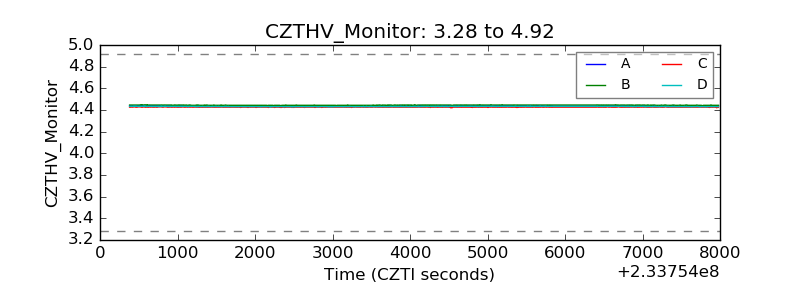 |
| D_VDD | 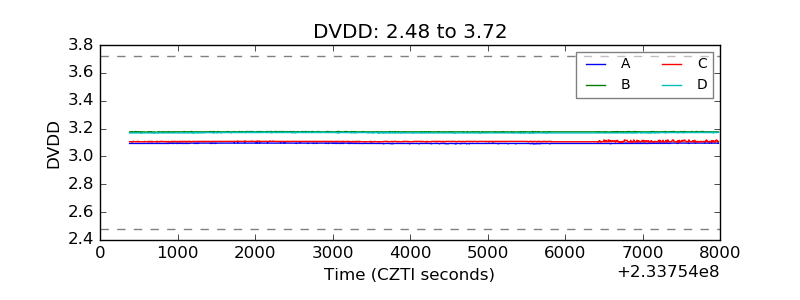 |
| Temperature 1 | 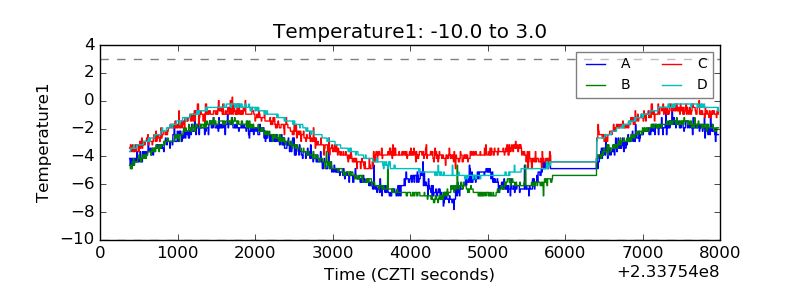 |
| Veto HV Monitor |  |
| Veto LLD | 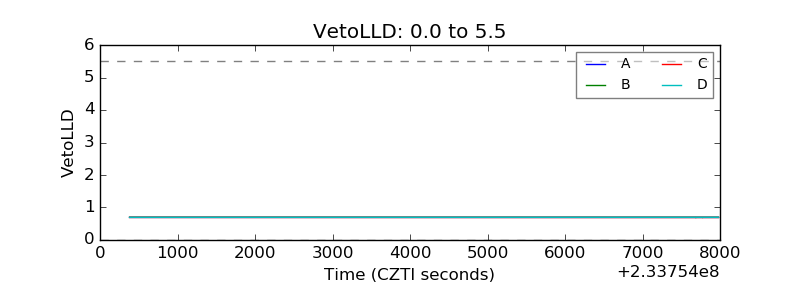 |
| Alpha Counter | 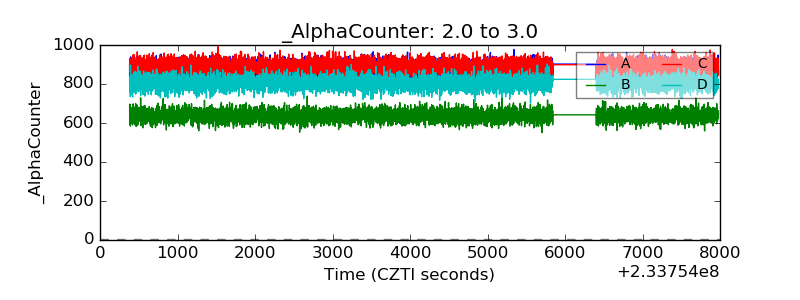 |
| _CPM_Rate | 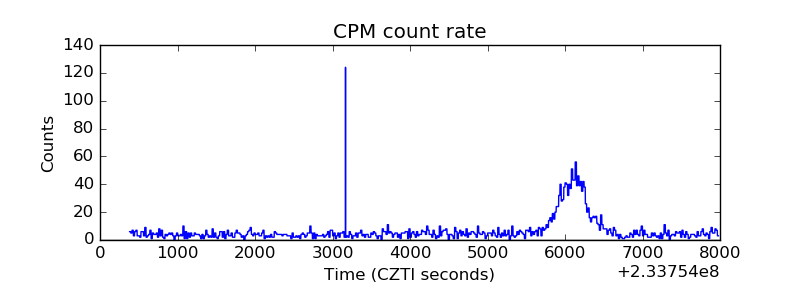 |
| CZT Counter | 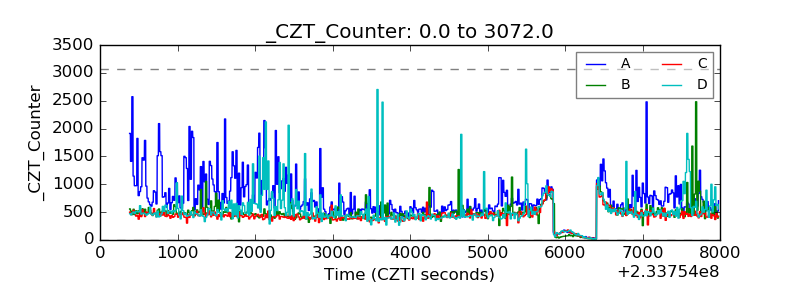 |
| +2.5 Volts monitor |  |
| +5 Volts monitor | 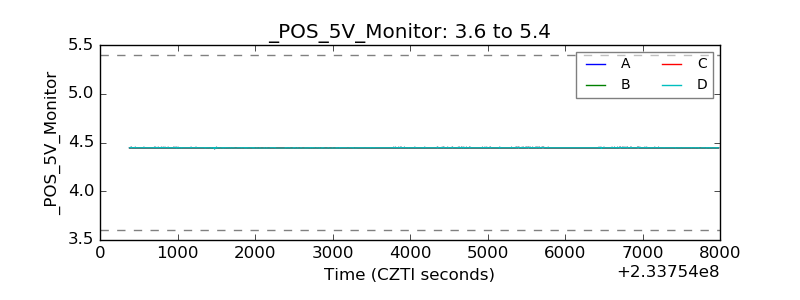 |
| _ROLL_ROT |  |
| _Roll_DEC | 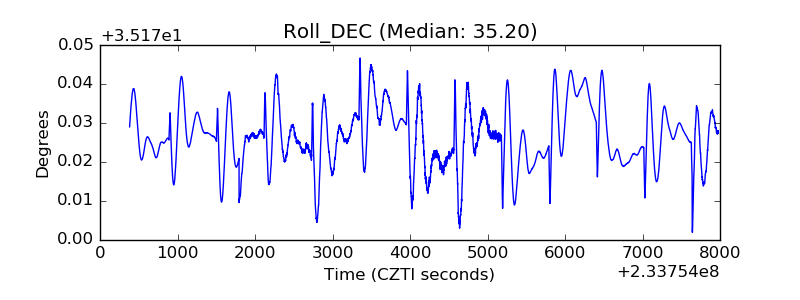 |
| _Roll_RA | 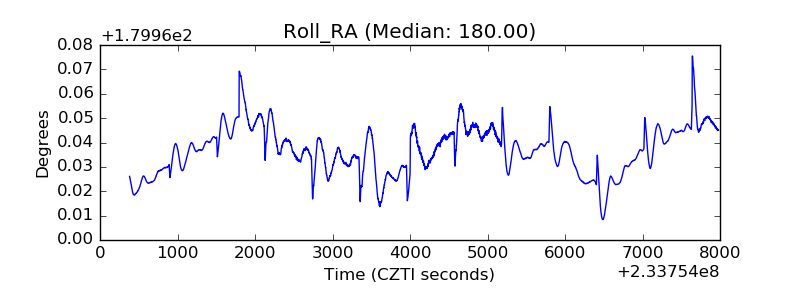 |
| Veto Counter | 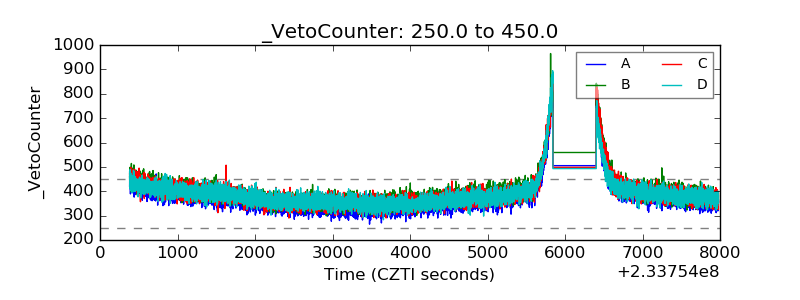 |