| Param | Original file | Final file |
|---|---|---|
| Filename | modeM0/AS1G07_029T02_9000001256_09021cztM0_level2.evt | modeM0/AS1G07_029T02_9000001256_09021cztM0_level2_quad_clean.evt |
| Size (bytes) | 552,291,840 | 86,806,080 |
| Size | 526.7 MB | 82.8 MB |
| Events in quadrant A | 6,104,418 | 524,932 |
| Events in quadrant B | 3,437,400 | 557,635 |
| Events in quadrant C | 3,052,940 | 545,817 |
| Events in quadrant D | 3,674,513 | 530,356 |
| Mode SS | |||
|---|---|---|---|
| Quadrant | BADHDUFLAG | Total packets | Discarded packets |
| A | 0 | 136 | 0 |
| B | 0 | 136 | 0 |
| C | 0 | 136 | 0 |
| D | 0 | 136 | 0 |
| Mode M9 | |||
|---|---|---|---|
| Quadrant | BADHDUFLAG | Total packets | Discarded packets |
| A | 0 | 2 | 0 |
| B | 0 | 2 | 0 |
| C | 0 | 2 | 0 |
| D | 0 | 2 | 0 |
| Mode M0 | |||
|---|---|---|---|
| Quadrant | BADHDUFLAG | Total packets | Discarded packets |
| A | 0 | 22939 | 2 |
| B | 0 | 14594 | 1 |
| C | 0 | 13933 | 1 |
| D | 0 | 15495 | 1 |
| Quadrant | Total seconds | Saturated seconds | Saturation percentage |
|---|---|---|---|
| A | 6742 | 778 | 11.539602% |
| B | 6742 | 104 | 1.542569% |
| C | 6742 | 49 | 0.726787% |
| D | 6742 | 112 | 1.661228% |
Noise dominated data is calculated using 1-second bins in cleaned event files. If a bin has >2000 counts, and if more than 50% of those come from <1% of pixels, then it is considered to be noise-dominated and hence unusable.
| Quadrant | # 1 sec bins | Bins with >0 counts | Bins with >2000 counts | High rate bins dominated by noise | Noise dominated (total time) | Noise dominated (detector-on time) | Marked lightcurve |
|---|---|---|---|---|---|---|---|
| A | 6967 | 6743 | 431 | 431 | 6.19% | 6.39% | 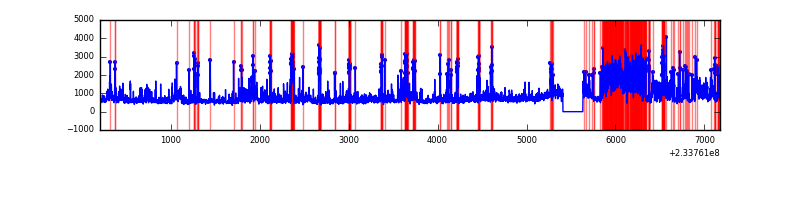 |
| B | 6967 | 6743 | 11 | 11 | 0.16% | 0.16% | 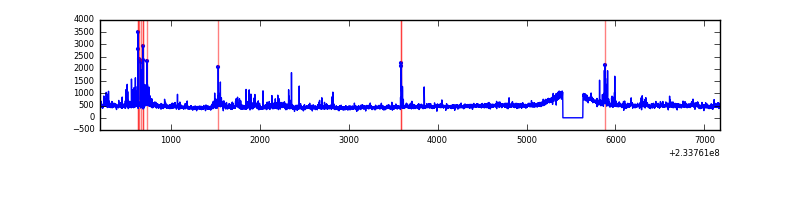 |
| C | 6967 | 6743 | 0 | 0 | 0.00% | 0.00% | 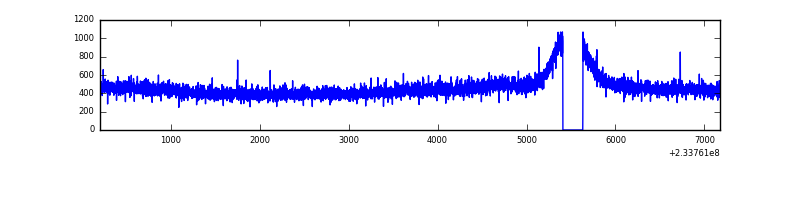 |
| D | 6967 | 6743 | 44 | 44 | 0.63% | 0.65% | 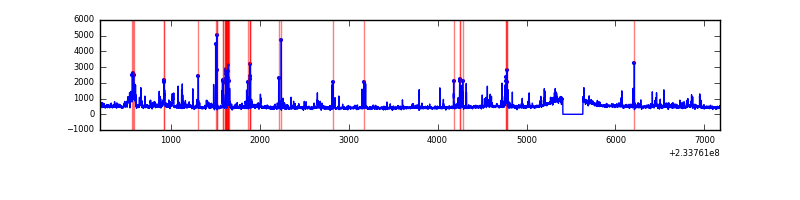 |
Top three noisy pixels from each quadrant. If the there are fewer than three noisy pixels in the level2.evt file, extra rows are filled as -1
| Pixel properties | Quadrant properties | ||||||
|---|---|---|---|---|---|---|---|
| Quadrant | DetID | PixID | Counts | Sigma | Mean | Median | Sigma |
| A | 8 | 5 | 2835657 | 17600.83 | 783 | 765 | 161.1 |
| A | 1 | 162 | 112512 | 693.79 | 783 | 765 | 161.1 |
| A | 5 | 16 | 39894 | 242.93 | 783 | 765 | 161.1 |
| B | 4 | 48 | 69398 | 443.04 | 802 | 782 | 154.9 |
| B | 4 | 80 | 62762 | 400.19 | 802 | 782 | 154.9 |
| B | 0 | 214 | 44066 | 279.47 | 802 | 782 | 154.9 |
| C | 8 | 128 | 9919 | 50.06 | 778 | 781 | 182.5 |
| C | 13 | 61 | 5902 | 28.05 | 778 | 781 | 182.5 |
| C | 8 | 112 | 5782 | 27.4 | 778 | 781 | 182.5 |
| D | 6 | 225 | 195159 | 946.29 | 778 | 756 | 205.4 |
| D | 7 | 71 | 171971 | 833.41 | 778 | 756 | 205.4 |
| D | 13 | 104 | 108292 | 523.45 | 778 | 756 | 205.4 |
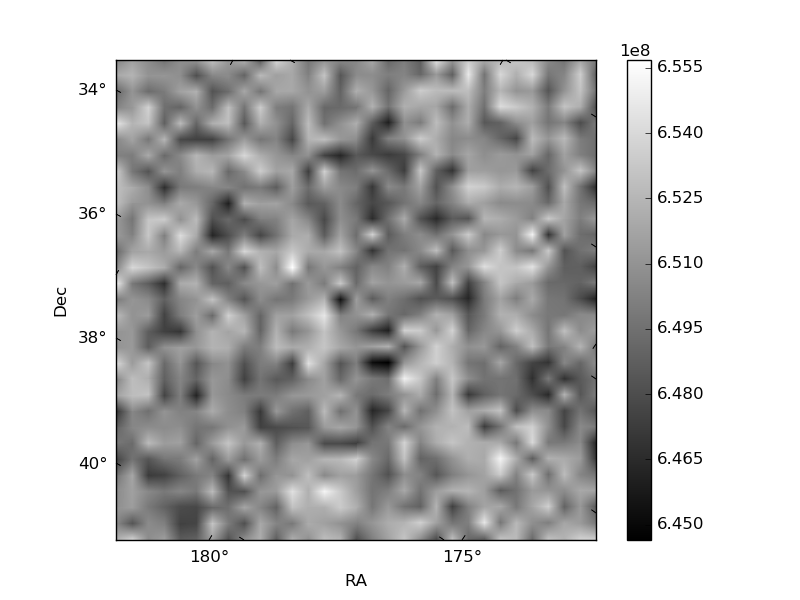
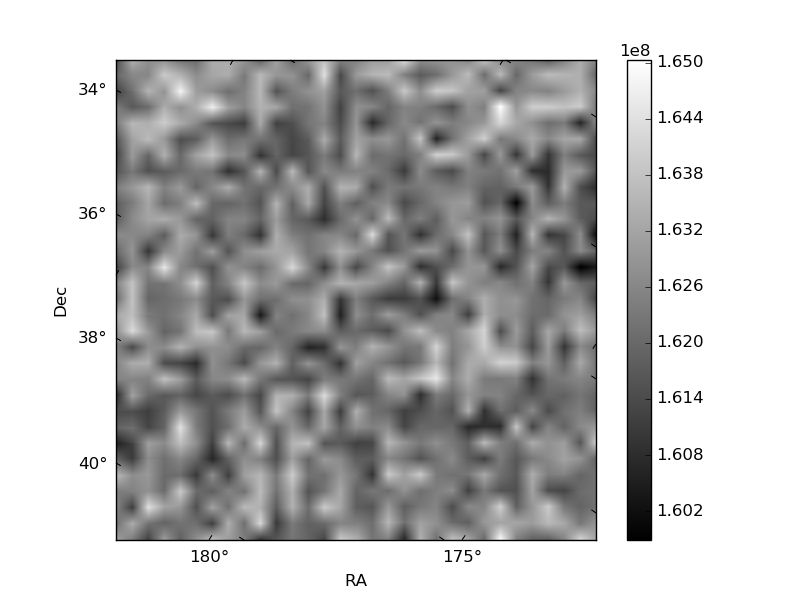
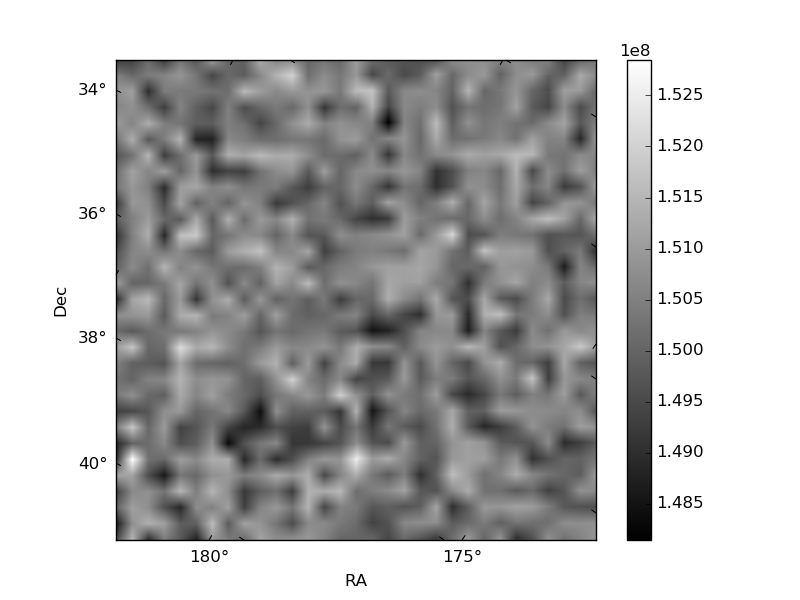
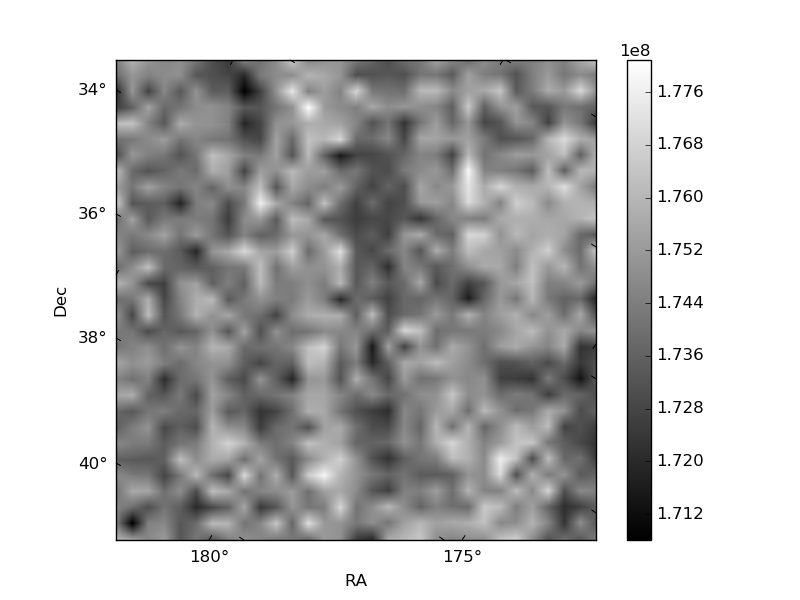
Histogram calculated using DETX and DETY for each event in the final _common_clean file
| Quadrant A | 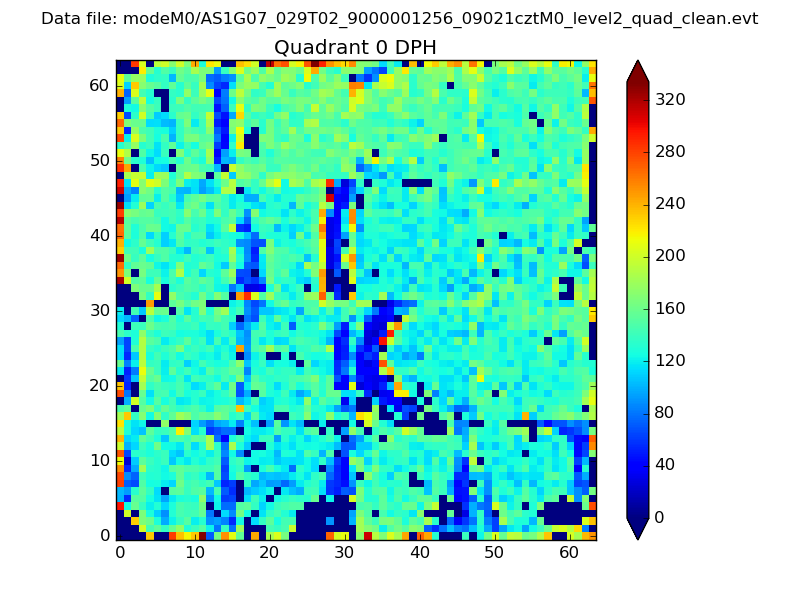 |
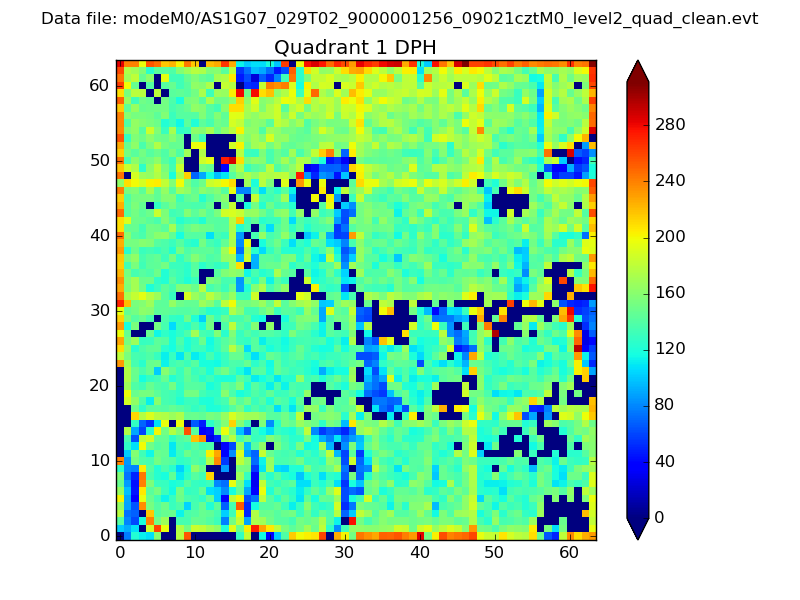 |
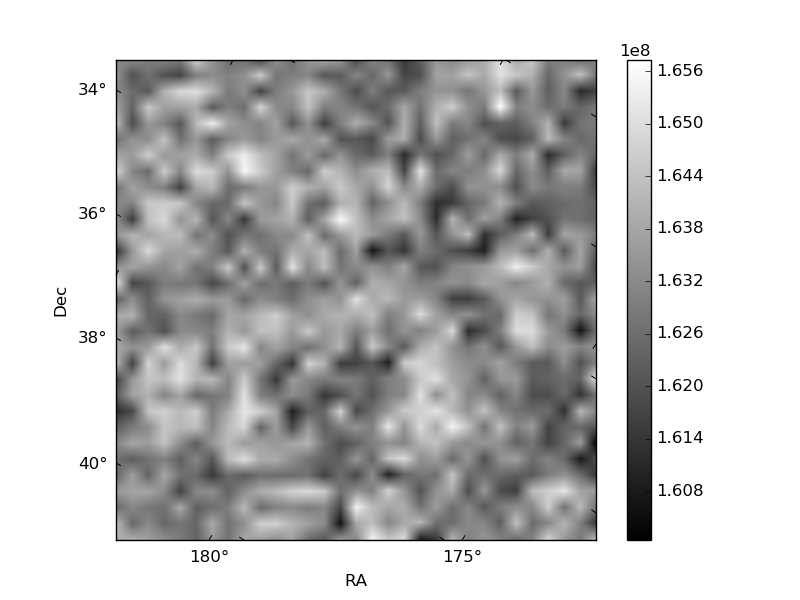
Quadrant B |
|---|---|---|---|
| Quadrant D | 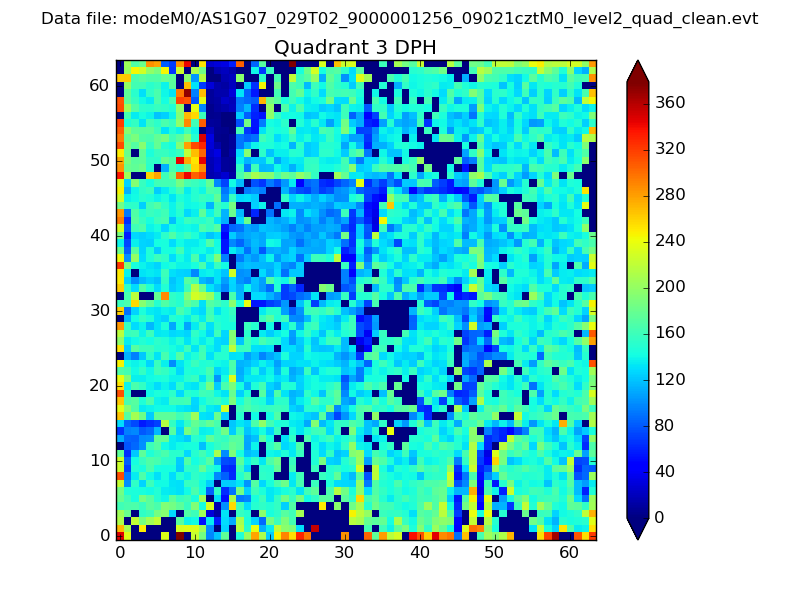 |
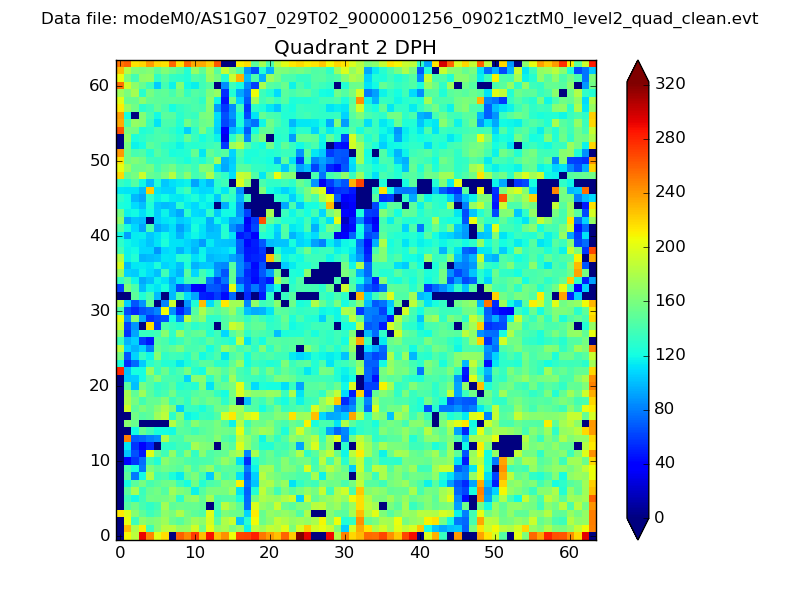 |
Quadrant C |
| Plot type | Count rate plots | Images |
|---|---|---|
| Comparison with Poisson distribution Blue bars denote a histogram of data divided into 1 sec bins. Red curve is a Poisson curve with rate = median count rate of data. |
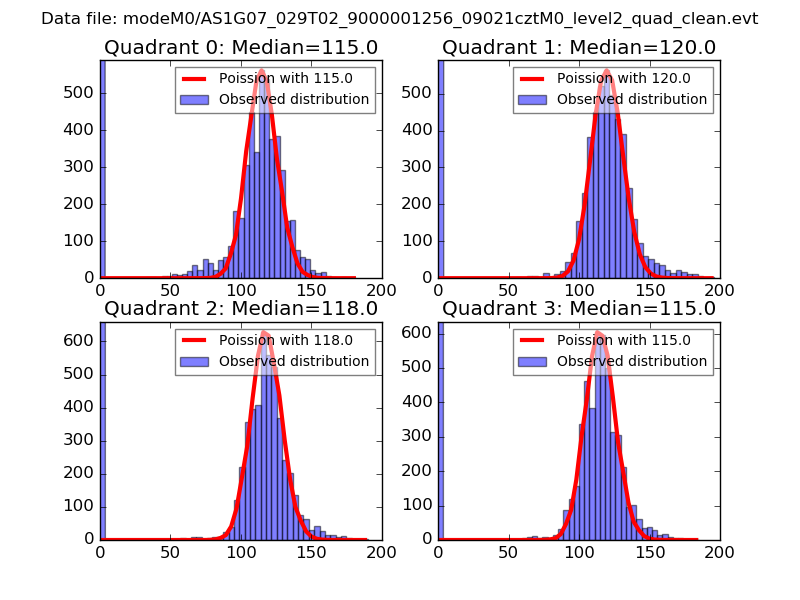 |
 |
| Quadrant-wise count rates Data is divided into 100 sec bins |
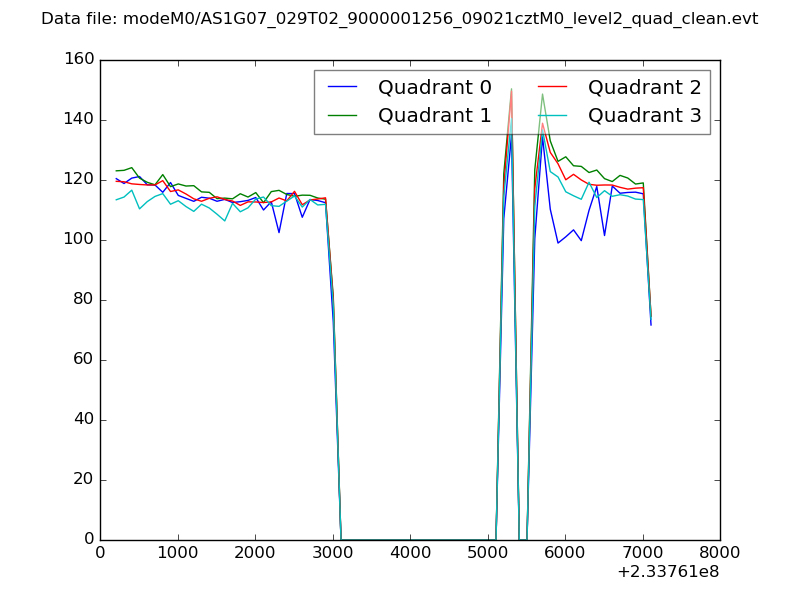 |
|
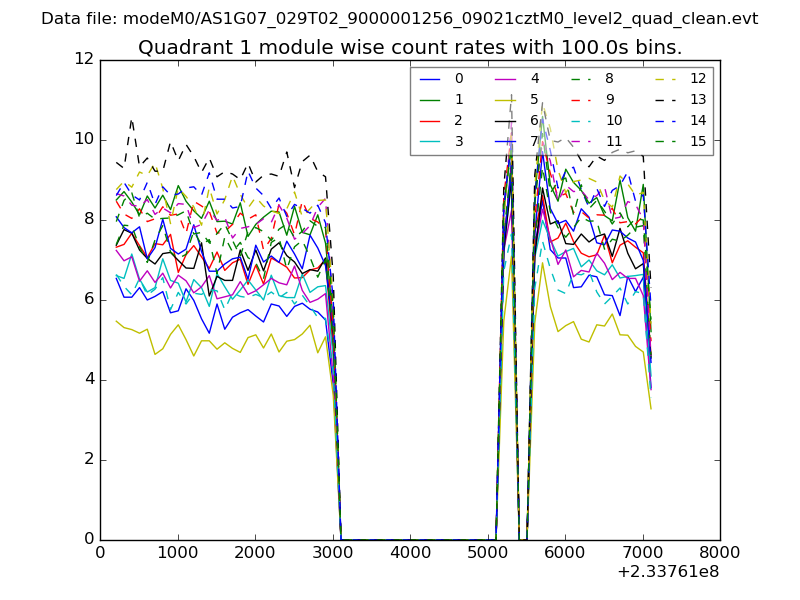
| Module-wise count rates for Quadrant A Data is divided into 100 sec bins |
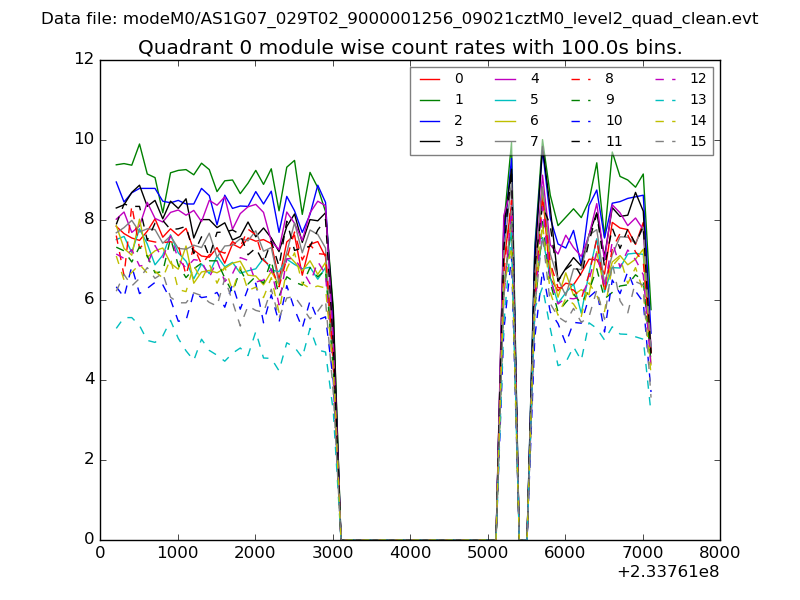 |
 |
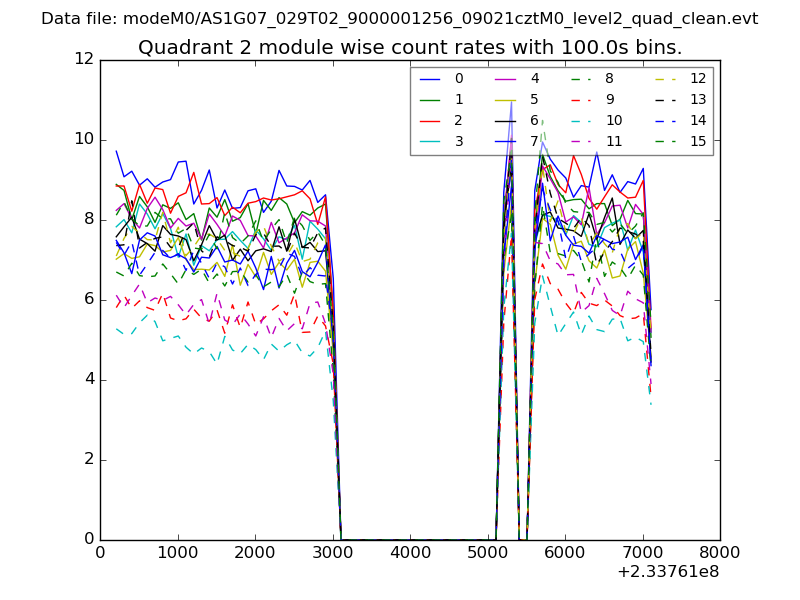
| Module-wise count rates for Quadrant B Data is divided into 100 sec bins |
 |
 |
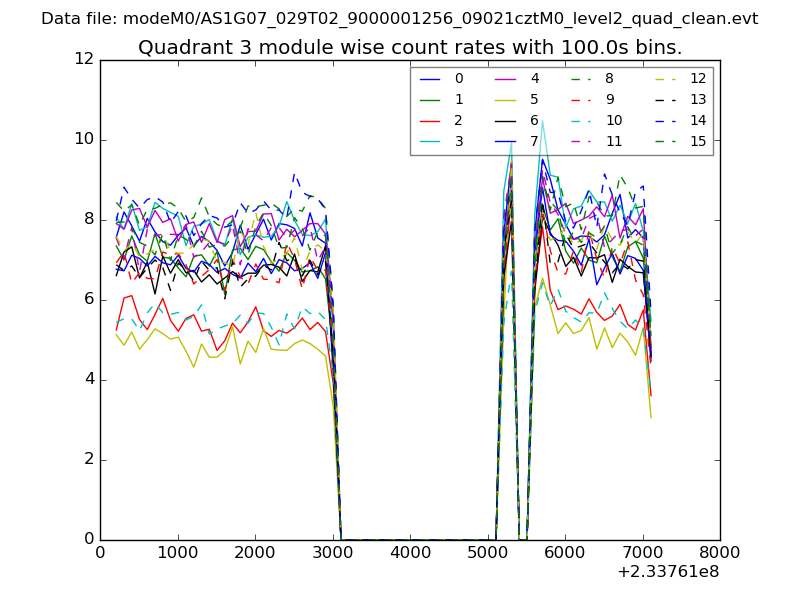
| Module-wise count rates for Quadrant C Data is divided into 100 sec bins |
 |
 |
| Module-wise count rates for Quadrant D Data is divided into 100 sec bins |
 |
 |
| Parameter | Plot |
|---|---|
| CZT HV Monitor | 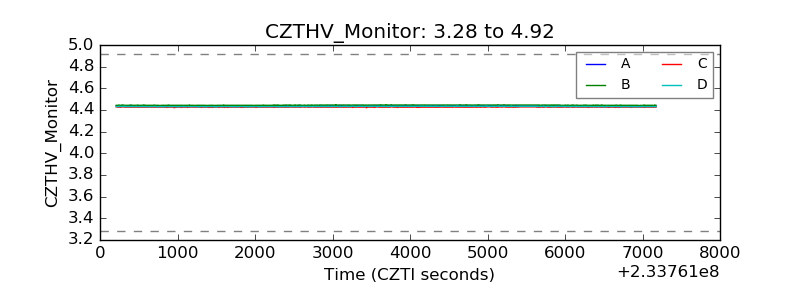 |
| D_VDD | 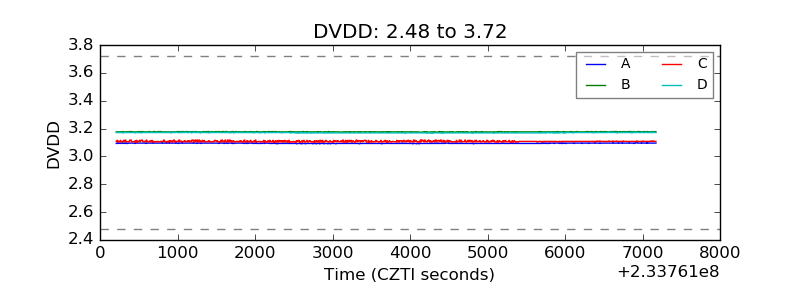 |
| Temperature 1 | 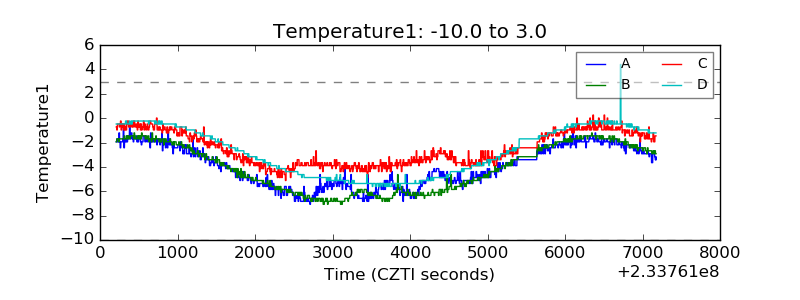 |
| Veto HV Monitor | 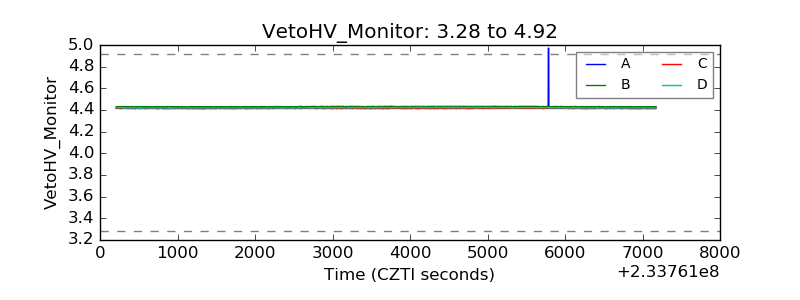 |
| Veto LLD | 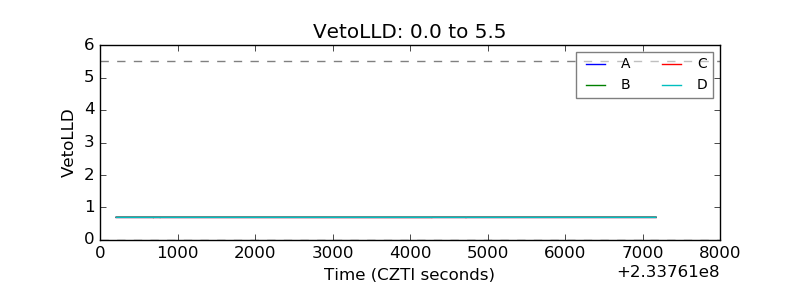 |
| Alpha Counter | 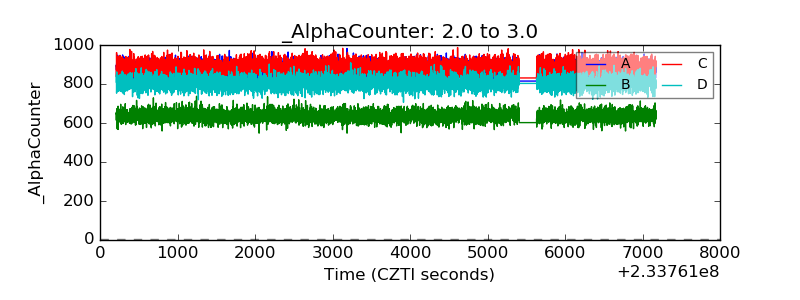 |
| _CPM_Rate | 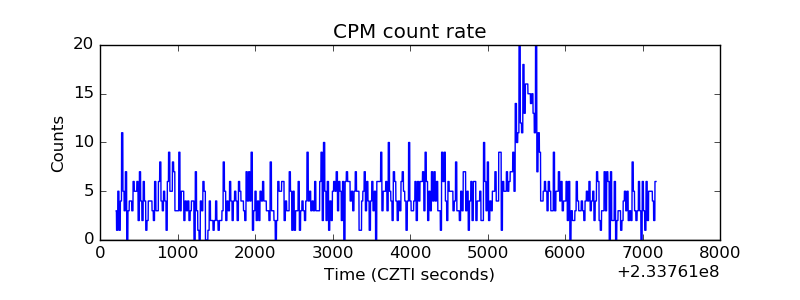 |
| CZT Counter | 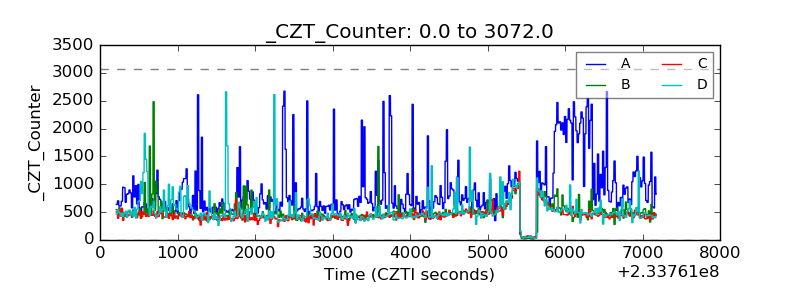 |
| +2.5 Volts monitor |  |
| +5 Volts monitor |  |
| _ROLL_ROT | 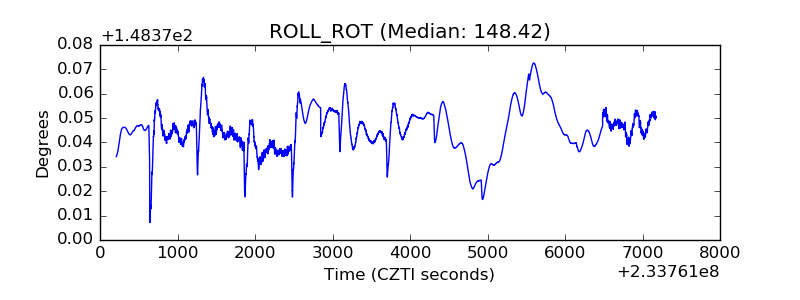 |
| _Roll_DEC | 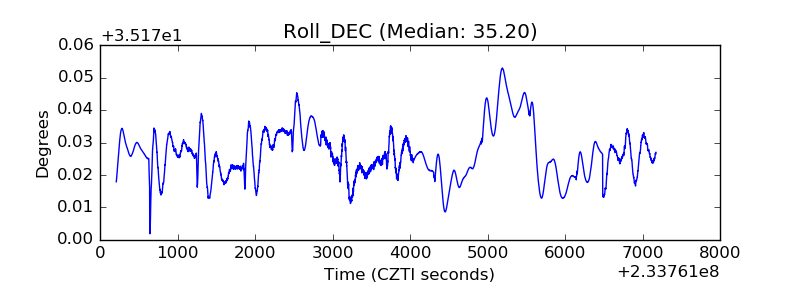 |
| _Roll_RA | 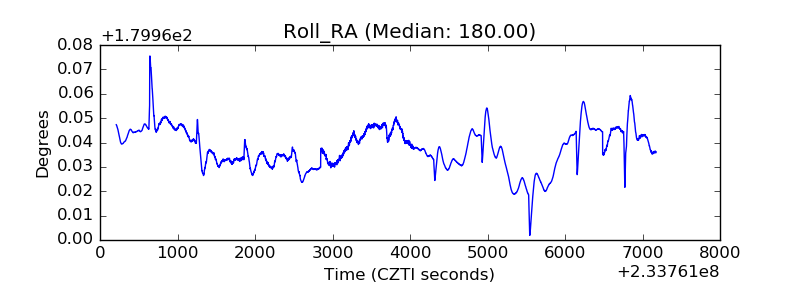 |
| Veto Counter | 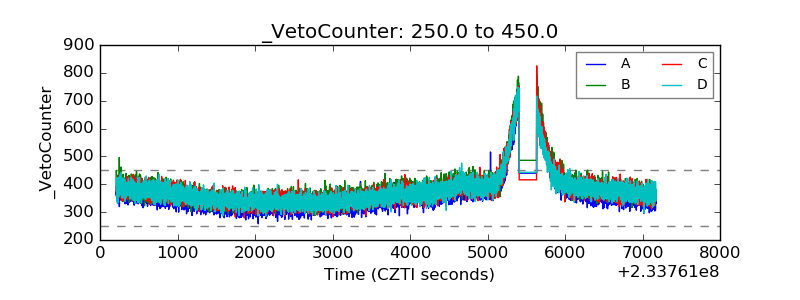 |